

Abstract
Initial administration of ≥ 60% nitrous oxide (N2O) to rats promotes hypothermia primarily by increasing whole-body heat loss. We hypothesized that the drug promotes heat loss via the tail and might initially inhibit thermogenesis via brown adipose tissue (BAT), major organs of thermoregulation in rodents. Following repeated administrations, N2O inhalation evokes hyperthermia underlain by increased whole-body heat production. We hypothesized that elevated BAT thermogenesis plays a role in this thermoregulatory sign reversal. Using dual probe telemetric temperature implants and infrared (IR) thermography, we assessed the effects of nine repeated 60% N2O administrations compared to control (con) administrations on core temperature, BAT temperature, lumbar back temperature and tail temperature. Telemetric core temperature, telemetric BAT temperature, and IR BAT temperature were reduced significantly during initial 60% N2O inhalation (p<0.001 compared to con). IR thermography revealed that acute N2O administration unexpectedly reduced tail temperature (p=0.0001) and also inhibited IR lumbar temperature (p<0.0001). In the 9th session, N2O inhalation significantly increased telemetric core temperature (p=0.007) indicative of a hyperthermic sign reversal, yet compared to control administrations, telemetric BAT temperature (p=0.86), IR BAT temperature (p=0.85) and tail temperature (p=0.47) did not differ significantly. Thus, an initial administration of 60% N2O at 21°C may promote hypothermia via reduced BAT thermogenesis accompanied by tail vasoconstriction as a compensatory mechanism to limit body heat loss. Following repeated N2O administrations rats exhibit a hyperthermic core temperature but a normalized BAT temperature, suggesting induction of a hyperthermia-promoting thermogenic adaptation of unknown origin.
Keywords: Allostasis, drug tolerance, addiction, thermoregulation, physiological adaptation, infrared thermography
1. Introduction
Nitrous oxide (N2O) is a pharmacologically active gas with properties that make it ideal for studying the nature of three phenomena of major importance in the pathophysiology of drug addiction, namely initial drug sensitivity, drug tolerance and allostasis. Initial administration of ≥ 60% N2O generally evokes hypothermia (Kaiyala, Butt, & Ramsay, 2007a, 2007b; Kaiyala, Chan, & Ramsay, 2012; Kaiyala et al., 2001; Kaiyala & Ramsay, 2005; Kaiyala, Woods, & Ramsay, 2014; Ramsay et al., 1999; Ramsay, Woods, & Kaiyala, 2014b), but some individuals are reliably insensitive to this effect while others are reliably highly sensitive to it (Kaiyala et al., 2012; Kaiyala et al., 2001). Repeated N2O administration on separate days engenders tolerance to the hypothermic effect such that core temperature remains at or near its baseline value during drug administration (Kaiyala et al., 2007b; Kaiyala et al., 2012), and with additional administrations a markedly adapted phenotype develops wherein core temperature rises significantly above baseline during drug administration. The latter “sign-reversal” phenomenon represents a form of drug-induced allostasis defined by us as a regulatory anomaly wherein a regulated variable or effector response departs significantly from values predicted by the homeostatic model of regulation (Ramsay & Woods, 2014; Ramsay, Woods, et al., 2014b).
Using a model that combines direct calorimetry, indirect calorimetry and non-invasive core temperature assessment, we have documented that N2O reliably promotes increases in both dry and evaporative heat loss during initial and subsequent administrations, while acquired increases in intra-administration metabolic heat production contribute importantly to the development of hypothermic tolerance and hyperthermic allostasis (Kaiyala et al., 2007a, 2007b; Kaiyala et al., 2012; Kaiyala & Ramsay, 2005). Importantly, the mechanisms underlying initial N2O sensitivity, tolerance and allostasis cannot be explained by alterations in drug concentration within or across sessions because the drug’s concentration in the body equals the inspired concentration, which is “clamped” during administration, and because N2O undergoes very little metabolism (Trudell, 1985).
The mechanisms underlying N2O’s initial and acquired thermal actions have not been identified. However, rats rely heavily upon BAT as an organ of facultative thermogenesis (Cannon & Nedergaard, 2004), while modulation of tail blood flow plays an important role in heat loss in rodents (C. J. Gordon, 1990; C.J. Gordon, 1993). Accordingly, we predicted that N2O’s effect to increase dry heat loss is mediated at least in part by increased tail blood flow and specifically hypothesized that 60% N2O administration would increase tail temperature. Because initial ≥60% N2O administration can inhibit whole-body heat production (e.g., (Kaiyala et al., 2012; Kaiyala & Ramsay, 2005)) whereas intra-administration heat production reliably increases significantly in response to serial administrations (e.g., (Kaiyala et al., 2007b; Kaiyala et al., 2012; Kaiyala et al., 2014)), we hypothesized both that initial 60% N2O administration might reduce brown adipose tissue (BAT) thermogenesis and that a subsequent acquired increase of BAT thermogenesis (Morrison, Madden, & Tupone, 2014) might underlie the sign-reversal hyperthermia that develops in response to serial administrations. The present study was designed to test these predictions using a combination of dual probe telemetry to simultaneously measure BAT and intraperitoneal temperatures, and using infrared (IR) thermography to measure skin temperature over interscapular BAT, tail skin temperature, and skin temperature of the lumbar back region.
2. Methods
2.1. Subjects
Male Long-Evans rats (N=24, 12 squads of 2 rats / squad) were obtained from Charles River at 50–55 days of age and housed at 21±1°C on a 12:12 light/ dark cycle on ad-libitum pelleted chow diet (lights on at 07:00 hours) in an AAALAC-accredited satellite animal housing room contained within our laboratory. Rats were randomly assigned to receive either repeated N2O or control gas exposures (n=12 / group). All procedures were approved by the University of Washington’s Institutional Animal Care and Use Committee.
2.2. Surgical procedures
Seven days prior to the first drug exposure, a dual probe temperature sensor/transmitter from Data Sciences International (DSI) was implanted surgically into each rat with one of the thermistor probes placed into the peritoneal cavity and the other between the lobes of the interscapular BAT. The dual probe telemetric transmitter in conjunction with DSI receivers and software permit remote temperature measurement from the locations of interest. Briefly, the abdominal cavity was opened and the body of the transmitter and one of the external probes were placed into the cavity. The other probe was tunneled subcutaneously to the region of the BAT and tethered in place with sutures (a more detailed description can be found in the surgical manual and technical notes provided by DSI). Prior to surgery, an approximately 4×4 cm area over the interscapular region of the BAT and an approximately 3×3 cm area over the lumbar back region were depilated free of fur to expose the skin in these areas to permit the IR imaging. These regions were routinely maintained by shaving or depilation to remain free of fur over the duration of the study.
2.3. Experimental protocol and infrared recordings
Following recovery from surgery, each rat in a squad was tested individually in a custom-built gas-tight testing apparatus (Figure 1A) that consisted of a polycarbonate chamber with a custom-made pyramid-shaped lid mounted with an IR camera (FLIR Commercial Systems Inc. model A325sc thermographic imaging infrared camera with 9.7mm 45° wide angle lens). Experiments were conducted in a room maintained at 21±1°C.
Figure 1.

(A) Simplified artists rendering of apparatus for infrared (IR) thermographic assessment of skin surface temperature during nitrous oxide or control gas administration. (B) Diagram illustrating criteria for including brown adipose tissue (BAT) telemetric temperature measurements based on post-hoc probe analysis. (*) Good placement in BAT region; (#) Slightly below BAT region (presumably due to rat growth over the 1 week post-surgical period plus the 3-week testing period; data from rats with BAT probes falling outside of interscapular region and immediate periphery were not included in the data analyses. Dotted-line box outlines the regions from which IR recordings were obtained. (C) Representative IR thermographic image obtained during 60% nitrous oxide administration.
Each rat underwent 9 sessions (3x/week for 3 weeks) of exclusive exposure to either control gas (custom-blended air) for the control group or 60% N2O for the experimental group. The order of gas administrations was switched for consecutive squads to counterbalance the time of day (i.e. if N2O in a.m.; control gas in p.m. for one squad, then control gas in a.m.; N2O in p.m. for the next squad tested). Each rat was weighed prior to each test. All sessions began with a two-hour baseline exposure to control gas followed by 90 minutes of exposure to the test gas. Gases were delivered at 2.5 liters/min (14.9 liter total chamber volume). 60% N2O was chosen based on previous work indicating a substantial hypothermic effect (Kaiyala et al., 2007a, 2007b; Kaiyala & Ramsay, 2005; Kaiyala et al., 2014; Ramsay, Kaiyala, Leroux, & Woods, 2005). Control gas and the N2O blend were blended, delivered and analyzed as described (Kaiyala et al., 2012).
Continuous telemetric recordings were obtained over the duration of each session. The DSI telemetric data acquisition system used Dataquest A.R.T. Gold Analysis software (DSI, version 4.31) with a TL11M3F40-TT Dual Probe Transmitter. The IR data were acquired at a rate of 1 frame / 12 sec (5 frames/min) using ExaminIR Pro image analysis software (FLIR, version 1.40.12). Emissivity was set at 0.98 (emissivity of the skin). Animals were returned to their home-cages between testing sessions. At the end of the 3-week testing period, rats were euthanized humanely and post-hoc probe locations were assessed and recorded (see Fig. 1B diagram).
2.4. Image Analysis Procedure
IR thermographic images were independently analyzed by two scorers who were blind to treatment group using identical scoring criteria. Briefly, for every fifth image obtained during each session the scorer drew boxes to outline the perimeters of the shaved BAT area, lumbar area, and a freehand shape around the tail. The maximum temperature within each of these regions of interest (ROI) was automatically determined by the image processing software and then was manually entered into an excel spreadsheet.
2.5. Data Reduction and Statistical Methods
For statistical analyses and graphical displays involving uncertainty estimates, within session data were averaged (mean) into 6-min baseline and 90-min post-baseline periods. Inferential analyses were performed using the linear mixed model procedure in SPSS (v. 23, IBM Corp., Somers, NY). Thermal outcomes were adjusted for baseline and treatment (N2O or control gas) by exposure session interactions.
3. Results
The expected effect of initial 60% N2O administration to promote hypothermia was associated with marked reductions of BAT temperatures measured both by telemetry and IR thermography (Figures 2, 3, and 4). Core temperature and measures of BAT temperature increased across exposure sessions, but only core temperature exhibited a hyperthermic sign reversal (Figure 2, 3, and 4). Therefore, reduced BAT thermogenesis during initial N2O administrations might contribute to hypothermia (Figure 2, 3, and 4). This possibility is supported by noting that during drug administration in exposure 1, baseline-adjusted telemetric Δ BAT temperature decreased significantly more than did adjusted Δ core temperature (−0.70± 0.119 °C, p=0.001). In contrast, in exposure 9, baseline-adjusted telemetric Δ BAT temperature during drug administration did not increase more than Δ core temperature (−0.25 ± 0.228 °C, p=0.30).
Figure 2.

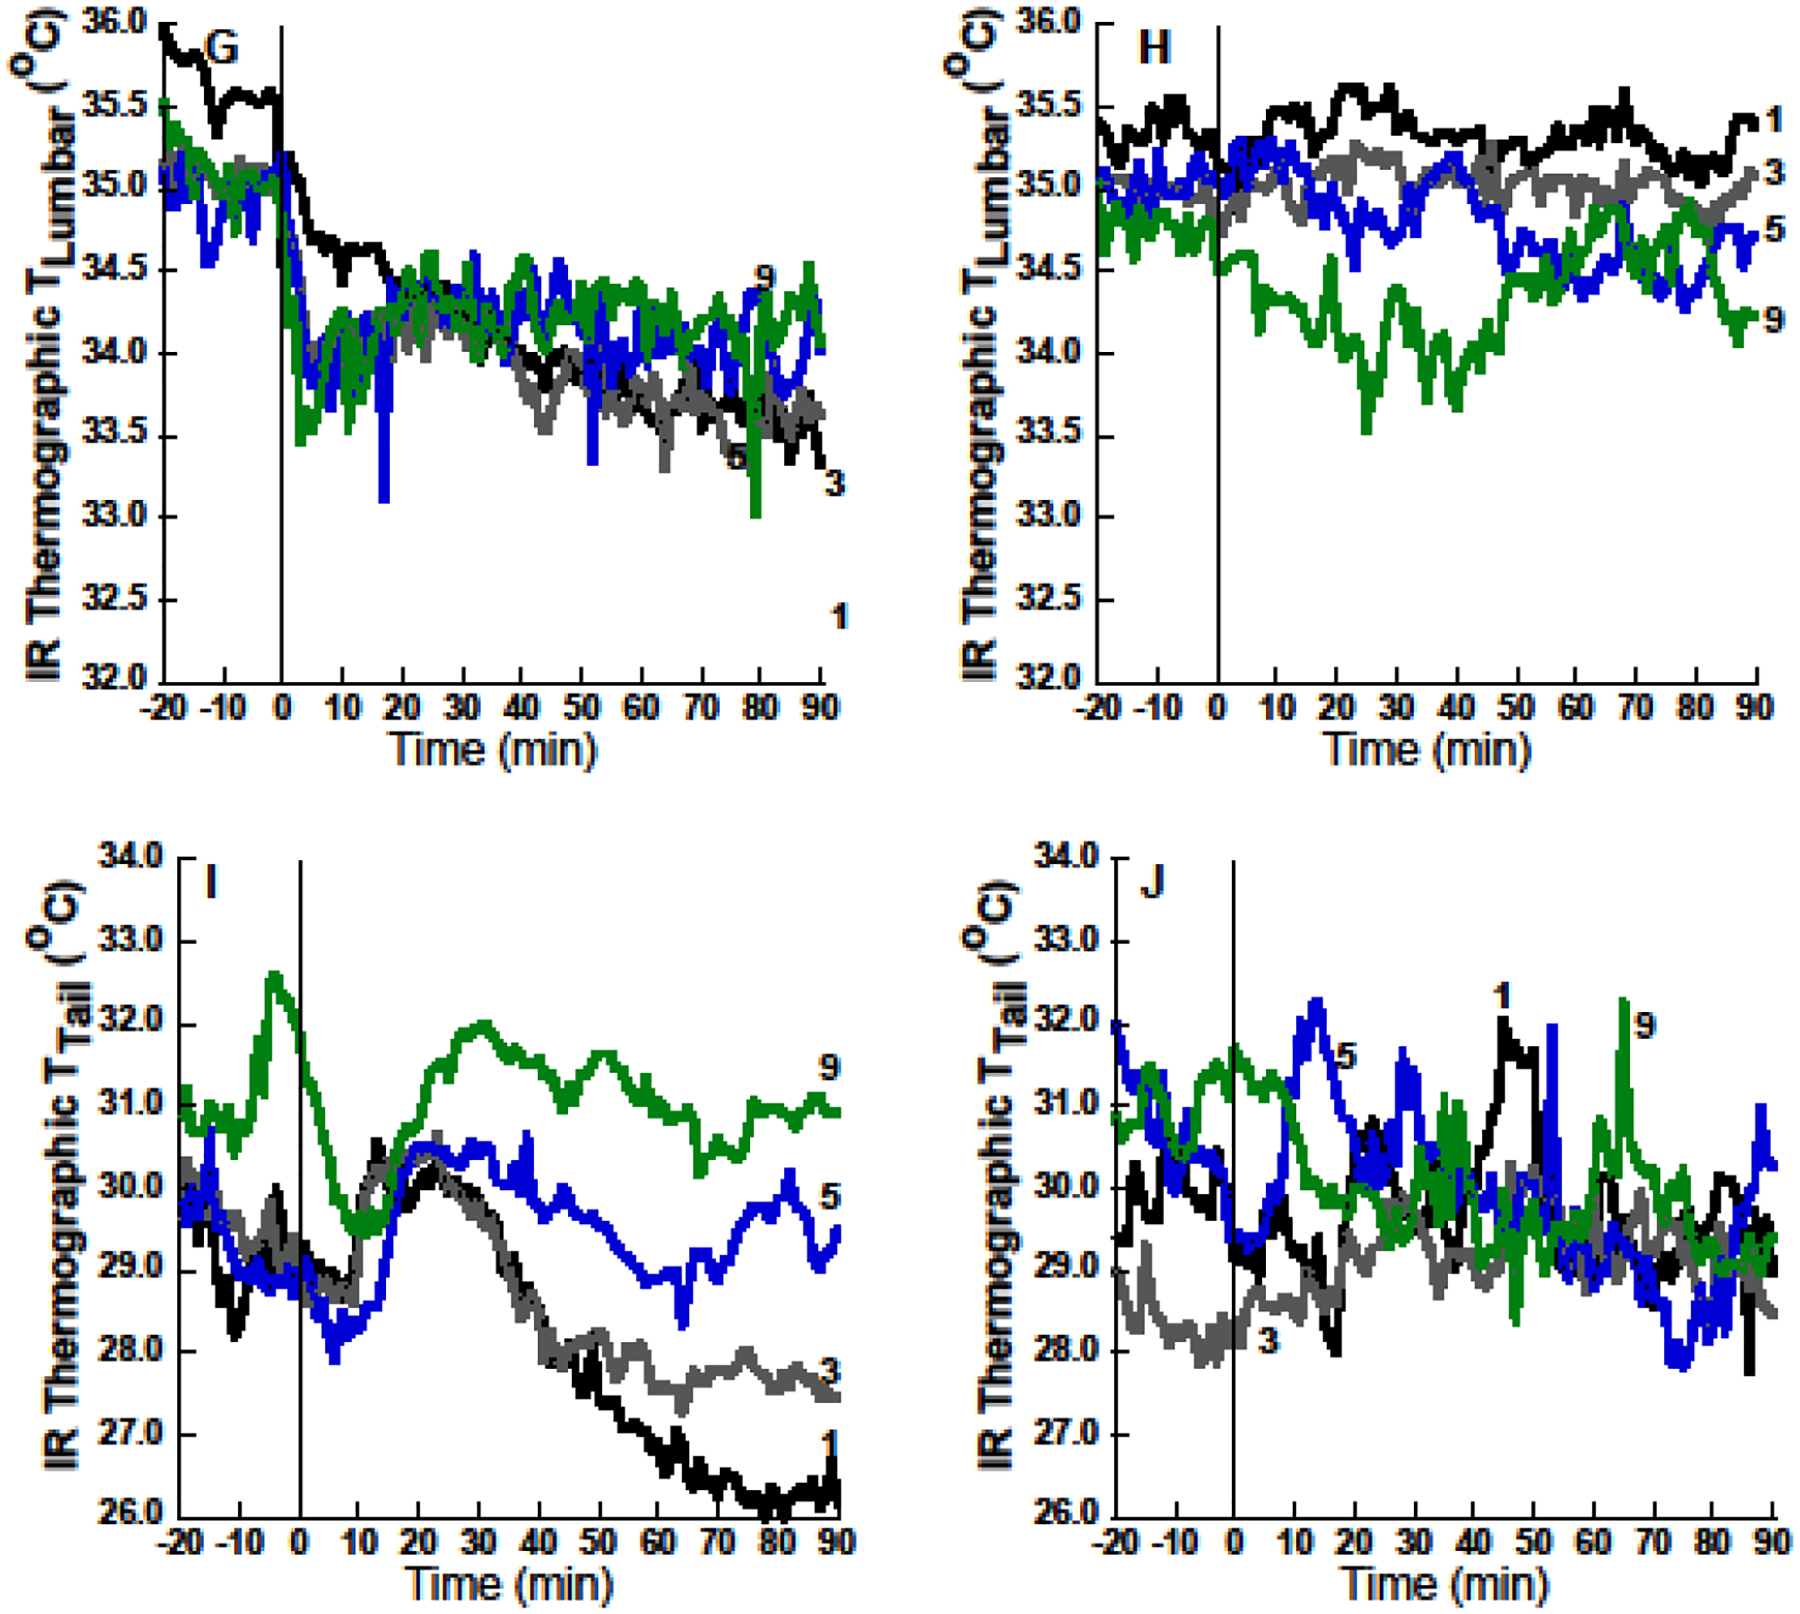
Mean thermal excursions during exposures 1, 3, 5 and 9 during 60% nitrous oxide (N2O; left panels) or control gas (right panels) groups. (A) Core temperature (Tcore) excursions are congruent with telemetric brown adipose tissue (BAT) temperatures (C). Infrared (IR) thermographic temperatures of the skin surface over BAT (E) diverge from telemetric BAT or core temperature dynamics (note transient temperature decreases in (E) immediately following N2O onset during period in which actual BAT and core temperatures were starting to rise). (G) and (I) depict IR thermographic measurements of shaved lumbar skin, and tail skin, respectively. Note that IR measurements are noisy in comparison to telemetry. Sample sizes: n=10–12 rats per session per group except n=8 for telemetric BAT temperature because a rat’s BAT data were excluded if the probe was not in the region of the BAT at the conclusion of the study.
Figure 3.

Mean changes from baseline ± 95% confidence limits during 60% nitrous oxide (N2O) or control gas administration. Comparison of (A) and (B) suggests that inhibition of brown adipose tissue (BAT) thermogenesis during initial N2O administration is a mechanism of core temperature hypothermia, but that adaptation of BAT across exposure sessions does not fully account for the significant hypothermic-to-hyperthermic inversion of core temperature. The pattern of infrared (IR) thermographic BAT temperatures (C) did not correspond well to the telemetric BAT temperature changes in (B). Reliably reduced IR measurement of skin temperature (relative to baseline) over lumbar back region during all N2O exposure sessions (D) suggests that reduced skin blood flow is a mechanism of heat conservation during N2O inhalation. Similarly, tail temperature changes (E) suggest that reduced tail blood flow participates as a heat conservation mechanism during N2O inhalation. Panel (F) depicts the association between unadjusted Δ core temperature and unadjusted Δ BAT temperature for all N2O-treated rats across all exposure sessions. Sample sizes: n=10–12 rats per session per group except n=8 for telemetric BAT temperature. Means and uncertainty estimates are adjusted for baseline and treatment by exposure interactions using mixed model analysis. 95% confidence intervals that do not include zero are significantly different from baseline at p < 0.05.
Figure 4.

95% confidence intervals for N2O minus control group differences. Sample sizes: n=10–12 rats per session per group except n=8 for telemetric BAT temperature. Confidence intervals that do not include zero denote group differences that differ at p < 0.05. Linear trends across exposure sessions are all significant at p<0.0001. Uncertainty estimates are adjusted for baseline and treatment by exposure interactions using mixed model analysis.
BAT temperatures estimated from the temperatures of the shaved skin over the interscapular area (BAT IR temperature) decreased significantly during N2O inhalation, but did not entirely mirror actual BAT temperatures measured via telemetry (Figures 2, 3, and 4). The failure of IR imaging to describe the temporal dynamics of telemetrically assessed BAT is particularly noteworthy (Figure 2E; note transient decrease compared to Figure 2C). Thus, thermographic measures of BAT activation during challenges to thermal homeostasis should be interpreted with some caution. It seems likely that reduced skin blood flow during N2O inhalation, as indicated by the decreased temperature of the shaved skin over the back region (Figures 2G, 3D, F), masks heat produced by the BAT below the body surface. The finding of reliably reduced IR lumbar temperature during N2O inhalation compared to control gas inhalation in the first six exposures also indicates that reduced skin blood flow serves as a heat conservation mechanism that could contribute to the development of core temperature hyperthermia during N2O inhalation.
Tail surface temperature measured via thermography (Tail IR) decreased during initial N2O exposure (Figures 2, 3, and 4) while a sub-analysis examining Tail IR in the first 30 min failed to disclose a transient increase compared to control rats that might have helped promote heat loss in exposure 1 (p=0.85). These findings refute the hypothesis that the tail serves as an important avenue of increased heat loss during an initial N2O exposure. Instead, the reduction of tail surface temperature again suggests that reduced tail blood flow is recruited as a compensatory mechanism to limit the magnitude of hypothermia during the first several N2O inhalations.
4. Discussion
The effects of ≥60% N2O to evoke hypothermia upon initial administration to rats, but to evoke hyperthermia in rats adapted to serial N2O administrations are well documented by our group (Kaiyala et al., 2007a, 2007b; Kaiyala et al., 2012; Kaiyala et al., 2001; Kaiyala & Ramsay, 2005; Kaiyala et al., 2014; Ramsay et al., 2015; Ramsay et al., 2005; Ramsay, Seaman, & Kaiyala, 2011; Ramsay, Woods, & Kaiyala, 2014a; Ramsay, Woods, et al., 2014b). Moreover, we have documented that the initial hypothermic effect is underlain by a state of negative heat balance caused by a marked increase of whole-body heat loss accompanied by a reduction of or no change in whole-body heat production, while the subsequent acquisition of an intra-administration hyperthermic state is primarily due to a marked increase of heat production (Kaiyala et al., 2007a, 2007b; Kaiyala et al., 2012; Kaiyala & Ramsay, 2005; Kaiyala et al., 2014; Ramsay et al., 2015; Ramsay, Woods, et al., 2014b). However, the mechanisms underlying the alterations of heat loss and heat production have not been identified. The present study was designed as a novel test of the hypotheses that elevated tail temperatures combined with reduced BAT thermogenesis would help explain N2O’s initial hypothermic effect, and that the highly reliable intra-administration hyperthermic sign-reversal acquired in response to repeated ≥60% N2O inhalations would involve elevated BAT thermogenesis. However, our results yield more questions than answers. Although we did implicate reduced BAT thermogenesis as a possible contributor to the hypothermia observed during initial 60% N2O inhalation, we did not obtain evidence that elevated BAT thermogenesis contributes to the hyperthermic sign-reversal that develops during N2O inhalation following repeated administrations.
Consistent with the reductions that were observed in the two measures of BAT thermogenesis during initial N2O inhalation, we have previously observed a reduction in whole body energy expenditure measured by respirometric indirect calorimetry during initial ≥60% N2O administration in some animals (Kaiyala et al., 2012; Kaiyala & Ramsay, 2005), although this effect has not been observed in all studies (Kaiyala et al., 2007b).
The failure to observe an increase in tail temperature during 60% N2O inhalation is puzzling as that possibility seemed like a strong candidate as a mechanism for increased dry heat loss. Instead, our data suggest that tail-mediated heat loss during initial 60% N2O inhalation was actually reduced in our study. However, it is important to note that we have repeatedly documented significant and substantial increases in whole-body dry and evaporative heat loss in every study in which we have measured these outcomes (Kaiyala et al., 2007a, 2007b; Kaiyala et al., 2012; Kaiyala & Ramsay, 2005; Kaiyala et al., 2014; Ramsay et al., 2015). Moreover, the increase in heat loss has been observed even in rats that exhibited minimal hypothermia during N2O inhalation, e.g., (Kaiyala et al., 2012; Kaiyala & Ramsay, 2005). Accordingly, while we did not measure whole-body heat loss in the present study, it is very likely that the animals did respond with substantially elevated heat loss, which should have made it possible to detect increases of tail temperature had they occurred. We suggest that increased evaporative heat loss might have contributed to the hypothermic effect, and also speculate that increased heat loss via the paws might contribute to N2O’s heat loss effect as the paws in rodents serve as heat exchangers involved in the regulation of core temperature (El Bitar et al., 2014), and paw temperature has been shown to increase markedly upon administration of a hypothermia-promoting pesticide (C. J. Gordon & Watkinson, 1988).
The mean 90-min hypothermic magnitude observed in the present study (−0.46 °C relative to baseline; −0.49 °C relative to control) was somewhat less than the 90-min change observed in previous studies (e.g., −0.7 °C in similarly-aged rats (Kaiyala et al., 2007b)). However, this modest disparity is consistent with the concept that the point estimate for a sample-based mean effect is expected to vary across study replications in accordance with elementary sampling theory (Rosner, 2000). Such variation is certainly expected for N2O hypothermia given the documented existence of wide inter-individual variability in initial sensitivity to the drug’s hypothermic effect, e.g., (Ramsay et al., 2015; Ramsay et al., 2005). Importantly, we did replicate the hyperthermic sign reversal in the present study indicating that the mechanism for this phenomenon was apparently engaged.
The reduction in tail temperature (and also of lumbar back temperature) may be indicative of a heat conservation response that limited the development of hypothermia in the face of increased evaporative heat loss and the substantial reduction of BAT thermogenesis during initial 60% N2O administration. Moreover, the persistence of a reflexive tendency for reduced body surface temperature during N2O inhalation would also be expected to contribute to the development of hyperthermia in later drug exposures. It is important to note that the testing temperature of 21°C is below thermoneutrality for Long-Evans rats (reported as ~28 – 30.5°C (C.J. Gordon, 1993); in studies done by our lab during the light cycle, young untreated rats select a mean ambient temperature of ~27°C while older rats prefer ~25°C (Ramsay et al., 2011; Ramsay, Woods, et al., 2014a, 2014b)). Whole body thermal conductance supposedly decreases to a minimum when a homeothermic animal transitions below the lower critical threshold of the thermoneutral zone (Schmidt-Nielsen, 1997) such that it might be predicted that tail blood flow and thus tail temperature would be maximally reduced at our testing temperature of 21°C, yet we observed a further decrease in this outcome during initial N2O administration. In addition, we observed reliable decreases of thermographic measurements of lumbar back temperature across the nine 60% N2O administrations. Thus skin and tail temperatures exhibited the capacity for negative changes during 60% N2O inhalation at a sub-thermoneutral ambient temperature.
We had hypothesized that acquired increases in BAT thermogenesis would constitute a mechanism of the sign-reversed hyperthermic pattern of core temperature observed during subsequent N2O administrations. Our data do not support that prediction though, as mean interscapular BAT temperature during 60% N2O inhalation in later exposures merely became similar to BAT temperature during control exposures even as core temperature was becoming reliably hyperthermic (Figures 2, 3, and 4). One interpretation of this result is that tolerance developed to the initial effect of 60% N2O to inhibit BAT thermogenesis, which in turn, obviated a mechanism that originally favored reduced core temperature. If correct, then BAT tolerance played a secondary role in core temperature hyperthermia during 60% N2O inhalation. A competing interpretation is that the acquired hyperthermia transferred heat into BAT and therefore kept its temperature similar to control values despite a continuing effect of N2O to inhibit BAT heat production.
Analogous to our results, Marks and colleagues (Marks, Vianna, & Carrive, 2009) provided evidence that BAT does not contribute to nonshivering thermogenesis during conditioned fear in rats. If BAT thermogenesis does not contribute to the hyperthermic sign-reversal observed by our group or to thermogenesis during conditioned fear (Marks et al., 2009), than what does? One possibility is that a thermogenic alternative to BAT is recruited in response to repeated N2O administrations. Indeed, emerging data indicate that BAT is not the only important adaptable thermogenic tissue in homeothermic animals. Specifically, a distinct type of thermogenic cell, beige adipocytes (Wu et al., 2012), exists in white adipose tissue (WAT), and the thermogenic capacity of beige cells is sensitive to cold stress and other signals related to energy homeostasis such that WAT-beige tissue can function as an important thermogenic organ (Yang & Ruan, 2015). Thus, beige adipocytes might conceivably play a thermogenic role in rats adapted to 60% N2O. This possibility will be evaluated in future research.
Infrared determination of skin temperature over BAT (BAT IR thermography) during N2O inhalation did not yield a pattern of results that faithfully mirrored actual BAT temperature measured by telemetry (Figures 2, 3, and 4). Work by Marks and colleagues (Marks et al., 2009) comparing dual temperature recordings obtained via radio-telemetric thermocouples implanted between BAT and intrascapular muscles and IR surface temperature of the skin directly over the BAT region demonstrated higher average temperatures recorded via telemetry than via IR, but that the relative changes were comparable and well-correlated. In our study, however, telemetric BAT measurements compared to BAT IR thermography produced notably different temporal excursions during N2O administration, with the latter exhibiting incorrect initial transient decreases and also suggesting a slower rate of tolerance development (Figures 2, 3, and 4). We hypothesize that reduced thermal conductance due to diminished skin blood flow distorts the underlying thermal signal from BAT. As support for this concept, the clear demonstration that skin temperature decreased during N2O inhalation (lumbar IR thermography; Figures 2, 3, and 4) is consistent with reduced skin blood flow during N2O exposure.
Previous work has demonstrated that administration of 60% N2O significantly increases both dry heat loss and evaporative heat loss (Kaiyala et al., 2007a, 2007b; Kaiyala et al., 2012; Kaiyala & Ramsay, 2005; Kaiyala et al., 2014). As modulation of tail blood flow is an important mechanism of heat loss regulation in rodents, we had originally hypothesized that increased heat loss via the tail might contribute to the increase of dry heat loss observed in previous work. Our present data indicate, however, that tail temperature was reliably lower during the first N2O administration compared to control gas inhalation (Figures 2, 3, and 4), whereas in subsequent administrations N2O-treated and control rats did not exhibit reliably different tail temperature values. Thus, it seems unlikely that increased heat loss via the tail is a mechanism of increased whole-body heat loss during 60% N2O administration. This finding along with the observed reduction in back temperature and the sharp reduction in BAT temperature during N2O inhalation creates a puzzle. A limitation of the IR approach encountered by us and others (Marks et al., 2009) is the relatively frequent situation of the tail being obscured from view due to the animal’s posture. This resulted in a modest reduction in sample sizes (n=1–2 fewer animals per group per session) and also modestly reduced the data density upon which mean values were based.
As indicated above, increased dry heat loss has been observed repeatedly in previous studies involving 60% N2O administration to rats (Kaiyala et al., 2007a, 2007b; Kaiyala et al., 2012; Kaiyala & Ramsay, 2005; Kaiyala et al., 2014), yet our present data suggest that this occurs despite the apparent activation of mechanisms that serve to retard heat flow from animal to environment during 60% N2O administration. Accordingly, it would appear that an unidentified and influential avenue of dry heat loss is activated by N2O administration. This analysis also provides further evidence for the proposition that N2O administration simultaneously activates competing thermoeffector responses (Ramsay et al., 2015; Ramsay, Kaiyala, & Woods, 2014; Ramsay et al., 2011; Ramsay & Woods, 2014; Ramsay, Woods, et al., 2014a, 2014b).
We have been studying N2O’s actions with respect to core temperature and its underlying determinants as a means to better understand how biobehavioral control system-generated autonomic responses and motivational states might contribute to excessive drug taking behavior, an issue of great worldwide public health concern. We have been particularly interested in the basis of a well-replicated (Crabbe, Bell, & Ehlers, 2010; Quinn & Fromme, 2011; Schuckit, 1998, 2011) phenomenon first identified by Schuckit more than 30 years ago (Schuckit, 1980, 1994; Schuckit & Smith, 1996): Individuals with an apparently low initial sensitivity to alcohol are at increased risk for subsequently developing alcohol use disorders. The standard hypothesis to explain this phenomenon is that being relatively ‘insensitive’ favors greater consumption as a means to achieve a desired effect (Schuckit, 1980, 2009) and that greater sustained exposure to the drug promotes addiction-related phenomena, notably tolerance, withdrawal and dependence. An alternative perspective emphasizes the need to distinguish the pharmacological effects of the drug from the centrally mediated regulatory counter-responses that are generated by the engagement of biobehavioral control systems. We have hypothesized that a low initial sensitivity to a drug paradoxically hides underlying layers of sensitivity that confer robust regulatory compensation to the drug’s disturbing effects. Indeed, as drug sensitivity is traditionally measured at the level of a readily measureable summative distal outcome, then apparent stability at that level might be due to — and in the process mask — strong underlying effector responses that nullify the disruptive effect of the drug. In fact, we have provided direct evidence that the maintenance of complete normothermia at the level of core temperature during N2O administration can reflect robust regulatory compensation by a metabolic heat production response for an increased rate of heat loss (Kaiyala et al., 2007a). We have hypothesized (Ramsay et al., 2005; Ramsay & Woods, 1997, 2014) that phenotypes involving strong regulatory compensation for drug-induced disturbances render individuals more vulnerable to addiction, and we have provided data indicating that rats characterized by relative insensitivity to N2O at the level of core temperature when initially tested are indeed significantly and substantially more prone to N2O self administration compared to rats that were initially sensitive to N2O hypothermia; moreover, post-testing demonstrated that the initially insensitive rats did acquire a robust heat response to N2O inhalation in the course of self-administration (Ramsay et al., 2015). Therefore, it seems well justified to pursue a much fuller pre-clinical understanding of the basis of initial sensitivity and acquired responses to drug administration because this might eventually lead to more effective preventive and clinical approaches to the massive problem of drug addiction.
4.1. Conclusions
Our data suggest that the effect of initial 60% N2O to promote hypothermia in rats does not involve increased heat loss via the tail, but may involve an effect to inhibit BAT thermogenesis. The intra-administration hyperthermic sign reversal acquired across serial 60% N2O administrations does not appear to involve increased BAT thermogenesis. This finding implies that an as-yet unidentified non-BAT thermogenic tissue(s) accounts for the intra-administration hyperthermia in rats that are adapted to N2O administration.
Highlights.
Hypothermia evoked by initial 60% nitrous oxide (N2O) administration involves reduced brown adipose tissue (BAT) thermogenesis.
The within-administration hyperthermic sign reversal acquired in response to repeated 60% N2O administration does not appear to involve increased BAT thermogenesis, indicating a role for a thermogenic adaptation of unknown origin.
Acknowledgements
This research was supported by grants from the National Institutes of Health (National Institute on Drug Abuse under award number R03DA033453; National Institute of Dental and Craniofacial Research under award number T90DE021984). The content is solely the responsibility of the authors and does not necessarily represent the official views of the National Institutes of Health.
Abbreviations:
- N2O
nitrous oxide
- IR
infrared
- BAT
brown adipose tissue
Footnotes
Publisher's Disclaimer: This is a PDF file of an unedited manuscript that has been accepted for publication. As a service to our customers we are providing this early version of the manuscript. The manuscript will undergo copyediting, typesetting, and review of the resulting proof before it is published in its final citable form. Please note that during the production process errors may be discovered which could affect the content, and all legal disclaimers that apply to the journal pertain.
References
- Cannon B, & Nedergaard J (2004). Brown adipose tissue: function and physiological significance. Physiol Rev, 84(1), 277–359. doi: 10.1152/physrev.00015.2003 [DOI] [PubMed] [Google Scholar]
- Crabbe JC, Bell RL, & Ehlers CL (2010). Human and laboratory rodent low response to alcohol: is better consilience possible? Addict Biol, 15(2), 125–144. doi: 10.1111/j.1369-1600.2009.00191.x [DOI] [PMC free article] [PubMed] [Google Scholar]
- El Bitar N, Pollin B, Karroum E, Pincede I, Mouraux A, & Le Bars D (2014). Thermoregulatory vasomotor tone of the rat tail and paws in thermoneutral conditions and its impact on a behavioral model of acute pain. J Neurophysiol, 112(9), 2185–2198. doi: 10.1152/jn.00721.2013 [DOI] [PubMed] [Google Scholar]
- Gordon CJ (1990). Thermal biology of the laboratory rat. Physiol Behav, 47(5), 963–991. doi: 0031–9384(90)90025-Y [pii] [DOI] [PubMed] [Google Scholar]
- Gordon CJ, & Watkinson WP (1988). Behavioral and autonomic thermoregulation in the rat following chlordimeform administration. Neurotoxicol Teratol, 10(3), 215–219. [DOI] [PubMed] [Google Scholar]
- Gordon CJ (1993). Temperature regulation in laboratory rodents. Cambridge: Cambridge University Press. [Google Scholar]
- Kaiyala KJ, Butt S, & Ramsay DS (2007a). Direct evidence for systems-level modulation of initial drug (in)sensitivity in rats. Psychopharmacology (Berl), 191, 243–251. [DOI] [PubMed] [Google Scholar]
- Kaiyala KJ, Butt S, & Ramsay DS (2007b). Systems-level adaptations explain chronic tolerance development to nitrous oxide hypothermia in young and mature rats. Psychopharmacology (Berl), 191, 233–242. [DOI] [PubMed] [Google Scholar]
- Kaiyala KJ, Chan B, & Ramsay DS (2012). Robust thermoregulatory overcompensation, rather than tolerance, develops with serial administrations of 70% nitrous oxide to rats. J Therm Biol, 37(1), 30–40. doi: 10.1016/j.jtherbio.2011.10.004 [DOI] [PMC free article] [PubMed] [Google Scholar]
- Kaiyala KJ, Leroux BG, Watson CH, Prall CW, Coldwell SE, Woods SC, & Ramsay DS (2001). Reliability of individual differences in initial sensitivity and acute tolerance to nitrous oxide hypothermia. Pharmacol Biochem Behav, 68(4), 691–699. doi: S0091–3057(01)00488–9 [pii] [DOI] [PubMed] [Google Scholar]
- Kaiyala KJ, & Ramsay DS (2005). Assessment of heat production, heat loss, and core temperature during nitrous oxide exposure: a new paradigm for studying drug effects and opponent responses. Am J Physiol Regul Integr Comp Physiol, 288(3), R692–701. [DOI] [PubMed] [Google Scholar]
- Kaiyala KJ, Woods SC, & Ramsay DS (2014). Persistence of a hyperthermic sign-reversal during nitrous oxide inhalation despite cue-exposure treatment with and without a drug-onset cue. Temperature (Austin), 1(3), 268–275. doi: 10.4161/23328940.2014.944811 [DOI] [PMC free article] [PubMed] [Google Scholar]
- Marks A, Vianna DM, & Carrive P (2009). Nonshivering thermogenesis without interscapular brown adipose tissue involvement during conditioned fear in the rat. Am J Physiol Regul Integr Comp Physiol, 296(4), R1239–1247. doi: 10.1152/ajpregu.90723.2008 [DOI] [PubMed] [Google Scholar]
- Morrison SF, Madden CJ, & Tupone D (2014). Central neural regulation of brown adipose tissue thermogenesis and energy expenditure. Cell Metab, 19(5), 741–756. doi: 10.1016/j.cmet.2014.02.007 [DOI] [PMC free article] [PubMed] [Google Scholar]
- Quinn PD, & Fromme K (2011). Subjective response to alcohol challenge: a quantitative review. Alcohol Clin Exp Res, 35(10), 1759–1770. doi: 10.1111/j.1530-0277.2011.01521.x [DOI] [PMC free article] [PubMed] [Google Scholar]
- Ramsay DS, Al-Noori S, Shao J, Leroux BG, Woods SC, & Kaiyala KJ (2015). Predicting Addictive Vulnerability: Individual Differences in Initial Responding to a Drug’s Pharmacological Effects. PLoS ONE, 10(4), e0124740. doi: 10.1371/journal.pone.0124740 [DOI] [PMC free article] [PubMed] [Google Scholar]
- Ramsay DS, Kaiyala KJ, Leroux BG, & Woods SC (2005). Individual differences in initial sensitivity and acute tolerance predict patterns of chronic drug tolerance to nitrous-oxide-induced hypothermia in rats. Psychopharmacology (Berl), 181(1), 48–59. doi: 10.1007/s00213-005-2219-1 [DOI] [PMC free article] [PubMed] [Google Scholar]
- Ramsay DS, Kaiyala KJ, & Woods SC (2014). Correctly identifying responses is critical for understanding homeostatic and allostatic regulation. Temperature (Austin), 1(3), 157–159. [DOI] [PMC free article] [PubMed] [Google Scholar]
- Ramsay DS, Omachi K, Leroux BG, Seeley RJ, Prall CW, & Woods SC (1999). Nitrous oxide-induced hypothermia in the rat: acute and chronic tolerance. Pharmacol Biochem Behav, 62(1), 189–196. doi: S0091305798001567 [pii] [DOI] [PubMed] [Google Scholar]
- Ramsay DS, Seaman J, & Kaiyala KJ (2011). Nitrous oxide causes a regulated hypothermia: rats select a cooler ambient temperature while becoming hypothermic. Physiol Behav, 103(1), 79–85. 10.1016/j.physbeh.2010.12.018 [DOI] [PMC free article] [PubMed] [Google Scholar]
- Ramsay DS, & Woods SC (1997). Biological consequences of drug administration: implications for acute and chronic tolerance. Psychol Rev, 104(1), 170–193. [DOI] [PubMed] [Google Scholar]
- Ramsay DS, & Woods SC (2014). Clarifying the roles of homeostasis and allostasis in physiological regulation. Psychol Rev, 121(2), 225–247. doi: 10.1037/a0035942 [DOI] [PMC free article] [PubMed] [Google Scholar]
- Ramsay DS, Woods SC, & Kaiyala KJ (2014a). Drug-induced regulatory overcompensation has motivational consequences: Implications for homeostatic and allostatic models of drug addiction. Temperature (Austin), 1(3), 248–256. doi: 10.4161/23328940.2014.944802 [DOI] [PMC free article] [PubMed] [Google Scholar]
- Ramsay DS, Woods SC, & Kaiyala KJ (2014b). Repeated nitrous oxide exposure in rats causes a thermoregulatory sign-reversal with concurrent activation of opposing thermoregulatory effectors. Temperature (Austin), 1(3), 257–267. doi: 10.4161/23328940.2014.944809 [DOI] [PMC free article] [PubMed] [Google Scholar]
- Rosner BR (2000). Fundamentals of biostatistics (5th edition). Pacific Grove, CA: Brooks-Cole. [Google Scholar]
- Schmidt-Nielsen Knut. (1997). Animal physiology : adaptation and environment (5th ed.). Cambridge England; New York, NY, USA: Cambridge University Press. [Google Scholar]
- Schuckit MA (1980). Self-rating of alcohol intoxication by young men with and without family histories of alcoholism. J Stud Alcohol, 41(3), 242–249. [DOI] [PubMed] [Google Scholar]
- Schuckit MA (1994). Low level of response to alcohol as a predictor of future alcoholism. Am J Psychiatry, 151(2), 184–189. [DOI] [PubMed] [Google Scholar]
- Schuckit MA (1998). Biological, psychological and environmental predictors of the alcoholism risk: a longitudinal study. J Stud Alcohol, 59(5), 485–494. [DOI] [PubMed] [Google Scholar]
- Schuckit MA (2009). An overview of genetic influences in alcoholism. J Subst Abuse Treat, 36(1), S5–14. [PubMed] [Google Scholar]
- Schuckit MA (2011). Comment on the paper by Quinn and Fromme entitled subjective response to alcohol challenge: a quantitative review. Alcohol Clin Exp Res, 35(10), 1723–1725. doi: 10.1111/j.1530-0277.2011.01561.x [DOI] [PubMed] [Google Scholar]
- Schuckit MA, & Smith TL (1996). An 8-year follow-up of 450 sons of alcoholic and control subjects. Arch Gen Psychiatry, 53(3), 202–210. [DOI] [PubMed] [Google Scholar]
- Trudell JR (1985). Metabolism of nitrous oxide In Eger II EI, ed. Nitrous oxide / N2O. New York: Elsevier Science Publishing Company, Inc; 1985; p. 203–210. [Google Scholar]
- Wu J, Bostrom P, Sparks LM, Ye L, Choi JH, Giang AH, … Spiegelman BM (2012). Beige adipocytes are a distinct type of thermogenic fat cell in mouse and human. Cell, 150(2), 366–376. doi: 10.1016/j.cell.2012.05.016 [DOI] [PMC free article] [PubMed] [Google Scholar]
- Yang X, & Ruan HB (2015). Neuronal Control of Adaptive Thermogenesis. Front Endocrinol (Lausanne), 6, 149. doi: 10.3389/fendo.2015.00149 [DOI] [PMC free article] [PubMed] [Google Scholar]