

Summary
The pandemic of 2019 novel coronavirus (SARS‐CoV‐2019), reminiscent of the 2002‐SARS‐CoV outbreak, has completely isolated countries, disrupted health systems and partially paralyzed international trade and travel. In order to be better equipped to anticipate transmission of this virus to new regions, it is imperative to track the progress of the virus over time. This review analyses information on progression of the pandemic in the past 3 months and systematically discusses the characteristics of SARS‐CoV‐2019 virus including its epidemiologic, pathophysiologic, and clinical manifestations. Furthermore, the review also encompasses some recently proposed conceptual models that estimate the spread of this disease based on the basic reproductive number for better prevention and control procedures. Finally, we shed light on how the virus has endangered the global economy, impacting it both from the supply and demand side.
Keywords: ACE‐2, COVID‐19, pandemic, SARS‐CoV, mathematical modeling
List of Abbreviations
- ACE2
Angiotensin Converting Enzyme II
- ARDS
Acute Respiratory Distress Syndrome
- COVID‐19
Coronavirus Disease 2019
- ODE
Ordinary Differential Equation
- PCR
Polymerase Chain Reaction
- SEIR
Susceptible‐Exposed‐Infectious‐Recovered
- SARS‐CoV‐2019
2019 Novel Coronavirus
- TEN
Toxic Epidermal Necrolysis
- TMSP
Transmembrane Serine Protease
1. INTRODUCTION
The initial outbreak of the novel coronavirus in December 2019 was centered in Wuhan, Hubei Province of the People's Republic of China.1, 2, 3, 4, 5 It was initially named as 2019 novel coronavirus, soon after the International Committee of Taxonomy of Viruses (ICTV) named the virus as SARS‐CoV‐2, 1 because of the previously identified variant‐ s evere a cute r espiratory s yndrome c oronavirus (SARS‐CoV). The clinical illness it causes is termed as coronavirus disease 2019 (COVID‐19). 2 While several other human coronaviruses such as HCoV‐NL63, HCoV‐229E, HCoV‐OC43, and HCoV‐HKU1 cause mild respiratory disease, others like the zoonotic Middle East respiratory syndrome coronavirus (MERS‐CoV) and SARS‐CoV tend to have a higher fatality rate 6 (summarized in Table 1).
TABLE 1.
Major respiratory outbreaks in last century
| Outbreak | Most affected age groups | Area of emergence | Deaths | Fatality rate | Year |
|---|---|---|---|---|---|
| Spanish flu | Young adults, elderly and young children | Unclear | 20‐50 million | >2% | 1918‐1919 |
| Asian flu | Children | Southern China | 1‐4 million | 0.1%‐0.2% | 1957‐1958 |
| Hongkong flu | All age groups | Southern China | 1‐4 million | 0.1%‐0.2% | 1968‐1969 |
| Serious acute respiratory syndrome (SARS) | Middle‐aged adults (45‐65) | China | 774 | <10% | 2002‐2003 |
| Swine flu | Children, young adults and pregnant women | Mexico | 18 000 | <0.025% | 2009‐2010 |
| Middle east respiratory syndrome (MERS) | Elderly (60+) | Middle East | 861 | >30% | 2012 |
| COVID‐19 | All age groups | China | 36 000 and continuing | >2% | 2019‐2020 |
SARS‐CoV‐2019 has rapidly transmitted from Wuhan to other parts of the world, resulting in more than 80 000 cases in mainland China, above 140 000 cases in US, and over 100 000 in Italy. The total global number of COVID‐19 cases has surpassed 700 000, infecting at least 203 countries as on 31st March 2020, with number of infected people still growing significantly. 7 High diffusion and global positive cases became important to both the medical and public sector, as well as the general population. This led the WHO Emergency Committee to declare a global emergency on January 30, 2020. 7 Very recently, inertia in combating viral spread helped increase the number of cases outside China to about 13‐fold in 2 weeks. This lead the WHO chief Dr Tedros Adhanom Ghebreyesus to declare the novel coronavirus outbreak as a pandemic—“worldwide spread of a new disease” on March 11, 2020 7 (Figure 1). The last time the WHO declared a pandemic was during the H1N1 outbreak in 2009, which infected nearly a quarter of the world's population. 8 SARS (affecting people in 26 countries) and MERS were not considered pandemics.
FIGURE 1.

A timeline of COVID‐19
2. BIOLOGY OF SARS‐COV‐2
2.1. Morphology and classification
Coronaviruses (Latin: corona = crown) are positive sense single‐stranded, segmented, enveloped large RNA viruses that infect a wide range of animals, including humans. Morphologically spherical virions, they bear a core shell with surface projections that make them resemble a crown. They were first described by Tyrell and Bynoe in 1966, from patients with the common cold. 9 Four subfamilies of coronaviruses have so far been discovered;
Alpha: Originate from mammals, particularly bats, cause asymptomatic or mildly symptomatic infections
Beta: Originate from mammals, particularly bats, can cause severe disease and fatalities. SARS‐CoV‐2 belongs to the beta‐coronaviruses and is closely related to the SARS‐CoV virus.10, 11 SARS‐CoV‐2 is 96% identical to a bat coronavirus at the whole‐genome level. 11
Gamma and delta: Originate from pigs and birds
The genome size of coronaviruses varies between 26 and 32 kb with four major structural genes encoding the membrane glycoprotein (M), spike protein (S), nucleocapsid protein (N), and a small membrane protein (SM) (Figure 2). An additional membrane glycoprotein (HE) occurs in the HCoV‐OC43 and HKU1 beta‐coronaviruses. 12
FIGURE 2.

Genome organization and life‐cycle of SARS‐nCoV‐2
SARS‐CoV‐2019 has succeeded in transferring from bats to humans, presumably in the seafood market in Wuhan, China. However, potential intermediate hosts remain to be identified and the precise route of transmission urgently needs to be clarified. Because of the novelty of this virus, experts' understanding of exactly how it spreads is restricted.
2.2. Mechanism of action
Research suggests that the cellular receptor for SARS‐CoV‐2 is angiotensin‐converting enzyme 2 (ACE2), 13 expressed normally on type I and II alveolar epithelial cells of human lung and intestinal epithelia. 14 Eighty‐three percent of Type II alveolar epithelial cells express ACE2 receptor. The binding of SARS‐CoV‐2019 to ACE2 results in an augmented expression of ACE2, which can result in alveolar cell damage. This in turn triggers a cascade of systemic reactions. It has also been suggested that the receptor‐binding ability of SARS‐CoV‐2 is 10‐20 times stronger than that of SARS‐CoV. 15 Moreover, the virulence and transmission of SARS‐CoV‐2019 may shift over time. Very recent study, however, suggests that SARS‐CoV‐2 has evolved in two different types designated as L (aggressive and more prevalent) and S (evolutionarily older and less aggressive), explaining the higher mortality of initial reports from Wuhan compared to series of recent cases.16, 17
2.3. Pathophysiology
The primary pathology of COVID‐19 is ARDS (Acute Respiratory Distress Syndrome), characterized by diffuse damage of alveolar cells and hyaline membranes. Direct invasion of the virus causes cytopathogenic changes in pneumocytes instead of a purely hyperinflammatory injury. 18 Recent studies suggest that patients with severe conditions respond to COVID‐19 with an exuberant “cytokine release storm” (that shows characteristics of hemophagocytic lymphohistiocytosis or bacterial sepsis). The condition may show clinical markers of enhanced levels of ferritin and C‐reactive protein that may correspond with disease mortality and severity. 19
2.4. Stages of illness
The patients may move through different stages of illness:
Replicative stage ‐ The virus may take several days to replicate. Initially, it evokes the first line of defence, that is, innate immune response, but this fails to contain the virus resulting in fairly mild symptoms due to direct viral cytopathic effect.
-
Adaptive immunity stage ‐ The innate immune response is eventually followed by the adaptive immune response which tends to decrease the titer of the virus. Meanwhile, the inflammatory cytokines show augmented levels culminating in tissue damage and consequent clinical deterioration.
This explains the sudden deterioration of the patients after being relatively fine for several days. 20
Potentially clinical inferences can be drawn:
Preliminary clinical symptoms are not essentially prognostic of future outcome.
Antiviral therapies need to be given during the replicative stage to work optimally.
It is desirable to deploy any immunosuppressive therapies in the adaptive immune stage to blunt the immunopathologic response.
2.5. Signs and symptoms
The initial clinical sign of the COVID‐19 that allowed its case detection was pneumonia. While some reports suggest gastrointestinal symptoms associated with this disease, others describe asymptomatic infections, particularly among young children. 21 SARS‐CoV‐2019 may cause lower respiratory symptoms, upper respiratory symptoms, constitutional symptoms, and, less commonly, gastrointestinal symptoms. Most patients show lower respiratory symptoms and constitutional symptoms (eg, cough and fever).
The incidence of fever is variable among studies (ranging from 43% to 98%). This may relate to different strains of virus or different levels of disease severity between several cohorts. Regardless of the frequency, absence of fever in a patient does not exclude COVID‐19.
Mild thrombocytopenia is very common (but only rarely do platelet counts decline below 100).
Lower platelet count is a marker of poor prognosis. 19
Also, up to 10% of patients can initially show gastrointestinal symptoms (eg, nausea and diarrhea), followed by dyspnea. 24
Some patients, especially the elderly, may have “silent hypoxemia” and respiratory failure without dyspnea. 25
Approximately, 2% of patients may develop pharyngitis or tonsil enlargement. 22
3. TRANSMISSION AND MANAGEMENT
3.1. Large droplet transmission
Typical of respiratory viruses like influenza virus, SARS‐CoV‐2019 can spread through large droplets (with a transmission risk restricted to ~6 ft from the patient). 26 The droplet containing viral particles (saliva or mucous droplets) can be ejected during coughing, sneezing, laughing, singing, breathing, and talking. If these droplets do not encounter anything along the way, they typically land on the ground or the floor. This transmission via large droplet can be reduced by using a normal surgical‐style mask.
3.2. Airborne transmission
It is not yet clear whether SARS‐CoV‐2019 can spread through an airborne route. This would necessitate the use of N95 masks rather than standard surgical masks. However, the possibility of aerosol transmission is enhanced by a very recent study that established the capacity of the virus to remain in aerosols for hours. 27 Nevertheless, The World Health Organization and Canadian guidelines have recommended the use of only droplet precautions for routine care of COVID‐19 patients. However, both of these guidelines endorse airborne protections for aerosol‐generating procedures (eg, noninvasive ventilation, bag‐mask ventilation, intubation, CPR prior to intubation, extubation, high‐flow nasal cannula, tracheostomy, and bronchoscopy). On the other hand, The United States CDC first recommended the use of airborne precautions for managing COVID‐19 patients but recently stated that the use of surgical masks can be acceptable when N95 masks are no longer available.
3.3. Contact transmission
This mode of transmission is usually overlooked, but it is very important. It works in four chains of reactions:
Infected person coughs or sneezes and emits large virus‐loaded droplets. The droplets settle on surfaces of formites (inanimate objects) to create a thin film of the virus.
Depending upon the type of the surface, the virus resides on fomites in the environment for hours or days. 27
The virus gets transferred from the contaminated surface to the hands of the person who touches the surface subsequently.
From their hands, the virus comes in contact with a mucous membrane (mouth, nose, or eyes) and subsequently transmits the infection.
This contact transmission can be blocked/disrupted in the following ways:
Hand hygiene: Washing hands with sanitizers containing a high concentration of ethanol can inactivate the virus. 28
Consistent cleaning of environmental surfaces (eg, using 0.5% sodium hypochlorite solutions or 70% ethanol). 28
Avoidance of touching the face: This would avoid contact with mucous membranes.
3.4. Maternal–fetal transmission
There are currently no reports of intrauterine maternal–fetal transmission, but neonatal transmission can occur. 29
4. DRUGS TO TREAT COVID‐19
Research thus far has revealed more than 30 agents including natural products, western medicines, and traditional Chinese medicines with potential efficacy against COVID‐19. Some promising results have been achieved which are summarized below and listed in Table 2, but formal randomized clinical trials will be required to prove efficacy and safety.
TABLE 2.
Major drugs in clinical development for treatment of COVID‐19
| Drug | Mechanism | Dosage and mode of administration | Side effects | Clinical trial |
|---|---|---|---|---|
|
Lopinavir/ritonavir
|
Protease inhibitors, that work together to block the viral replication | 400 mg/100 mg, 2 times/d (Oral) |
|
11 trials (for instance NCT04307693, 3/13/20) |
|
Remdesivir
|
Gets incorporated into viral RNA leading to RNA termination trouble and inhibition of viral replication. | 200 mg once for first day, followed by 100 mg/d (Intravenous) |
|
6 trials (eg, NCT04292899, 3/19/20) |
|
Favipiravir
|
RNA polymerase inhibitor | 1600 mg twice for 1 day followed by 600 mg 2 times/d (Oral) |
|
Atleast three trials (eg, NCT04303299 3/12/2020) |
|
Chloroquine
|
Interferes with the cellular receptor ACE2 and also impairs the acidification of endosomes, thereby impeding the virus trafficking inside the cells |
500 mg (300 mg for chloroquine) for 2 times/d (Oral) |
|
At least ten trials (eg, NCT04303507, 3/11/20; NCT04261517, 2/14/20) |
|
Ribavirin
|
Nucleoside analog of ribofuranose that inhibits viral RNA synthesis | 500 mg for 2‐3 times/d in combination with lopinavir/ritonavir or IFN‐α (Intravenous) |
|
At least 5 trials (NCT04254874, 2/5/20; ChiCTR2000029308, 1/23/20) |
|
Oseltamavir
|
Neuraminidase inhibitor | 12.5 mL of oral suspension or 75 mg capsule 2 times/d (Oral) |
|
One trial (NCT04261270, 2/7/20) |
|
Arbidol
|
Blocks viral fusion | 200 mg for 3 times/d (Oral) |
|
Two trials (NCT04260594,2/7/20; NCT04286503, 2/27/20) |


4.1. Lopinavir/ritonavir
Lopinavir and ritonavir are protease inhibitors that work in conjunction to block viral replication. Ritonavir, being a CYP3A inhibitor, reduces the metabolism of lopinavir, thus boosting its levels. A 4 ug/mL concentration of lopinavir was required for in vitro antiviral activity against SARS while 1ug/mg of lopinavir was enough when used in combination with ribavirin. 30 Both protease inhibitors appear to function synergistically with ribavirin. Combination of all three drugs has been used previously on SARS and MERS. 30 Recently, the combination of lopinavir/ritonavir has not proven impressive, suggesting that a cocktail of ribavirin/lopinavir/ritonavir might be required for efficacy. 20 Nevertheless, lopinavir/ritonavir is advantageous over ribavirin because of its wide availability and an established toxicity profile.
4.2. Remdesivir
Originally developed for Ebola, this drug was the most obvious fit for SARS‐CoV‐2019 as it has already been tried out for ssRNA viruses like SARS and MERS. 31 Remdesivir is a prodrug whose phosphoramide is cleaved off to leave the active compound GS‐44‐1524 with a 5′ OH. The active compound is processed by the RNA polymerase and gets incorporated into viral RNA. This leads to RNA termination and inhibition of viral replication. Five clinical trials of this drug are underway including two open‐label trials sponsored by Gilead, two phase‐III trials at China‐Japan Friendship Hospital in Hubei, and one adaptive‐design Phase II trial by NIH in Nebraska. Unfortunately, Remdesivir is commercially unavailable. Remdesivir has been used for one of the earliest patients of COVID‐19 in the United States on the basis of “compassionate use”.32, 33
4.3. Favipiravir
An RNA polymerase inhibitor, Favipiravir, from Toyama Chemical of Japan, is in a trial for experimental treatment of COVID‐19 in China. Unfortunately, it is ineffective in in vitro tests. However, the human trials are still underway and have shown good clinical efficacy. The preliminary results from a study of 80 patients have shown that favipiravir had more effective antiviral action compared to lopinavir/ritonavir. 34
4.4. Oseltamivir
Oseltamivir, a neuraminidase inhibitor, has previously been ineffective against SARS; however, it works well for patients with influenza pneumonia. It is presently used as a component of several drug cocktail trials as patients with viral pneumonia suffer more likely from influenza than from COVID‐19. 35
4.5. Arbidol
A recent study reported that arbidol can efficiently inhibit SARS‐CoV‐2 infection in vitro at a concentration of 10 to 30 μM.34, 36
4.6. Chloroquine
Chloroquine, generally used for amebiasis and malaria, is currently being considered for treating COVID‐19 in view of its ability to interfere with the cellular receptor ACE2. It also impairs the acidification of endosomes, thereby impeding virus trafficking inside cells. Although chloroquine has been unsuccessful in treatment of SARS‐infected mice, 37 recent reports from in vitro data show that chloroquine inhibits SARS‐CoV‐2 at a 50% inhibitory concentration of 1 uM. This suggests the possibility of achieving therapeutic levels in humans. 38 It is worth mentioning that for SARS, the 50% inhibitory concentration of chloroquine is near to 9 uM, 39 implying chloroquine is more potent against SARS‐CoV‐2 than SARS. Studies of chloroquine and hydroxychloroquine are underway.40, 41, 42, 43 At the same time, it is important to establish its dosage as it has a number of liabilities, including sudden effects on blood glucose, seizures, retinopathy, and hearing damage.
4.7. Other potential drugs
Several other potential drugs include BCR‐ABL kinase inhibitor imatinib and Type‐II transmembrane serine protease (TMSPSS2) inhibitors. 44 Imatinib inhibits the fusion of virions with the endosomal membrane and as such possesses anti‐coronavirus activity. 45 A drug screening research team led by The Shanghai Tech University and Shanghai Institute of Materia Medica recently reported 30 agents with potential antiviral activity against SARS‐CoV‐2. 46 These agents include remdesivir, saquinavir, indinavir, ritonavir, lopinavir, darunavir, fosamprenavir, carfilzomib, presatovir, atazanavir, enzaplatovir, tipranavir, maribavir, abacavir, bortezomib, raltegravir, elvitegravir, deoxyrhapontin, montelukast, polydatin, disulfiram, chalcone, ebselen, tideglusib, carmofur, PX12, shikonin, TDZD‐8, cinanserin, and cyclosporin A. Also, some Chinese herbal medicines such as Radix Sophorae Tonkinensis and Rhizoma Polygoni Cuspidati were found to possess activity against SARS‐CoV‐2. 46
5. TESTS FOR DETECTION OF SARS‐COV‐2
5.1. Real‐time reverse transcription PCR
Specimens include nasopharyngeal swab, tracheal aspirate (if patient is intubated), broncho‐alveolar lavage, or induced sputum. The SARS‐CoV‐2 RT‐PCR test is a real‐time reverse transcription polymerase chain reaction (rRT ‐PCR) test in which the RNA isolated from the specimen is reverse transcribed into cDNA and then subsequently amplified. It utilises one primer and probe set to detect human RNase P (RP) as a control and three primer and probe sets to detect three regions in the SARS‐CoV‐2 nucleocapsid (N) gene in a clinical sample. 47 The interpretation of the results is given in Table 3.
TABLE 3.
COVID‐19 RT‐PCR test results interpretation
| SARS‐CoV‐2 N1 | SARS‐CoV‐2 N2 | SARS‐CoV‐2 N3 | RNase P | Result interpretation | Report |
|---|---|---|---|---|---|
| + | + | + | +/− | SARS‐CoV‐2 detected | Positive |
| + | + | +/− | +/− | SARS‐CoV‐2 detected | Positive |
| + | − | +/− | +/− | SARS‐CoV‐2 detected | Positive |
| − | + | +/− | +/− | SARS‐CoV‐2 detected | Positive |
| − | − | + | +/− | Sample is again repeated. If the result remains the same, additional confirmatory testing is conducted | Presumptive positive |
| − | − | − | + | SARS‐CoV‐2 not detected | Negative |
| − | − | − | − | Sample is again repeated. If a second failure occurs, another sample is taken. | Invalid |
5.2. Antigen detection test
The presence of SARS‐CoV‐2 viral proteins (antigens) in a sample from the respiratory tract of a person can also be detected within 30 minutes by rapid antigen detection test. If the sample contains a sufficient concentration (actively replicating titre) of viral proteins (target antigens), it will produce a visually detectable signal by binding to the specific antibodies immobilized on a paper strip. However, the sensitivity of the test varies between 34% and 80%, as it depends on the concentration of virus in the specimen, the time from onset of illness, and the quality of the specimen. 48 Also, there are high chances of false‐positive results that are the reason WHO does not currently recommend its use for patient care. 49
5.3. Host antibody detection
Another test marketed for the detection of SARS‐CoV‐2 relies on the presence of antibodies in the plasma of a person infected with SARS‐CoV‐2.50, 51, 52, 53 However, the detection is possible only in the recovery phase when the patient will start developing antibody response. Till then, the opportunities of disruption of disease transmission and clinical interventions might have already passed. Also, it suffers from drawbacks of cross reactivity with other pathogens and provides false‐positive results. Till date, there is no evidence of prediction of patient's immunity for reinfection by antibody detection. WHO also does not recommend this diagnostic test for patient care. 49
6. META‐ANALYSIS AND COMPUTATIONAL MODELLING OF COVID‐19
For the purpose of characterization of the epidemic of COVID‐19, various mathematical models have been released that include the Returning Traveller Study (RTS) and the Bats‐Hosts‐Reservoir‐People (BHRP) transmission network model.54, 55 Among them, the deterministic “Susceptible‐Exposed‐Infectious‐Recovered” (SEIR) compartmental model, that predicts the properties of COVID‐19 spread, is the most important and is being used by many researchers. It is based on the epidemiological status of the individuals, clinical progression of the disease, and the intervention measures such as isolation, quarantine, and treatment. The SEIR model, as depicted in Figure 3, stratifies the populations as susceptible ( S ), quarantined susceptible ( S q ), exposed ( E ), infectious and symptomatic ( I ), infectious but not yet symptomatic (pre‐symptomatic) ( A ), hospitalized ( H ), recovered ( R ), and death ( D ) compartments.
FIGURE 3.

A conceptual SEIR model for COVID‐19
Considering P as the total population, it is assumed that the susceptible population ( S ) is stably decreasing at a protection rate (α) and moving to compartment (S q ) that represents the quarantined individuals. Those who are not quarantined and come in contact with infected persons belong to the compartment exposed ( E ) depending upon the transmission rate ( β ). An exposed individual, if protected from being infected (eg, by using protection of face mask or hand sanitizers) will move back to the susceptible ( S ) compartment at the safety rate ( μ ). The exposed individuals can get infected and move either to infectious and symptomatic ( I ) or infectious but not yet symptomatic/presymptomatic to ( A ) compartment depending upon the average latent time () and (), respectively. The infected individuals can be detected and then hospitalized at a rate δ. From compartment ( H ), the patients can also move to the compartment recovery ( R ) at cure rate Λ(t) or die at mortality rate κ 1(t). However, the recovered persons are added back to the susceptible compartment ( S ) at a rate θ . It is important to mention that a percentage of people, though less, die in presymptomatic phase before being hospitalized. They also add to the death compartment at rate κ 2(t).
The SEIR model described above can be modeled by a set of ordinary differential equations (ODEs) given as follows:
| (1) |
It follows that
| (2) |
These nonlinear coupled ODEs can be solved using an explicit/implicit time stepping integrating scheme like the regular fourth‐order Runge‐Kutta scheme. 56
6.1. Basic Reproductive number of COVID‐19
In the past 3 months, various mathematical models have estimated the basic reproductive number ( R 0 ) which describes the expected number of cases directly infected by a single case assuming that all the individuals in the population are susceptible to the infection. R 0 is affected by factors like behavior of the infected population and environmental conditions. R 0 > 1 marks the start of the spread of the infection, R 0 < 1 signifies the decline in the number of cases, and R 0 = 1 indicates that the disease is endemic. The key insights/highlights of these models are summarized as follows:
1. Shi Zhao, et al 57
The authors in this study have advocated that the initial growth phase of COVID‐19 follows an exponential growth pattern in China.
The authors have used a maximum likelihood estimation to determine the number of unreported cases.
The basic reproduction number ( R 0 ) has been estimated to be 2.56 (95% CI, 2.49‐2.63) as: where, γ is the intrinsic growth rate and M( ) is the moment generating function of the generation time distribution.
2. Biao Tang et al 58
The study included collecting data for the cumulative diagnosis, quarantine, and released cases of mainland China.
A deterministic SEIR model of the form in Equation (1) has been parametrized to estimate the basis reproduction number using likelihood‐based and model‐based approaches.
An adaptive Metropolis‐Hastings (M‐H) algorithm was used to carry the Markov Chain Monte Carlo (MCMC) method to fit the model.
The result showed the estimated mean control reproduction to be 6.47 (95% CI, 5.71‐7.23), as compared to the SARS epidemics ( R o = 4.91) in Beijing, China, in 2003 and ( R o = 3.5‐6.7) in Jeddah, Kingdom of Saudi Arabia, in 2014.
Later an updated estimation risk has been shown 59 that included calculating the time‐dependent contact and diagnosis rates.
3. Ying Liu, et al 60
The study provided an estimate of the average R o for COVID‐19 from a period of January 1, 2020 to February 7, 2020.
The authors have argued that the estimation of R o mainly depends on the estimation technique involved and the modeling assumptions used.
Both deterministic and stochastic models were included in the study.
The study showed an average base reproduction number (R o) to be equal to 3.28 with a median of 2.79.
4. Liangrong Peng, et al 61
The study proposed a general SEIR model and estimated some key epidemic parameters such as latent time, cure rate, mortality rate, average contacts, severe condition rate, based on public data from Jan 20th to Feb 9th for Mainland, Hubei, Wuhan, Beijing, and Shanghai.
The study included some predictions from the proposed model about the outbreak scenario in these provinces which are quite in agreement with the present situation.
5. Sheng Zhang, et al 62
This study concerned the impact of COVID‐19 on the Diamond Princess cruise ship.
The study showed that the maximum‐likelihood (ML) value of basic reproductive number ( R 0 ) was 2.28 at an early stage on the ship for the COVID‐19 outbreak.
It was shown that if ( R 0 ) value was reduced by 25% and 50%, the estimated total number of cumulative cases would be reduced from 1514 (1384‐1656) to 1081 (981‐1177) and 758 (697‐817) as of February 26, 2020, respectively.
6. Tian‐Mu Chen, et al 63
In this research, a Bats‐Hosts‐Reservoir‐People (BHRP) transmission network model for simulating transmission from bats to humans and a Reservoir‐People (RP) transmission network model was developed.
Berkeley Madonna 8.3.18 was employed for curve fitting.
The value of ( R 0 ) was estimated using the next‐generation matrix approach which came out to be 2.30 for reservoir to person and 3.58 for person to person.
7. Jomar F. Rabajante, et al 64
A detailed review about an early model‐based estimation strategy of COVID‐19 is presented in this study along with some useful insights from these models.
Also, a Susceptible‐Exposed‐Infected (SEI) model framework was presented, and auxiliary strategies were described to prevent the COVID‐19 outbreak. The study showed that exposure time plays a significant role in spreading the disease.
8. Tao Zhou, et al 65
This study showed an R 0 value equal to 2.8 ~ 3.3 using real‐time reports of infected cases of COVID‐19 upto January 26, 2020.
The study used an SEIR model for parameter estimation.
9. Qianying Lin, et al 66
The authors in this study proposed a SEIR compartmental model to account for individual behavioral reaction (represented by α ) and the governmental action (represented by κ ) (eg, hospitalization, quarantine holiday extension, and travel restriction) in Wuhan, China. The estimates of these two key components were taken from the 1918 influenza pandemic that emerged in London, United Kingdom.
The study involved simulating three different cases: i) a naive scenario (no individual reaction or governmental action) ii) with only individual reaction, and iii) with both individual reaction and governmental actions. The simulation results showed that the daily new infections fell dramatically as the governmental actions and individual reactions were increased. Furthermore, it has been specifically shown that for α = 0.9 and κ > 110, the simulated data largely match the observed data. This model accurately fits the officially reported data from Wuhan, China, and can be used as starting point to carry forward numerical simulations of the disease spread to other countries.
10. Cleo Anastassopoulou, et al 67
An epidemiological data of Hubei, China, was collected from January 11 to February 10, 2020.
The data were used for estimation of basic reproduction number using a Susceptible Infected Recovered Dead (SIRD) framework.
The estimated average value of R 0 was ~2.6 based on confirmed cases.
The plot for the estimated value of the (R 0) obtained by the above‐mentioned studies is shown in Figure 4. The plot shows a high reproductive number at the beginning of the outbreak in China with the maximum peak in mid‐January 2020. However, with passage of time, social distancing, self‐quarantine, health care measures, and governmental actions had a substantial effect in containing the outbreak which is evident from the estimates of the (R 0 ) in the months of February and March, 2020.
FIGURE 4.
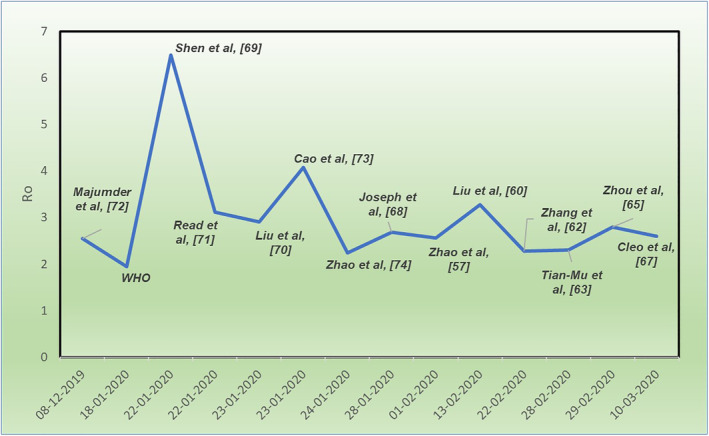
Timeline of R 0 for COVID‐19
It is pertinent to mention that the estimates of the basic reproductive number mentioned in the above studies can be poor due to insufficient data, and different estimation techniques can result in different forecasts. However, further collection of data with robust modeling can result in close estimates.
7. IMPACT OF COVID‐19 ON WORLD ECONOMY
Viral spread has borne out experts' downside fears, with consequences of possible containment measures, disrupted supply chains, and spill overs from the real economy to monetary markets. 75 Although the outbreak seems to have decelerated in China, COVID‐19 has gone global. Infections are escalating in Europe, United States, Iran, South Korea, and elsewhere, with authorities instigating increasingly restrictive actions to contain the virus. Europe and Japan are already in recession territory given their high reliance on trade and weak fourth quarter performance. The augmented uncertainty has resulted in volatility of the financial markets which is typically seen during a global financial crisis. While questions about governments' capacities to mount a coordinated and effective response linger, the UN's Trade and Development Agency, UNCTAD has envisaged COVID‐19 to probably cost a slowdown of $1 trillion to the global economy in 2020. 76 Bloomberg Economics has even warned that in a worst‐case pandemic scenario, the full‐year GDP growth might fall to zero. The extent of the damage, however, depends on the following factors:
Time taken to contain the virus
The steps taken by the authorities to contain it
Extent of economic support to be deployed by the government throughout the epidemic's immediate effect and aftermath
The COVID‐19 outbreak has caused both supply and demand shocks reverberating across the global economy. As per OECD, the countries that are deeply interconnected to China are the ones that will forecast the largest downward growth revisions particularly Japan, South Korea, and Australia. Large‐scale quarantines, social‐distancing measures, and travel restriction measures have driven a sharp fall in consumer and business spending creating a recession.
At the sectoral level, the hardest hit industries would be:
Travel and tourism‐related industries: As the authorities encourage “social distancing” and consumers stay indoors, the International Air Transport Association has envisaged that COVID‐19 possibly would cost global air carriers between $63 billion and $113 billion in 2020.
The international film market: This industry could lose over $5 billion in lower box office sales.
Hotel companies and restaurants: These have drastically plummeted in the past weeks, and entertainment titans like Disney expect a substantial blow to revenues.
Sporting events and other services.
Agriculture industry and other such industries that are less reliant on high social interaction are comparatively less vulnerable but still may face challenges as demand wavers.
Concluding remarks
This overview provides the basic, biomedical, and translational research communities some key insights on COVID‐19. We believe that the focus of future studies still lies in the progress of effective drugs in general and development of SARS‐CoV‐2 vaccines in particular. While uncertainty lingers, credible, coordinated, and coherent policy responses would deliver the best chance at limiting the fallout from this human tragedy. Time alone can tell how the virus is going to affect our lives, but future outbreaks of pathogens of zoonotic origin and viruses are likely to continue. As such, besides curbing this epidemic, efforts should be implemented to devise inclusive measures to avert future outbreaks of zoonotic origin. Though the virus has reshaped the geopolitical globalization, multilateralism and integration of countries are indispensable. Without a doubt, we must move toward policy making and greater coordination to combat the current health crisis.
CONFLICT OF INTEREST
The authors declare no conflicts of interest.
AUTHORS CONTRIBUTION
Danish Rafiq and Asiya Batool collected the data and wrote the manuscript, M. A. Bazaz analyzed the data and helped in critical analysis and proof reading of the manuscript.
ETHICAL APPROVAL
Not required.
ACKNOWLEDGEMENTS
Doctoral Fellowship in favor of D.R from Ministry of Human Resource Development (MHRD), India, and Post‐doctoral fellowship (DBT‐RA) in favor of A.B from Department of Biotechnology (DBT), Govt. of India is duly acknowledged.
Rafiq D, Batool A, Bazaz MA. Three months of COVID‐19: A systematic review and meta‐analysis. Rev Med Virol. 2020;30:e2113. 10.1002/rmv.2113
Funding information Department of Biotechnology, Ministry of Science and Technology; Ministry of Human Resource Development, India
REFERENCES
- 1. Gorbalenya AE, Baker SC, Baric RS, et al. Severe acute respiratory syndrome‐related coronavirus: the species and its viruses‐a statement of the coronavirus study group. bioRxiv. 2020. 10.1101/2020.02.07.937862. [DOI] [Google Scholar]
- 2. WHO . 2020. https://www.who.int/dg/speeches/detail/who-director-general-s-remarks-at-the-mediabriefing-on-2019-ncov-on-11-february-2020
- 3. Chan JF, Yuan S, Kok KH, et al. A familial cluster of pneumonia associated with the 2019 novel coronavirus indicating person‐to‐person transmission: a study of a family cluster. Lancet. 2020;395:514‐523. 10.1016/S0140-6736(20)30154-9. [DOI] [PMC free article] [PubMed] [Google Scholar]
- 4. Li Q, Guan X, Wu P, et al. Early transmission dynamics in Wuhan, China, of novel coronavirus‐infected pneumonia. N Engl J Med. 2020;382:1199‐1207. 10.1056/NEJMoa2001316. [DOI] [PMC free article] [PubMed] [Google Scholar]
- 5. Lai CC, Shih TP, Ko WC, Tang HJ, Hsueh PR. Severe acute respiratory syndrome coronavirus 2 (SARS‐CoV‐2) and corona virus disease‐2019 (COVID‐19): the epidemic and the challenges. Int J Antimicrob Agents. 2020;17:105924. [DOI] [PMC free article] [PubMed] [Google Scholar]
- 6. Chen Y, Liu Q, Guo D. Emerging coronaviruses: genome structure, replication, and pathogenesis. J Med Virol. 2020;92:418‐423. 10.1002/jmv.25681. [DOI] [PMC free article] [PubMed] [Google Scholar]
- 7. WHO 2020. https://www.who.int/emergencies/diseases/novel-coronavirus-2019
- 8. https://www.who.int/news-room/commentaries/detail/advice-on-the-use-of-point-of-care-immunodiagnostic-tests-for-covid-19
- 9. Tyrrell DA, Bynoe ML. Cultivation of viruses from a high proportion of patients with colds. Lancet. 1966;1:76‐77. [DOI] [PubMed] [Google Scholar]
- 10. GISAID . Global initiative on sharing all influenza data. Phylogeny of SARS‐Like Betacoronaviruses Including Novel Coronavirus (nCoV). https://nextstrain.org/groups/blab/sars-like-cov
- 11. Zhou P, Yang XL, Wang XG, et al. A pneumonia outbreak associated with a new coronavirus of probable bat origin. Nature. 2020;579:270‐273. 10.1038/s41586-020-2012-7. [DOI] [PMC free article] [PubMed] [Google Scholar]
- 12. PJM R. In: Siddell SG, ed. The Coronaviridae. Switzerland, AG: Springer Science & Business Media; 2013:115‐137 https://link.springer.com/content/pdf/10.1007%2F978-1-4899-1531-3. [Google Scholar]
- 13. Zhang H, Penninger JM, Li Y, Zhong N, Slutsky AS. Angiotensin‐converting enzyme 2 (ACE2) as a SARS‐CoV‐2 receptor: molecular mechanisms and potential therapeutic target. Intensive Care Med. 2020;3:1‐5. [DOI] [PMC free article] [PubMed] [Google Scholar]
- 14. Hamming I, Timens W, Bulthuis ML, Lely AT, Navis GJ, van Goor H. Tissue distribution of ACE2 protein, the functional receptor for SARS coronavirus. A first step in understanding SARS pathogenesis. J Pathol. 2004;203(2):631‐637. [DOI] [PMC free article] [PubMed] [Google Scholar]
- 15. Wrapp D, Wang N, Corbett KS, et al. Cryo‐EM structure of the 2019‐nCoV spike in the prefusion conformation. Science. 2020;367(6483):1260‐1263. [DOI] [PMC free article] [PubMed] [Google Scholar]
- 16. Tang X, Wu C, Li X, et al. On the origin and continuing evolution of SARS‐CoV‐2. Nat Sci Rev. 2020. 10.1093/nsr/nwaa036. [DOI] [PMC free article] [PubMed] [Google Scholar]
- 17. Xu XW, Wu XX, Jiang XG, et al. Clinical findings in a group of patients infected with the 2019 novel coronavirus (SARS‐Cov‐2) outside of Wuhan, China: retrospective case series. BMJ. 2020;19:368. [DOI] [PMC free article] [PubMed] [Google Scholar]
- 18. Xu Z, Shi L, Wang Y, et al. Pathological findings of COVID‐19 associated with acute respiratory distress syndrome. Lancet Respir Med. 2020;8:420‐422. 10.1016/S2213-2600(20)30076-X. [DOI] [PMC free article] [PubMed] [Google Scholar]
- 19. Ruan Q, Yang K, Wang W, Jiang L, Song J. Clinical predictors of mortality due to COVID‐19 based on an analysis of data of 150 patients from Wuhan, China. Intensive Care Med. 2020;3:1‐3. [DOI] [PMC free article] [PubMed] [Google Scholar]
- 20. Young BE, Ong SW, Kalimuddin S, et al. Epidemiologic features and clinical course of patients infected with SARS‐CoV‐2 in Singapore. JAMA. 2020;3. [DOI] [PMC free article] [PubMed] [Google Scholar]
- 21. Chan JF, Yuan S, Kok KH, et al. A familial cluster of pneumonia associated with the 2019 novel coronavirus indicating person‐to‐person transmission: a study of a family cluster. Lancet. 2020;S0140‐6736(20):30154‐30159. [DOI] [PMC free article] [PubMed] [Google Scholar]
- 22. Guan WJ, Ni ZY, Hu Y, et al. Clinical characteristics of coronavirus disease 2019 in China. N Engl J Med. 2020;382:1708‐1720. 10.1056/NEJMoa2002032. [DOI] [PMC free article] [PubMed] [Google Scholar]
- 23. Yang X, Yu Y, Xu J, et al. Clinical course and outcomes of critically ill patients with SARS‐CoV‐2 pneumonia in Wuhan, China: a single‐centered, retrospective, observational study. Lancet Respir Med. 2020;2600(20):30075‐30079. 10.1016/S2213-2600(20)30079-5. [DOI] [PMC free article] [PubMed] [Google Scholar]
- 24. Wang D, Hu B, Hu C, et al. Clinical Characteristics of 138 Hospitalized Patients with 2019 Novel Coronavirus‐Infected Pneumonia in Wuhan, China. JAMA. 2020;323(11):1061‐1069. [DOI] [PMC free article] [PubMed] [Google Scholar]
- 25. Xie J, Tong Z, Guan X, Du B, Qiu H, Slutsky AS. Critical care crisis and some recommendations during the COVID‐19 epidemic in China. Intensive Care Med. 2020;2:1‐4. [DOI] [PMC free article] [PubMed] [Google Scholar]
- 26. Angel N. Desai, Payal Patel,Stopping the spread of COVID‐19. JAMA. 2020;323(15):1516‐1516. 10.1001/jama.2020.4269. [DOI] [PubMed] [Google Scholar]
- 27. van Doremalen N, Bushmaker T, Morris DH, et al. Aerosol and surface stability of SARS‐CoV‐2 as compared with SARS‐CoV‐1. N Engl J Med. 2020;382:1564‐1567. 10.1056/NEJMc2004973. [DOI] [PMC free article] [PubMed] [Google Scholar]
- 28. Kampf G. Efficacy of ethanol against viruses in hand disinfection. J Hosp Infect. 2018;98(4):331‐338. [DOI] [PMC free article] [PubMed] [Google Scholar]
- 29. Peyronnet V, Sibiude J, Deruelle P, et al. Infection with SARS‐CoV‐2 in pregnancy. Information and proposed care. CNGOF. Gynecol Obstet Ferti Senol. 2020;48(5):436‐443. 10.1016/j.gofs.2020.03.014. [DOI] [PMC free article] [PubMed] [Google Scholar]
- 30. Chu CM, Cheng VC, Hung IF, et al. Role of lopinavir/ritonavir in the treatment of SARS: initial virological and clinical findings. Thorax. 2004;59(3):252‐256. [DOI] [PMC free article] [PubMed] [Google Scholar]
- 31. Sheahan TP et al. Broad‐spectrum antiviral GS‐5734 inhibits both epidemic and zoonotic coronaviruses. Sci Transl Med. 2017;9396:eaal3653. 10.1126/scitranslmed.aal3653. [DOI] [PMC free article] [PubMed] [Google Scholar]
- 32. Grein Jonathan MD et al. Compassionate use of Remdesivir for patients with severe Covid‐19. N Engl J Med. 2020;10. [DOI] [PMC free article] [PubMed] [Google Scholar]
- 33. Sheahan TP, Sims AC, Leist SR, et al. Comparative therapeutic efficacy of remdesivir and combination lopinavir, ritonavir, and interferon beta against MERS‐CoV. Nat Commun. 2020;11(1):222 1–4. [DOI] [PMC free article] [PubMed] [Google Scholar]
- 34. Dong L, Hu S, Gao J. Discovering drugs to treat coronavirus disease 2019 (COVID‐19). Drug Discov Ther. 2020;14(1):58‐60. [DOI] [PubMed] [Google Scholar]
- 35. Adalja AA. Oseltamivir protective against influenza induced cardiac events. https://flutrackers.com/forum/forum/welcome-to-the-scientific-library/treatment-options/46760-oseltamivir-protective-against-influenza-induced-cardiac-events
- 36. Zhang J, Wang W, Peng B, et al. Potential of arbidol for post‐exposure prophylaxis of COVID‐19 transmission‐preliminary report of a retrospective case‐control study. chinaXiv:202002.00065v1 [DOI] [PMC free article] [PubMed]
- 37. Barnard DL, Day CW, Bailey K, et al. Evaluation of immunomodulators, interferons and known in vitro SARS‐coV inhibitors for inhibition of SARS‐coV replication in BALB/c mice. Antivir Chem Chemother. 2006;17(5):275‐284. [DOI] [PubMed] [Google Scholar]
- 38. Wang M, Cao R, Zhang L, et al. Remdesivir and chloroquine effectively inhibit the recently emerged novel coronavirus (2019‐nCoV) in vitro. Cell Res. 2020;30(3):269‐271. [DOI] [PMC free article] [PubMed] [Google Scholar]
- 39. Al‐Bari MA. Targeting endosomal acidification by chloroquine analogs as a promising strategy for the treatment of emerging viral diseases. Pharmacol Res Perspect. 2017;5(1). [DOI] [PMC free article] [PubMed] [Google Scholar]
- 40. Colson P, Rolain JM, Raoult D. Chloroquine for the 2019 novel coronavirus. Int J Antimicrob Agents. 2020;15:105923. [DOI] [PMC free article] [PubMed] [Google Scholar]
- 41. Colson P, Rolain JM, Lagier JC, Brouqui P, Raoult D. Chloroquine and hydroxychloroquine as available weapons to fight COVID‐19. Int J Antimicrob Agents. 2020;55(4):105932. [DOI] [PMC free article] [PubMed] [Google Scholar]
- 42. Gautret P, Lagier JC, Parola P, et al. Hydroxychloroquine and azithromycin as a treatment of COVID‐19: results of an open‐label non‐randomized clinical trial. Int J Antimicrob Agents. 2020;20:105949. [DOI] [PMC free article] [PubMed] [Google Scholar] [Retracted]
- 43. Sahraei Z, Shabani M, Shokouhi S, Saffaei A. Aminoquinolines Against Coronavirus Disease 2019 (COVID‐19): Chloroquine or Hydroxychloroquine. Int J Antimicrob Agents. 2020;16:105945. [DOI] [PMC free article] [PubMed] [Google Scholar]
- 44. Hoffmann M, Kleine‐Weber H, Krüger N, Müller M, Drosten C, Pöhlmann S. The novel coronavirus 2019 (2019‐nCoV) uses the SARS‐coronavirus receptor ACE2 and the cellular protease TMPRSS2 for entry into target cells. bioRxiv. 2020; 2020.2001.2031.929042. [Google Scholar]
- 45. Coleman CM, Sisk JM, Mingo RM, Nelson EA, White JM, Frieman MB. Abelson kinase inhibitors are potent inhibitors of severe acute respiratory syndrome coronavirus and Middle East respiratory syndrome coronavirus fusion. J Virol. 2016;90:8924‐8933. [DOI] [PMC free article] [PubMed] [Google Scholar]
- 46.Shanghai Institute of Materia Medica website, Chinese Academy of Sciences. A joint research team of the Shanghai Institute of Materia Medica and Shanghai Tech University discover a group of old and traditional Chinese medicines that may be efficacious in treating the novel form of pneumonia. http://www.simm.ac.cn/xwzx/kydt/202001/t20200125_5494417.html
- 47.Accelerated Emergency Use Authorization (Eua) Summary Covid‐19 Rt‐Pcr Test (Laboratory Corporation Of America). https://www.fda.gov/media
- 48. Bruning AHL, Leeflang MMG, Vos JMBW, et al. Rapid tests for influenza, respiratory syncytial virus, and other respiratory viruses: a systematic review and meta‐analysis. Clin Infect Dis. 2017;65(6):1026‐1032. [DOI] [PMC free article] [PubMed] [Google Scholar]
- 49. https://www.cidrap.umn.edu/news-perspective/2013/01/study-puts-global-2009-pandemic-h1n1-infection-rate-24
- 50. Liu Y, Liu Y, et al. Diagnostic indexes of a rapid IgG/IgM combined antibody test for SARS‐CoV‐2. Medxriv. 2020. 10.1101/2020.03.26.20044883. [DOI] [Google Scholar]
- 51. Zhang P, Gao Q, et al. Evaluation of recombinant nucleocapsid and spice protein serological diagnosis of novel coronavirus disease 2019 (COVID‐19). medxriv. 2020. 10.1101/2020.03.17.20036954v1. [DOI] [Google Scholar]
- 52. Pan Y, Li X, et al. Serological immunochromatographic approach in diagnosis with SARS‐CoV‐2 infected COVID‐19 patients. Medxriv. 2020. 10.1101/2020.03.13.20035428. [DOI] [PMC free article] [PubMed] [Google Scholar]
- 53. Li Z, Yi Y, Luo X, et al. Development and clinical application of a rapid IgM‐IgG combined antibody test for SARS‐CoV‐2 infection diagnosis. J Med Virol. 10.1002/jmv.25727. [DOI] [PMC free article] [PubMed] [Google Scholar]
- 54. Chen T, Rui J, Wang Q, Zhao Z, Cui J‐A, Yin L. A mathematical model for simulating the transmission of Wuhan novel coronavirus. bioRxiv. 2020;9(1):1‐8. [DOI] [PMC free article] [PubMed] [Google Scholar]
- 55. Imai, N. , Dorigatti, I. , Cori, A. , Donnelly, C. , Riley, S. , Ferguson, N.M. Report 2: estimating the potential Total number of novel coronavirus cases in Wuhan City, China https://www.preventionweb.net/news/view/70092
- 56. Dormand JR, Prince PJ. A family of embedded Runge‐Kutta formulae. J Comput Appl Math. 1980;6(1):19‐26. [Google Scholar]
- 57. Zhao, Musa , Lin, et al. Estimating the Unreported Number of Novel Coronavirus (2019‐nCoV) Cases in China in the First Half of January 2020: a data‐driven Modelling analysis of the early outbreak. J Clin Med. 2020;9(2):388. 10.3390/jcm9020388 [DOI] [PMC free article] [PubMed] [Google Scholar]
- 58. Tang B, Wang X, Li Q, et al. Estimation of the transmission risk of the 2019‐nCoV and its implication for public health interventions. J Clin Med. 2020;9(2):462. 10.3390/jcm9020462. [DOI] [PMC free article] [PubMed] [Google Scholar]
- 59. Tang B, Bragazzi NL, Li Q, Tang S, Xiao Y, Wu J. An updated estimation of the risk of transmission of the novel coronavirus (2019‐nCov). Infect Dis Model. 2020;5:248‐255. 10.1016/j.idm.2020.02.001. [DOI] [PMC free article] [PubMed] [Google Scholar]
- 60. Liu Y, Gayle AA, Wilder‐Smith A, Rocklöv J. The reproductive number of COVID‐19 is higher compared to SARS coronavirus. J Travel Med. 2020;27:1‐4. 10.1093/jtm/taaa021 Figure 1. [DOI] [PMC free article] [PubMed] [Google Scholar]
- 61. Peng, L. , Yang, W. , Zhang, D. , Zhuge, C. , & Hong, L. Epidemic analysis of COVID‐19 in China by dynamical modeling. pp. 1–18. http://arxiv.org/abs/2002.06563
- 62. Zhang S, Diao MY, Yu W, Pei L, Lin Z, Chen D. Estimation of the reproductive number of novel coronavirus (COVID‐19) and the probable outbreak size on the diamond princess cruise ship: a data‐driven analysis. Int J Infect Dis. 2020;93:201‐204. 10.1016/j.ijid.2020.02.033. [DOI] [PMC free article] [PubMed] [Google Scholar]
- 63. Chen TM, Rui J, Wang QP, Zhao ZY, Cui JA, Yin L. A mathematical model for simulating the phase‐based transmissibility of a novel coronavirus. Infect Dis Poverty. 2020;9(1):1‐8. 10.1186/s40249-020-00640-3. [DOI] [PMC free article] [PubMed] [Google Scholar]
- 64. Rabajante Jomar F.. Insights from early mathematical models of 2019‐nCoV acute respiratory disease (COVID‐19) dynamics, 2020. https://arxiv.org/abs/2002.05296
- 65. Zhou T, Liu Q, Yang Z, et al. Preliminary prediction of the basic reproduction number of the Wuhan novel coronavirus 2019‐nCoV. J Evid Based Med. 2020;13(1):3‐7. 10.1111/jebm.12376. [DOI] [PMC free article] [PubMed] [Google Scholar]
- 66. Lin Q, Zhao S, Gao D, et al. A conceptual model for the coronavirus disease 2019 (COVID‐19) outbreak in Wuhan, China with individual reaction and governmental action. Int J Infect Dis. 2020;93:211‐216. 10.1016/j.ijid.2020.02.058. [DOI] [PMC free article] [PubMed] [Google Scholar]
- 67. Anastassopoulou C, Russo L, Tsakris A, Siettos C. Data‐based analysis, Modelling and forecasting of the COVID‐19 outbreak. Plos‐One. 2020;15:e0230405. 10.1371/journal.pone.0230405. [DOI] [PMC free article] [PubMed] [Google Scholar]
- 68. Wu JT, Leung K, Leung GM. Nowcasting and forecasting the potential domestic and international spread of the 2019‐nCoV outbreak originating in Wuhan, China: a modelling study. Lancet. 2020;395:689‐697. [DOI] [PMC free article] [PubMed] [Google Scholar]
- 69. Shen M, Peng Z, Xiao Y, Zhang L. Modelling the epidemic trend of the 2019 novel coronavirus outbreak in China. bioRxiv. 2020. 10.1101/2020.01.23.916726. [DOI] [PMC free article] [PubMed] [Google Scholar]
- 70. Liu T, Hu J, Kang M, et al. Transmission dynamics of 2019 novel coronavirus (2019‐nCoV). bioRxiv. 2020. 10.1101/2020.01.25.919787. [DOI] [Google Scholar]
- 71. Read JM, Bridgen JRE, Cummings DAT, Ho A, Jewell CP. Novel coronavirus 2019‐nCoV: early estimation of epidemiological parameters and epidemic predictions. medRxiv. 2020. 10.1101/2020.01.23.20018549. [DOI] [PMC free article] [PubMed] [Google Scholar]
- 72. Majumder, M , Mandl, KD . (2020) Early transmissibility assessment of a novel coronavirus in Wuhan, China. https://papers.ssrn.com/abstract=3524675. Accessed from January 27, 2020.
- 73. Cao Z, Zhang Q, Lu X, et al. Estimating the effective reproduction number of the 2019‐nCoV in China. medRxiv. 2020. 10.1101/2020.01.27.20018952. [DOI] [Google Scholar]
- 74. Zhao S, Ran J, Musa SS, et al. Preliminary estimation of the basic reproduction number of novel coronavirus (2019‐nCoV) in China, from 2019 to 2020: a data driven analysis in the early phase of the outbreak. bioRxiv. 2020;92:214‐217. 10.1101/2020.01.23.916395. [DOI] [PMC free article] [PubMed] [Google Scholar]
- 75.COVID‐19: Implications for business https://www.mckinsey.com/business-functions/risk/our-insights/covid-19-implications-for-business
- 76. https://unctad.org/en/Pages/Home.aspx