Abstract
Discovery of drugs against newly emerged pathogenic agents like the SARS‐CoV‐2 coronavirus (CoV) must be based on previous research against related species. Scientists need to get acquainted with and develop a global oversight over so‐far tested molecules. Chemography (herein used Generative Topographic Mapping, in particular) places structures on a human‐readable 2D map (obtained by dimensionality reduction of the chemical space of molecular descriptors) and is thus well suited for such an audit. The goal is to map medicinal chemistry efforts so far targeted against CoVs. This includes comparing libraries tested against various virus species/genera, predicting their polypharmacological profiles and highlighting often encountered chemotypes. Maps are challenged to provide predictive activity landscapes against viral proteins. Definition of “anti‐CoV” map zones led to selection of therein residing 380 potential anti‐CoV agents, out of a vast pool of 800 M organic compounds.
Keywords: Antivirals, coronavirus, SARS, chemography, Generative Topographic Mapping, Structure-Activity Relationships
1. Introduction
Coronaviruses (CoVs; family Coronaviridae, order Nidovirales, realm Riboviria) are a family of enveloped RNA viruses known to be able to cause acute and persistent infections in mammals and birds. [1] Before recent outbreaks of severe acute respiratory syndrome (SARS) and Middle East respiratory syndrome (MERS), the infections caused by human CoVs (HCoV‐229E, HCoV‐OC43, HCoV‐NL63 and HCoV‐HKU1) had been considered as usually resulting in mild, self‐limiting upper respiratory tract infections, similar to the common cold. Ongoing pandemic of CoV disease (COVID‐19) caused by severe acute respiratory syndrome‐related coronavirus 2 (SARS‐CoV‐2; species Severe acute respiratory syndrome‐related coronavirus, subgenus Sarbecovirus, genus Betacoronavirus, subfamily Orthocoronavirinae), [2] commonly referred to as 2019‐nCoV, is posing a major public health challenge and has already caused significant damage to the world economy. There is no approved specific treatment for the infections caused by CoVs and the development of new anticoronaviral compounds is an urgent task.
The coronavirus genome (26–32 kb) is the largest among all RNA viruses.[ 1 , 3 ] It encodes 4 structural and 16 non‐structural proteins, many of which have already been exploited as the targets for anticoronaviral drug discovery. [4] Apart from viral proteins, numerous host‐cell factors required for virus replication cycle can also serve as the targets for the development of CoVs reproduction inhibitors. The data on anticoronaviral activity of compounds has been accumulated in large repositories of bioactivity data such as ChEMBL, [5] PubChem BioAssay, [6] etc. There are more than 3.7 thousand activity entries related to more than 2.1 thousand structures extracted from 143 literature sources in the current ChEMBL version 26.
Large efforts have been made recently in order to curate and analyze antiviral chemical space,[ 7 , 8 , 9 ] as well as to validate the applicability of machine learning methods for the discovery of new antiviral compounds. [10] The data on activity of closely related viruses were proven to be informative enough for the guided discovery of hit compounds against a particular virus. [7] For example, the data on activity against flaviviruses extracted from ViralChEMBL [8] projected onto Universal Maps (UMs) of chemical space built by generative topographic mapping (GTM) method were successfully used to discover new compounds with activity against tick‐borne encephalitis virus, although only few data points were available for this virus. [7]
Chemography [11] provides a computer‐generated, human‐readable framework (“map”) in which chemical compounds can be located – ideally, by positioning similar molecules close to each other. Molecules, typically represented by high‐dimensional descriptor vectors, are projected on such maps by means of some dimensionality reduction techniques. [12] Generative Topographic Mapping[ 13 , 14 ] appears to be a particularly multifaceted and flexible approach to chemography. As a probabilistic generalization of popular Kohonen maps, [15] it has the rather unique ability to be both a support for visualization and comparison of compound libraries and a support for quantitative predictive models (property landscapes). This non‐linear dimensionality reduction tool maps each molecule to a bidimensional probability distribution over a manifold. In turn, these distributions are used to generate 2D maps and locate compounds on them. Thus, molecules appear to be projected from a very high‐dimensional descriptor space onto the map that can be quantitatively characterized in terms of Neighborhood Behavior (NB) compliance: do similar molecules (expected to have similar properties) map within a same local map neighborhood? This is the necessary condition for GTM‐based quantitative prediction models, and it was confirmed over several hundreds of distinct biological properties. Notably, the so‐called Universal maps[ 14 , 16 ] were precisely dedicated to the goal of “polypharmacological competence”: the ability to host a maximum of such predictive landscapes on a same map. These were successfully applied in the above‐mentioned scrutiny of antiviral compound space, leading to compound repurposing.
The primary goal of this work is to apply the above‐mentioned validated chemography methods in order to achieve an overview of the medicinal chemistry efforts so far targeted against coronaviruses. It addresses the following key questions:
What kind of compounds were so far assessed against CoVs? Where on the map are the predominant antiviral chemotypes located?
How do they relate to other antiviral compound sets? How do these sets associated to viruses of different genera or species relate to each other?
How do they relate to clinically approved or pending antivirals from DrugBank?
There are no compound libraries tested against SARS‐CoV‐2 so far, but could cartography help to evaluate the focused libraries prioritized by docking?
Can a typical polypharmacological profile of CoV compounds be established by (cartography‐supported) in silico prediction? What can be learned from it?
Does the available data support the construction of predictive structure‐activity models for virtual screening?
Alternatively, is there enough data to support simple selection of putative active antivirals on the basis of their “residence” in privileged map areas occupied by CoV‐associated compounds and reference antivirals? Is this a filter stringent enough to pick a few hundreds out of the >1 billion commercially available compounds?
This includes comparing the compound libraries that were tested on various species and genera of viruses, using the maps to pinpoint positions of reference antivirals and highlight the main chemotypes/structural features observed in so‐far tested compounds. In this framework, comparisons were extended to focused libraries prioritized by docking [17] against the recently solved structure of SARS‐CoV‐2 3 C‐like proteinase. In Silico profiling of CoV compounds turned out to be a useful exercise, allowing both to highlight specific antiviral chemotypes and to establish sometimes unexpected relations to host targets potentially involved in antiviral response. Eventually, as far as the limited structure‐activity data allows, the maps were assessed in terms of their propensity to provide predictive activity class landscapes against specific viral proteins.
Last but not least, “anti‐CoV” map zones in which selected CoV‐associated compounds and reference antivirals preferentially reside were selected, and used for a direct, map neighborhood‐based virtual screen of 800 million standardized and unique structures extracted out of 1.5 billion commercially available ZINC compounds. [18] 380 potential antiviral agents stand out by the fact that they are consensually located in anti‐CoV zones on at least four of the seven used UMs.
2. Methods
2.1. Generative Topographic Mapping
Generative Topographic Mapping (GTM), introduced by Bishop et. al. [19] is a dimensionality reduction technique which transforms the initial, multi‐dimensional dataspace into 2D manifold latent space (the “map”). The manifold is non‐linearly fitted into high‐dimensional molecular descriptor space. Only a brief description of the methodology is given here, please refer to previous publications[ 13 , 14 ] for technical details. This manifold is sampled by a (squared) grid of nodes. Its geometry is optimized (“bent”) to approach at best all the items in descriptor space. Each item can then be “projected” on this bent manifold by fuzzily associating it to the nodes (the closer the node, the stronger the degree of association). A projected compound is described by its associated probability densities at each node, sometimes referred to as “node residence times” – as if the molecule would alternatively “reside” on several nodes, more often on the nearest. They form a vector of real numbers technically termed responsibility vector. The sum of responsibilities of a molecule is 1.0 – it must reside “somewhere” on the map. The strength of this fuzzy‐logical approach is the ability to ensure a finer analysis of chemical space (in a Kohonen map all residents of a same node are indistinguishable, as far as the Kohonen formalism may tell – on a GTM, two compounds predominantly residing on a same node may still be distinguished in terms of their responsibility values on other nodes).
Also, a GTM may host property landscapes, by assuming that each node has a property value taken as responsibility‐weighted mean of the properties of reference compounds used for landscape “coloring”. Herewith, GTMs can be de facto used as Quantitative Structure‐Activity Relationship (QSAR) models. Once a map is established, it does not support any model‐specific, tunable parameters (to enhance rendering of the specific activity landscape on the map). The only possibility is to select a map showing the best predictive propensity, out of a pool of considered maps (based on different molecular descriptor spaces, with different grid sizes, manifold flexibility, etc. – please see cited articles for a complete discussion on GTM operational parameters). If the map is NB compliant, all compounds close to a node will have similar properties and the resulting mean value is a meaningful representative of a map region. Then, any external compound with significant residence time in that area will have its property predicted equal to the local mean. Such predictions can be cross‐validated, or even validated in prospective virtual screening, herewith confirming the quality of the map. Any manifold can be challenged to host several different and unrelated properties. In particular, Universal [14] Maps (UMs) were selected for their propensity to support prediction of several hundreds of biological activities, and are therewith the primary choice to explore the medchem‐relevant chemical space, especially for situations where no single biological target is under scrutiny. They were hence used for antiviral chemical space analysis and antiviral compound repurposing, as already mentioned in Introduction. Here, all the seven[ 16 , 20 ] UMs – each based on different descriptor spaces, capturing complementary chemical information – were used for quantitative assessments (vide infra) but most of the displayed landscapes were shown on UM#1 (the one of best average predictive propensity over the battery of selection targets).
2.2. Datasets and Curation
CoV‐associated molecules (sometimes simply called “CoV” molecules) were retrieved from ChEMBL [5] version 26, following the previously described [8] procedure. The latest International Committee on Taxonomy of Viruses (ICTV) master species list (2018b.v2) was downloaded from https://talk.ictvonline.org/files/master‐species‐lists/m/msl/8266. All viral species names for Orthocoronavirinae subfamily were retrieved from it. The only species name that did not contain ′coronavirus′ as a part of the name was Porcine epidemic diarrhea virus. Thus, substrings ‘corona’ and ‘porcine epidemic diarrhea’ were searched in the ChEMBL assays table (fields: “description”, “assay_organism”, “mc_organism”), after removing all non‐alphanumeric characters from both queries and ChEMBL strings. Entries containing ′coronary′ were stripped and the rest were manually checked. Next, short versions of the virus names (′cov′, ′HKU10′, ′HKU8′, ′HKU1′, ′HKU24′, ′HKU2′, ′HKU5′, ′HKU4′, ′MERS′, ′SARS′, ′GCCDC1′, ′CDPHE15′, ′SW1′, ′BtKYNL63′, ′HKU9′, ′HKU20′, ′HKU11′, ′HKU15′, ′HKU13′, ′HKU16′, ′HKU19′, ′HKU21′, ′SW1′, ′GCCDC1′, ′229E′, ′NL63′, ′OC43′, ′hcov′, ′MHV′, ′FIPV′, ′ncov′) were also searched in the same fields of ChEMBL assay table. At this step, query strings were embedded between two white spaces (to force matching of entire words) whereas in ChEMBL strings all non‐alphanumerical characters were replaced by white spaces and then trailing whitespaces were removed. Eventually the same procedure was applied to the “organism” field of target_dictionary table. All searches were done in a case‐insensitive mode. Entries from ViralChEMBL [8] related to Coronaviridae family were extracted and those not already retrieved from the search above were added.
Other compound sets were compiled for comparison purposes. They include excerpts from the ViralChEMBL [8] database – compound sets associated to virus species other than CoV – including (a) RNA viruses that are not CoVs but are biologically most related to the latter and (b) some viruses of major concern having attracted a lot of research effort so far (see Table 1). To ensure that the kept entries have been tested quantitatively, a simple filter was applied to ensure that a numerical activity value was reported in the “standard_value” field, irrespective of whether this was declared to be an exact value, a minimal or a maximal threshold, and irrespective of units. A detailed statistics on the various entries related to activity and other fields is provided in the Supplementary Materials. With the exception of one specific SARS‐CoV protein inhibitor subset, no attempt to exploit these values in order to classify compounds into “active” and “inactive” was made.
Table 1.
Compound set sizes by viral genus and species with more than 100 associated compounds. Sets associated to a given genus also include compounds associated to species not explicitly listed in column 3. CoVs are given first.
|
Genus |
Genus Set Size |
Species |
Species Set Size |
|---|---|---|---|
|
Betacoronavirus |
1308 |
Severe acute respiratory syndrome‐related coronavirus (SARS‐CoV) |
1015 |
|
Tylonycteris bat coronavirus HKU4 |
221 |
||
|
Alphacoronavirus |
269 |
(Feline) Alphacoronavirus 1 |
192 |
|
Alphainfluenzavirus |
35681 |
Influenza A virus |
35681 |
|
BetaInfluenzavirus |
698 |
Influenza B virus |
698 |
|
Flavivirus |
3808 |
Dengue virus |
1852 |
|
West Nile virus |
757 |
||
|
Yellow fever virus |
599 |
||
|
Lentivirus |
49783 |
Human immunodeficiency virus 1 |
46868 |
|
Human immunodeficiency virus 2 |
2915 |
||
|
Mammarenavirus |
63001 |
Lassa mammarenavirus |
63001 |
|
Marburgvirus |
84835 |
Marburg marburgvirus |
84835 |
|
Orthobunyavirus |
129 |
California encephalitis virus |
129 |
|
Orthohantavirus |
119 |
Sin Nombre orthohantavirus |
119 |
|
Orthonairovirus |
222 |
Crimean‐Congo hemorrhagic fever orthonairovirus |
222 |
|
Phlebovirus |
414 |
Punta Toro virus |
414 |
Eventually, the DrugBank [21] set of all molecules including “antiviral” amongst associated categories (irrespective of their approval status, or the nature of targeted viruses) was used as an “indicator” set to annotate map regions by the reference antiviral drugs residing there.
There are of course no chemical libraries systematically screened against SARS‐CoV‐2, but in silico screening already produced potential candidates from docking into the recently resolved structures of its proteins. Notably, [17] a set of 1000 candidates with promising docking scores for the SARS‐CoV‐2 3CL proteinase were selected by “deep docking” from 1.3 billion commercially available compounds in the ZINC database. This pool was also analyzed in this study, by positioning it in the context of above‐retrieved CoV compounds.
All compounds were first standardized according to the business rules implemented on the ChemAxon‐powered [22] server http://infochim.u‐strasbg.fr/webserv/VSEngine.html of the Chemoinformatics Laboratory of Strasbourg (returning standardized unique stereochemistry‐depleted strings). These were encoded by the ISIDA fragment descriptors employed by the seven complementary [16] UMs [14] and then projected, herewith determining the responsibility vectors of every compound on each map. Cumulated responsibility vectors of compound sets have been obtained by summing up the responsibilities of compounds.
The chemical space occupied by compounds associated to a given antiviral activity was defined by monitoring the cumulated responsibilities of the corresponding compound sets. Compound sets were defined both with respect to the viral species (all compounds being reported in ChEMBL as tested on a virus, or a target of a virus of species S – query: species_name=”S”) and with respect to the viral genus G (query: genus_name=”G”). Obviously, the chemical space associated to a genus G is the overlap of the chemical spaces associated to the species representing the genus. Chemical spaces were only monitored if they featured at least 100 compound members.
2.3. Assessing the Degree of Overlap of the Chemical Space of Compound Sets
For each of the seven UMs, average cumulated responsibility vectors were calculated for each set, in order to calculate the degree of overlap of represented chemical spaces as the Tanimoto score of the mean cumulated responsibility vectors. Here CoV sets were compared to all the other antiviral sets, by genus or by species, respectively. For any pair of compared chemical spaces, mean and standard deviations of the seven overlap scores returned by each map were taken as the “generic” degree of overlap. Comparative graphical display of compound sets used by default the UM with the highest degree of overlap.
2.4. In Silico Profiling of CoV Molecules
As a natural consequence of projecting the pool of CoV‐tested compounds on the seven UMs, some of them can be directly traced back to chemical space zones shown to be preferentially populated by known “actives” on various (most but not exclusively human) biological targets disposing of significant structure‐activity data in the ChEMBL database (v. 24). A battery of 749 such activity landscapes can be rapidly used to predict for which of these activities a given compound appears to reside in an “active” neighborhood. Compounds that are consensually located in active neighborhoods by all the seven UMs are predicted “active” with respect to that target. Activity landscapes are originating from previous studies incorporating tested actives, tested inactives and random decoys. [23] CoV‐assessed compounds (all genera/species confounded) were subjected to this in silico profiling procedure and regrouped by the targets on which they were predicted active. Beyond highlighting potential off‐target effects of these molecules, this regrouping by “virtually hit” target is a useful way to cluster and browse through the chemical diversity of the CoV compounds. The consensus profiling tool can be used by selecting “ChEMBL24_profiler” in the “Select property to predict” roll‐down of the QSAR property predictor tool on http://infochim.u‐strasbg.fr/webserv/VSEngine.html.
2.5. CoV Activity Class Landscapes and their Quantitative Validation
Above‐collected structure‐activity data include >100 affinity‐related (dose‐response) measures with respect to the 3 C‐like proteinase (3CL) with 176 tested compounds of the SARS‐CoV of the 2003 outbreak (the so‐far best explored CoV). Within this series, compounds with IC50 or Ki values below 10 μM were considered active (25/176). This set, albeit small, was used to verify, by means of repeated 5‐fold cross‐validation, whether the herein employed UMs are capable to support predictive activity class landscapes in terms of binding to the viral proteinase. This cross‐validation procedure consists in iteratively using 4/5 of the set to build an activity class landscape, by assigning each map node a likelihood to host actives – as observed by counting the resident active and inactive compounds. Then, the left‐out 1/5 is projected on the landscape and assigned predicted active/inactive labels. After five iterations, each molecule has been exactly once within the left‐out 1/5 – thus, all molecules have predicted activity labels that can be confronted to actual activity labels. A Balanced Accuracy (BA) score can be computed as the mean of the ratio of correctly predicted actives and correctly predicted inactives. The procedure is repeated five times after reshuffling the compound order, leading each time to a (slightly) different BA score. The mean BA and its standard deviation over the five reshuffling attempts is reported as a measure of the predictive performances of the landscape.
2.6. Responsibility Pattern‐based Virtual Screening of ZINC Compounds
As part of ongoing chemical space mapping studies conducted by the Laboratory of Chemoinformatics, the pool of 1.5 billion ZINC entries was standardized to unique stereochemistry‐depleted SMILES, and then projected on the seven UMs. After discarding compounds that could not be properly processed by the standardizer, and removing duplicates of the standardized SMILES, 800 million structures remained. Note that each of these might represent several stereoisomers or even compounds originally rendered under another tautomeric form – therefore, each standardized SMILES is associated with the “+”‐concatenated string of all the ZINC id fields of the initial entries converging to that SMILES (and also reported in the list of selected items, in Supplementary Material). Since the fragment descriptors used to build the maps ignore stereochemistry, this means that any “hit” selected for residing in a relevant map neighborhood stands for all its possible stereoisomers.
For each of the seven UMs, the Responsibility Patterns (RP) of both SARS‐CoV compounds and DrugBank compounds were generated: these are nothing but characteristic strings obtained by rounding up the real‐value responsibility vectors, as already described. [9] Each RP defines a “block” in the space of responsibility vectors, and compounds sharing a same RP can be regarded as members of a same cell‐based cluster in responsibility space. RPs seen to occur in at least four of the SARS‐CoV compounds, or in at least two of the sparser DrugBank reference pool were used to define the “Relevant Antiviral Spaces (RAS)” on each map. An external compound having an RP that matches either of above‐selected RPs on a given map is de facto considered a resident of that RAS.
Since RP generation is an extremely fast procedure when responsibility vectors are already available, and a simple string matching operation suffices to decide whether a ZINC compound is or is not a member of the RAS of the current map, the virtual screening of 800 M ZINC entries took no more than a few hours on a standard multi‐CPU workstation.
Eventually, ZINC “hits” were sorted with respect to the number of UMs on which they were seen to reside within its RAS. Compounds residing in at least 4 out of 7 RAS were considered the virtual “hits” of this screening campaign.
3. Results and Discussion
3.1. Curated Compound Sets
Table 1 reports the sizes of ChEMBL‐extracted compound sets, by viral genus and species, respectively. As mentioned, these are sets of compounds reported to have been tested – all test protocols confounded – against one or more species and genera of CoV, including both active and inactive ones. Given the rather diverse panel of different testing protocols, defining the “actives” in each context is challenging – intimate knowledge of the testing protocols is required – but ineffective: it results in many very small compound sets labeled as “active”, but each label has ultimately a different meaning. That is detrimental [24] to statistics‐based chemoinformatics methods and machine learning, as the small sets cannot be merged (too heterogeneous), nor used individually (too small). The only notable exception in this work was the compilation of two small, yet acceptable structure‐activity sets pertaining to binding to SARS‐CoV proteinase.
Thus, compounds recruited in the above sets have in common the fact that scientists have deemed them to be interesting choices for testing in antiviral tests and screens. Most of these are far from being effective agents against those viruses – and, in particular, there are no approved human drugs against CoVs.
Note that some key species – particularly the virus responsible for the Middle East Respiratory Syndrome (MERS) did not make it onto the list of monitored subsets, because of insufficient (<100) entries (70 only for MERS‐CoV – a rather small set to illustrate chemical space occupancy, out of which 34 are furthermore also associated to SARS‐CoV). Therefore, this study is not a quantitative/predictive attempt of rational antiviral design – it is just an audit of the previous research effort, using chemography as a means to highlight relevant structures and inter‐compound relationships. This work is meant to provide a general, “bird's eye” view of CoV chemical space. It does not preclude that short chemical series of <100 compounds, supporting local QSAR models could be extracted. However, local models of limited applicability domain covering a specific series are only of interest for scientist wishing to expand that series, while here we assess global structure‐activity relations throughout the available chemical space.
3.2. Degrees of Chemical Space Overlap
Pairwise comparison of the cumulated responsibility vectors of above compound sets revealed that in general there is no systematic overlap of the chemical spaces associated to viral species or genera. In particular, the chemical space of compounds targeted against the genus Betacoronavirus (including the so‐far most studied SARS‐CoV species) is clearly distinct from the ones of other viral genera, as illustrated by the low overlap degrees displayed in Figure 1.
Figure 1.
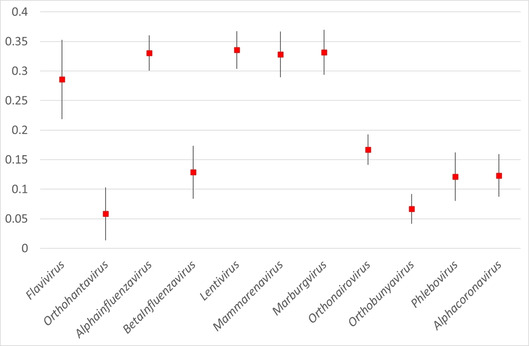
Mean Overlap Score (Tanimoto index of cumulated responsibility vectors) over the seven UMs (with standard deviations) between the chemical space occupied by Betacoronavirus compounds and spaces associated to other viral genera.
Scores above 0.3 arise when the chemical space covered by one of the sets happens to be a subzone of the space occupied by the larger set. Viruses of the Flavi‐, Influenza‐, Lenti‐, Mammarena‐ and Marburgvirus genera have attracted by far most of the research effort, and the much sparser tests against betacoronaviruses often relied on compound classes already used for the former.
Figure 2 illustrating the overlap of Lentivirus and Betacoronavirus chemical spaces on UM [16] nr. 4 is fully dominated by the very large Lentivirus collection. The map was chosen because it scored the overall highest overlap value of 0.37, albeit this is not outstanding (the minimal was 0.29, mean 0.33±0.03) and the landscapes are graphically very similar, irrespective of the chosen map). Protease inhibitors form a significant subset thereof, and peptidomimetics are indeed also shared by both sets (zones A and C). Interestingly, zone B is an intriguing fragment‐like molecule zone also shared by both libraries, with SARS‐CoV compounds forming a structurally homogeneous family of pyridol esters of thiophencarboxylic acid whereas Lentivirus compounds in this area are structurally quite diverse (their common denominator is the fragment‐like size). This comparative mapping can serve as a departure point to “repurpose”[ 7 , 9 ] some of the members of the large antiviral sets which share the CoV chemical space but were not yet assessed against CoVs.
Figure 2.
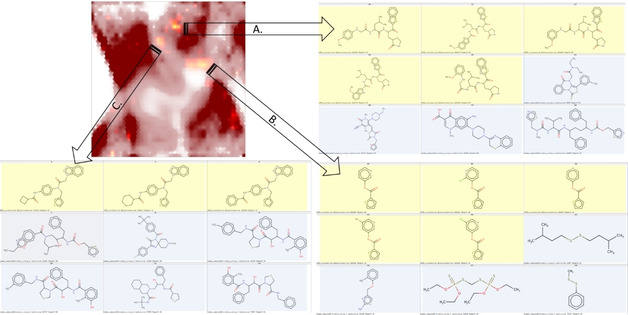
The vast chemical space of (anti‐HIV) compounds tested against lentiviruses occupies (red trace) virtually the entire UM#4 (refer to publication [16] ). Zones addressed by Betacoronavirus research “shine” through the high density of anti‐HIV compounds. For key regions (labeled A, B, and C), representative residents associated to Betacoronavirus (yellow background) and respectively Lentivirus (grey) are emphasized.
Interestingly, there is almost no overlap of the chemical spaces associated to the two genera (α,β) of CoVs represented in ChEMBL. Research against alphacoronaviruses (feline) is veterinary medicinal chemistry, and its scope is rather distinct from compounds targeting human respiratory viruses.
3.3. DrugBank and Reference Compounds
In Figure 3 below, the very small set of DrugBank molecules including the keyword “antiviral” [25] in category was projected on UM#1 and color‐coded by their status (approved in blue, not [yet] approved in red). Zones with intermediate colors signal chemical space areas of ongoing research within already explored chemical space zones – notably in the south‐west (the realm of protease inhibitors) and north‐north‐east (nucleotide/nucleoside‐like compounds). By contrast, a second zone of various “‐navir” protease inhibitors (center‐east) is rendered blue: confirmed drug exists, and no new analogues are pending approval. However, this zone is structurally not clearly distinct from the main south‐west peptidomimetics, as residents of both share common structural features – linear, flexible compounds with multiple amide bonds, where some main residents of the center‐east show some residual responsibility in the south‐west area. The main difference between the zones pertains to molecular complexity: the south‐west regroups some of the most complex, almost natural product‐like compounds such as the anti‐hepatitis “‐previr” (mainly macrocyclic) series of compounds. Other molecules here tend to feature fused aromatic heterocycles. Sometimes, the additional size/complexity in the south‐western corner stems, admittedly, from protective groups (t‐butyl ether on threonine residues, N‐terminal benzyloxycarbonyl groups) of no mechanistic interest – a common issue in the chemography of compound series including prodrugs. By contrast, central‐eastern “‐navir” peptidomimetics are somewhat smaller and do not include any fused aromatic systems. The north‐western corner is populated by sulfonamide derivatives, some of which (Tipranavir, for example) are large and linear enough to be considered as peptidomimetics.
Figure 3.
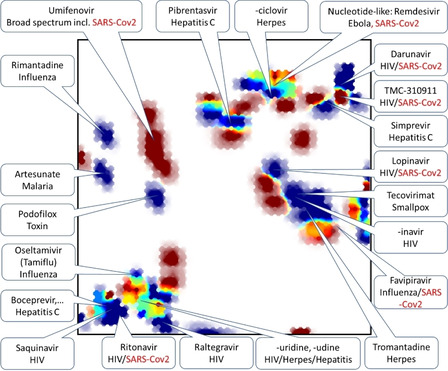
Projection (on UM#1) of DrugBank antiviral compounds color‐coded by their approval status.
Red zones represent compounds that are not approved by the Food and Drug Administration (which is the reference for the DrugBank approval flag) which are either “radical novelties” – chemotypes different from the ones in consecrated antivirals, but which still need to prove their efficacy, or antivirals in use elsewhere but not in the USA (Umifenovir). Key antivirals and promising new compounds are nominally localized on the map, with those attracting recent attention as potential anti‐SARS‐CoV‐2 highlighted in red. Note – Favipiravir, currently in clinical trials against SARS‐CoV‐2, [26] surprisingly does not include the label “antiviral” in the Category field in the DrugBank, although associated information does design it as such (it was manually added). Some compounds are annotated as antivirals even though this may not be their first indication – the antimalarial Artesunate (but not chloroquine, not listed as “antiviral” in DrugBank), the toxin Podofilox (used in dermatology to cure warts of potentially viral origin).
Since UMs define a common frame to project a vast number of compounds, it is thus possible to replace the landscape in Figure 3 by any other projection of compound libraries, all while keeping the frame of annotations. In this way, it is possible to instantly read out what zones inhabited by reference antivirals are addressed by a compound library, and which are ignored.
This annotation frame can also be helpful in highlighting, for example, the nature of the binders to the SARS‐CoV 3CL proteinase (Figure 4). This small subset of 25 actives was projected (blue) next to the entire DrugBank (red), and three relevant overlap zones were detected (the other spots of intermediate color represent “mixing” of low‐responsibility zones). Representative structures were highlighted for each zone – with the active SARS‐CoV protein inhibitor left versus matching DrugBank compound, right. Expectedly, peptidomimetics (south‐west) are present in both sets, albeit they are structurally rather different. There is an intriguing match in the nucleotide/nucleoside‐like area, with an undeniable chemical similarity between the active SARS‐CoV protein inhibiting thioester and Ribavirin – both featuring a triazole moiety connected to some oxygen‐containing heterocycle. However, this global similarity of pharmacophore patterns may be, in this particular case, irrelevant: protease inhibition activity may stem from the specific thioester function (covalent inhibition?). There is no compelling reason to assume that nucleoside mimics act on proteases.
Figure 4.
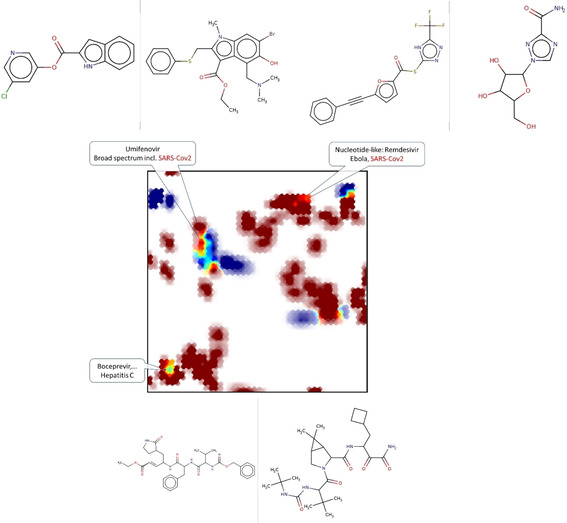
Projection (UM#1) of active (<10 μM) inhibitors of SARS‐CoV 3CL proteinase (blue) against the background of DrugBank compounds. Representative structures (protease inhibitor: left/DrugBank reference: right) are shown next to the key map zones with overlap.
Eventually, the match between Umifenovir (alias Arbidol) and protease‐inhibiting benzindole carboxylic acid esters is also intriguing. Umifenovir (a benzindole carboxylic acid ester, albeit of slightly different connectivity) is not approved by the FDA, but in use in Russia and Asian countries and currently tested against SARS‐CoV‐2. [26] This study suggests that it might act on the 3CL proteinase, a hypothesis not considered so far amongst the considered mechanisms of Umifenovir [27] – albeit this prediction is to be considered with caution: the structures share common, but also divergent features.
Last but not least, in silico‐predicted [17] binders to the SARS‐CoV‐2 3CL proteinase (red) were mapped against the entire pool of compounds targeted at the SARS‐CoV (blue), with results shown in Figure 5. Globally, the overlap of the two sets is rather low – partly due to the fact that not all compounds tested on SARS‐CoV were protease inhibitor‐like. Most overlap is, interestingly, observed in the central‐eastern realm of the “simpler” peptidomimetics – whereas docking returns no hits at all from the “twin” south‐western area. This could be tentatively explained that molecules of the complexity of Lopinavir represent some upper limit of (a) what is commercially available in ZINC and/or (b) what can be meaningfully docked in high‐throughput mode by a commercial tool. Otherwise, the docking protocol does visit a significant area of chemical space that was never explored against SARS‐CoV – for example, the south‐south‐west including references such as Raltegravir (however, an integrase, not a protease inhibitor). Only the experimental follow‐up of this prospective screening will show whether this progress into unchartered territories will trigger some interesting discoveries, or whether it is due to docking artefacts.
Figure 5.
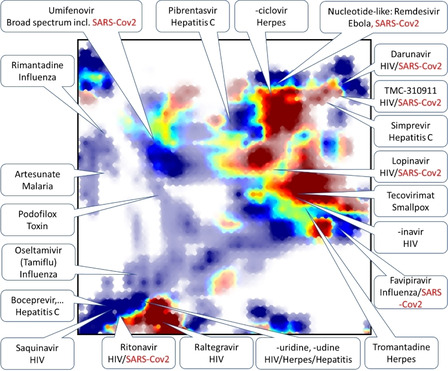
Pool of 1000 compounds predicted to inhibit the 3CL proteinase of the novel SARS‐CoV‐2, (red) mapped against the SARS‐CoV compounds (blue), within the DrugBank reference frame.
3.4. In Silico Profiling of CoV Molecules
As expected, most CoV‐tested compounds match the protease ligand chemotype – thus, unsurprisingly, many of them were predicted to interact with the protease subpanel within the set of 618 targets supported by the profiling tool. Further on, the chemical space of CoV compounds is rendered, in highlighting (blue) the compounds predicted to hit one or several of the profile targets below (Table 2). Targets associated to a same geographic zone on the UM# 1 are listed together (a maximum of four maps being shown) along with representatives of the structures in the highlighted zone. Albeit the display is limited to map nr. 1, prediction of virtual hit status relied on a consensus vote of all the seven UMs. This analysis implicitly allows to highlight more of the characteristic chemotypes among CoV compounds.
Table 2.
List of in silico profiling targets for which at least 40 representatives of the CoV‐assessed molecules were predicted to be active “virtual hits”, sorted by this number of virtual hits as given in the first column.
|
#Hits |
Target ID |
Target description |
|---|---|---|
|
117 |
CHEMBL2581 |
Cathepsin D: Homo sapiens |
|
115 |
CHEMBL4801 |
Caspase‐1: Homo sapiens |
|
109 |
CHEMBL3776 |
Caspase‐8: Homo sapiens |
|
102 |
CHEMBL2334 |
Caspase‐3: Homo sapiens |
|
96 |
CHEMBL204 |
Thrombin: Homo sapiens |
|
90 |
CHEMBL3198 |
Acetylcholinesterase: Mus musculus |
|
64 |
CHEMBL5800 |
Falcipain 2: Plasmodium falciparum |
|
54 |
CHEMBL333 |
Matrix metalloproteinase‐2: Homo sapiens |
|
52 |
CHEMBL268 |
Cathepsin K: Homo sapiens |
|
51 |
CHEMBL3891 |
Calpain 1: Homo sapiens |
|
49 |
CHEMBL4026 |
Signal transducer and activator of transcription 3: Homo sapiens |
|
48 |
CHEMBL233 |
μ opioid receptor: Homo sapiens |
|
47 |
CHEMBL2039 |
Monoamine oxidase B: Homo sapiens |
|
46 |
CHEMBL325 |
Histone deacetylase 1: Homo sapiens |
|
46 |
CHEMBL321 |
Matrix metalloproteinase 9: Homo sapiens |
|
46 |
CHEMBL1741219 |
Short transient receptor potential channel 4: Mus musculus |
|
44 |
CHEMBL4662 |
Proteasome Macropain subunit MB1: Homo sapiens |
|
42 |
CHEMBL320 |
Muscarinic acetylcholine receptor M3: Rattus norvegicus |
It is the south‐western peptidomimetic area (Figure 6), which unsurprisingly harbors most of the virtual hits associated to protease targets (calpains, thrombin, caspases). Intriguingly, this is also the area where – by the author's knowledge unexpected – interference with the histone deacetylase and respectively the signal transducer and activator of transcription 3 (STAT3) is expected to occur. An a posteriori literature search performed in order to learn more about this class of enzymes and their potential antiviral role revealed, however, [28] that inhibition of SIRT1, an NAD‐dependent histone deacetylase, appeared to significantly slow down replication of the Middle East respiratory syndrome virus. STAT3 is also cited [29] in the context of antiviral research – however, its role is not yet fully understood. Herewith, even though UM‐based in silico profiling is a simple, binary “active/inactive” predictor, in this case it was helpful to highlight otherwise unexpected hypotheses linking some of the CoV‐assessed compounds to putative action mechanisms.
Figure 6.
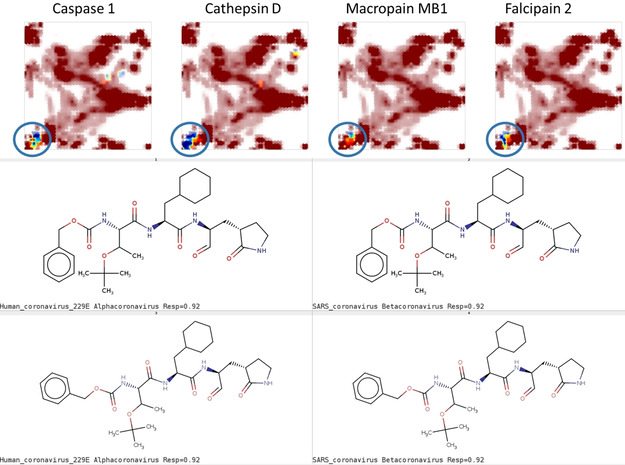
Chemical space zone (UM# 1) hosting most virtual hits against protease targets (not limited to the four cited above), and some representative structures thereof.
Matrix metalloproteases and caspase 3 also tend to accept some few “south‐western” peptidomimetics as virtual hits but (Figure 7) draw the majority of predicted binders from within the sulfonamide derivatives in the north‐eastern corner.
Figure 7.
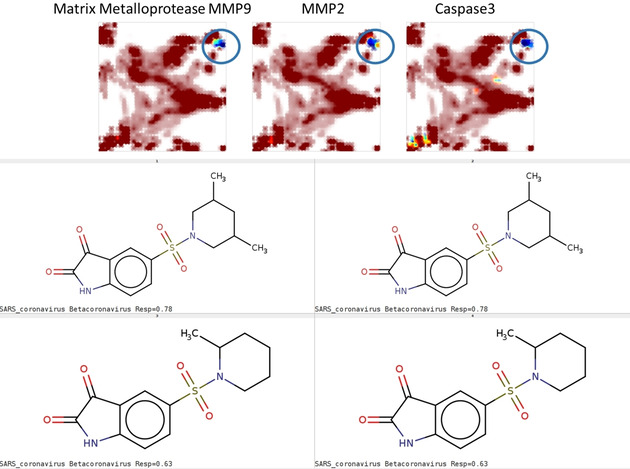
Chemical space zone (UM#1) of sulfonamide derivatives predicted to bind matrix metalloproteases and caspase 3, respectively.
Some CoV‐assessed compounds (Figure 8) display the typical aromatic‐spacer‐cation pharmacophore of bioactive amines – these were associated to GPCRs, but also calpain 1 and acetylcholinesterase. These chemotypes were observed in inhibitors of the papain‐like viral protease, but they are of concern because they signal real risks of potential side effects in mammals.
Figure 8.
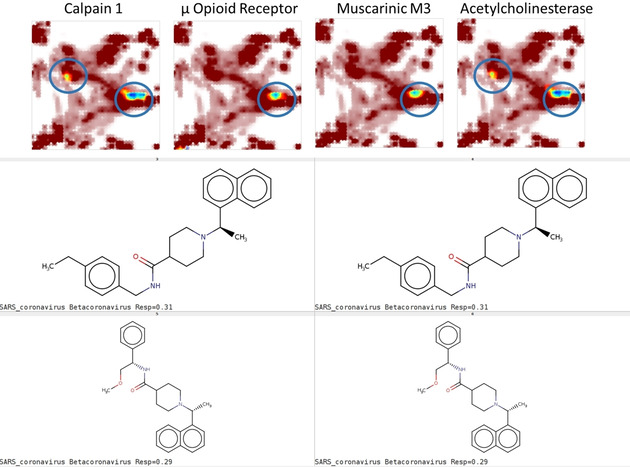
Compounds featuring the “bioactive amine‐like” pharmacophore are unsurprisingly predicted to interact with GPCRs and cation‐binding enzymes.
Last, some CoV compounds of rather diverse chemotypes were predicted to inhibit monoamine oxidase B (MAO B) and are illustrated in Figure 9 below. While MAO B is per se not associated to any antiviral role, the key structural element common to all highlighted species is the 1,2‐dicarbonyl fragment appearing in both isatin derivatives (top left structure) and ortho‐quinones, whereas the central‐southern zone features coumarones and curcumin‐like acyclic polycarbonyl compounds (enol form preferred here). Isatin derivatives are actually validated MAO inhibitors, so that the prediction concerning these are highly likely correct (note that the isatin scaffold is also often found in the north‐eastern sulfonamides connected by the in silico profiler to matrix metalloproteases). Isatins, [30] curcuminoids [31] and chromanones [32] are known for antibacterial, antifungal, antimalarial [33] activities – all while likely inhibiting MAOs – but to our knowledge there is no causal link between these activities. The observation may be purely anecdotical, but it has the merit to evidence the presence of these putatively redox‐active compounds among the so far tested CoV libraries.
Figure 9.
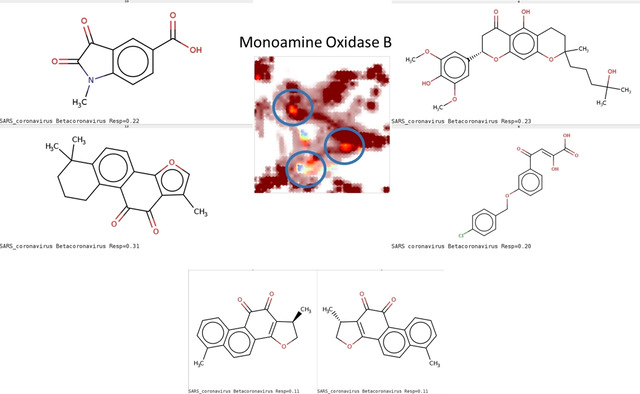
Compounds predicted to bind to monoamine oxidase B (MAO B). Two sample structures for each encircled zone are shown.
3.5. Quantitative Structure‐Activity Class Relationships Supported by Chemography
Projection of the small set of active and inactive binders to SARS‐CoV 3CL proteinase leads, irrespective of the used UM, to rather clear‐cut, discriminant landscapes where actives and inactives tend to occupy distinct spots. This separation is achieved “spontaneously”, by simple projection on the NB‐compliant UMs. This is interesting, since these “structure‐activity” sets are highly problematic. First, it is unclear to what extent the different dose‐dependent activity measures (Ki, IC50) compiled from different sources into ChEMBL are directly comparable ‐ to the point of imposing a common cutoff of 10 μM as activity threshold. But ‐ if they were not comparable, the already small set would have to be broken down into even smaller subsets, no longer useful for landscape construction. Allowing for a less rigorous definition of activity classes is the required price to pay for obtention of some sizeable structure‐activity class data set.
Cross‐validation success may however depend on the used map: as already shown,[ 16 , 20 ] each of these is based on different initial molecular descriptors and hence incarnate different points of view on NB. The 3CL proteinase has a marked preference for map nr. 6 (0.72±0.02), the worst being map nr. 5 (0.58±0.06). Thus, it can be concluded that UMs are, unsurprisingly, Neighborhood Behavior‐compliant with respect to the activity of this viral enzyme, but unfortunately, the very limited amount of data does not, at this point, support the construction of robust QSAR models. There is a clearly marked difference between separation of classes achieved when projecting the entire set on the map (corresponding to BA>0.85, in all cases, Figure 10) and the rather modest cross‐validation performances. It reflects that many compounds are singletons: often unique of their kind in their chemical space zone. Thus, when left out during cross‐validation, there are no relevant analogues in the 4/5 serving to train the landscape: the compound will be projected in a blank spot, and its activity will be inferred on hand of landscape nodes that are too remote to return an meaningful prediction. There is no point in trying to develop machine‐learned structure‐activity models on such datasets – they would only achieve an overfit (learning individual items “by heart”).
Figure 10.
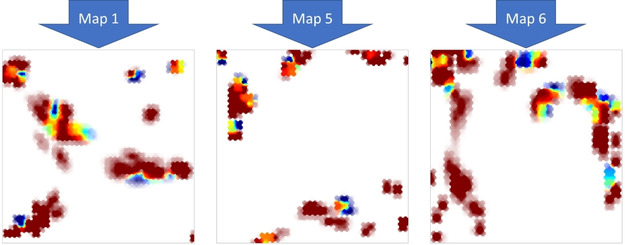
Activity class landscapes for SARS‐CoV 3CL proteinase (obtained by projecting the full sets), shown on three out of seven UMs.
3.6. Anti‐SARS‐CoV‐2 “Hits” from RP‐based Screening of ZINC
A pool of potentially novel compounds to be tested, in priority, against SARS‐CoV‐2 has been extracted from ZINC, in absence of explicit structure‐activity data against the virus in cellular or in vivo tests, or against any of its proteins. The above‐mentioned SARS‐CoV 3CL proteinase set is (a) too small, (b) uses a not very rigorously defined activity label and (c) is not necessarily extrapolable to SARS‐CoV‐2. Thus, the most rational approach in our opinion was to extract ZINC compounds characterized by the relevant RPs selected for each map – a broader scope, bound to include many inactive compounds, but not at risk of returning only very close analogs of SARS‐CoV compounds that may prove to be inactive against SARS‐CoV‐2. Relevant RPs defining the Relevant Antiviral Space (RAS) on each map included, each, between 12 (maps 1 and 4) and 29 (map 5) of RPs occurring at least four times in the SARS‐CoV library, and between 4 (map 4) and 8 (maps 1, 2 and 5) patterns seen at least twice in the DrugBank antiviral pool.
The RP string of an “ideal” hit should, for each of the maps, be among the selected ones. Such hits residing in all the seven RAS, are robust antiviral candidates, since consensually “voted” as such by all the seven independent and complementary maps. At the opposite end, compounds systematically outside of the RAS on each map are void of interest, or else incarnate a fully novel chemotype/action mechanism that cannot be foreseen on the basis of the current structure‐activity information. Interestingly, only two ZINC compounds were positioned within the RAS of all the seven maps, further two were six‐fold and two more were five‐fold RAS members. Further 385 compounds were within the RAS of four maps. This threshold of at least four RAS memberships out of seven emerges as the natural cutoff to select the list of anti‐SARS “hits” – at 3, the hit list length would already exceed 50 K. The request for consensual presence in the RAS for as many maps as possible is a very selective filter of ZINC candidates. Interestingly and somehow deceivingly – but not unexpectedly – five of the six molecules present in 5, 6 and 7 RAS, and six of those with 4 RAS memberships were actually not new, but members of the RAS defining pool (SARS‐CoV and DrugBank), also available in ZINC. The list of 380 “novel” selected ZINC structures, together with associated ZINC ID codes, is provided as Supplementary Material, together with the list of the eleven “rediscovered” chemical entities.
Chemical space occupancy of the entire anti‐SARS “hit” list of 391 compounds (red) is depicted in the left‐hand plot of Figure 11, on UM#1, against the background (blue) of the RAS‐defining compound pool, whilst the right‐hand landscape therein features the ZINC docking hits [17] in red, against the same background. There are 240 out of the 391 compounds in the RAS of map nr. 1 – by definition, these will overlap with RAS‐defining background compounds. The remaining, out of the RAS of map 1, may or may not overlap with the RAS‐defining compounds (the RAS is defined only by the recurrent RPs within the blue population). Thus, it is expected to observe a significant degree of overlap of the hits with the current patrimony of SARS‐CoV and DrugBank compounds, to a much higher degree than the one achieved by docking hits. It is unclear how much of the discrepancy is driven by the peculiarities of the recently crystallized SARS‐CoV‐2 proteinase – an information not available to RP‐driven virtual screening. The latter is obliged to rely on the hypothesis that anti‐SARS‐CoV‐like and DrugBank reference‐like molecules have so‐far the best chances to reveal themselves actives against SARS‐CoV‐2. Docked compounds clearly outside the background chemical space are perhaps riskier, but potentially more rewarding: if active, they might open the way to novel antiviral compound series. Nevertheless, the ZINC “hits” highlighted in the Figure 11 below are quite diverse, albeit some of the previously mentioned chemotypes can indeed be observed: bioactive amine‐like compounds, sulfonamides. The ZINC hit collection is however relatively poor in terms of compounds of the complexity of peptidomimetics – perhaps because (a) these are rather sparsely represented in ZINC and (b) because, given the complexity of these molecules spanning a significant part of the map, they tend to have rather distributed and unique responsibility patterns – which therefore were not occurring often enough to enter the RAS definition. Pending experimental validation will likely highlight the pros and cons of these very different approaches.
Figure 11.
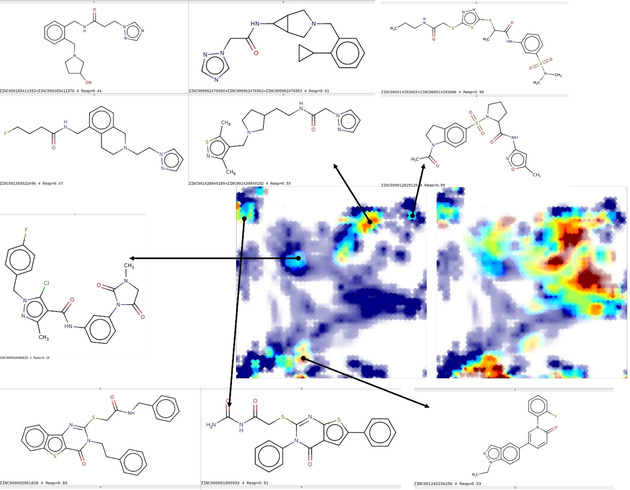
Left, the entire anti‐SARS‐CoV “hit” list of 391 compounds (red) is depicted on UM# 1, against the background (blue) of the RAS‐defining compound pool (SARS‐CoV+DrugBank), with some representative ZINC hits linked to their residence areas. The right‐hand landscape features the ZINC docking hits in red, against the same background.
A dedicated web page (http://infochim.u‐strasbg.fr/onlineGTM/projectcoronahome.php) was designed to host the seven interactive UM landscapes of the joint compound pool combining SARS‐CoV‐tested molecules from ChEMBL with the antiviral species from DrugBank. Alternatively, external users may predict whether their molecules of interest reside in the RAS of these seven maps, by accessing the QSAR property prediction menu of http://infochim.u‐strasbg.fr/webserv/VSEngine.html, and selecting “CoronaChemSpace” as property to predict (link also available from the maps homepage above). Unfortunately, for technical reasons it is not (yet) possible to plot user‐supplied, predicted compounds on interactive maps.
4. Conclusions and Future Directions
The actual emergency in the context of the SARS‐CoV‐2 crisis is successful drug repurposing, [34] for ab initio drug discovery and its lengthy phases will take 10+ years and cannot contribute to a rapid jugulation of the current outbreak – vaccine development being the rational alternative. Drug repurposing of known antivirals does (unfortunately) not require high‐throughput calculations or screening… because approved antivirals are preciously few. [25] Clearly, mankind allotted sufficient research resources only against threatening, widely spread and persistent viruses. Until 2020, coronaviruses did not reunite all the three conditions. For example, the Middle‐East Respiratory Syndrome (MERS) did not vanish but has no pandemic potential as it only spreads from camel to human: it is de facto a neglected disease, which at only 70 entries in ChEMBL did not even make it into the pool of herein studied chemical spaces. If the long and costly drug discovery campaign would have been pursued at high priority, although the SARS threat disappeared and MERS is confined to remote rural regions of the world, we would have certainly been in a better situation to address SARS‐CoV‐2 on the basis of a larger and better suited portfolio of repurposeable antivirals. Following long‐time goals, not driven by immediate danger but by the rational decision to anticipate further threats, has never been a strength of Homo sapiens – although it is the only mammal as successful in spreading over Terra as viruses and bacteria.
However, chemography, particularly when based on extremely polyvalent Generative Topographic Maps, is a powerful method to highlight structure‐activity relationships and to intuitively get acquainted to compound libraries, even while confronted with sparse experimental data. In the present work, it served to get a grasp of the medicinal chemistry so far directed at CoVs. The sketchy exploration of CoV chemical space as witnessed by this study will take a lot of time to reach the depth of exploration of the antiviral space of persistent threatening species (HIV, hepatitis B & C viruses, flu viruses, etc.). Nevertheless, some important insights originated from this study.
So far, compounds tested against coronaviruses are, in vast majority, either protease inhibitor‐like or nucleotide/nucleoside‐like molecules. However, other chemotypes and pharmacophores are also represented: bioactive amines featuring the GPCR‐specific aromatic ring‐basic amino group, potentially redox‐active conjugated (poly)carbonyl compounds (quinones, isatins, chromans) and small fragment‐like esters (likely covalent protease inhibitors) could also be highlighted by this chemographic study.
Subsets of compounds associated to various viral genera and species show rather distinct “signatures” concerning the occupancy of chemical space, as monitored in terms of cumulated responsibilities. CoV chemical space is seen to be a subset of the much vaster chemical spaces explored against lethal and persistent viruses.
The list of approved or pending compounds associated to an antiviral effect in DrugBank helped annotating the maps, and fixing specific residence areas of these special compounds, some of which are currently under clinical testing against SARS‐CoV‐2. This framework, combined to the reference density distribution of CoV compounds, helped to highlight some potentially interesting and some purely coincidental structural relatedness between compounds of different categories. Whereas the similarity of Ribavirin (nucleoside mimic) to SARS‐CoV 3CL‐inhibiting thioesters is probably coincidental, the similarity between Umifenovir and SARS‐CoV 3CL‐inhibiting indole esters raised the so‐far never considered hypothesis that Umifenovir might also act on viral proteases.
In silico profiling of CoV compounds against reference biological targets with well‐established structure‐activity landscapes on the UMs was helpful to highlight once more the dominant protease inhibitor‐like molecules – predicted to interfere with the proteases amongst the reference targets. Also, the less often occurring chemotypes (bioactive amines, potentially redox‐active compounds) were specifically highlighted by profiling results, as they were predicted to “hit” targets (GPCRs, acetylcholinesterase, monoaminoxidase B) which are not related to antiviral activity but might signal in vivo side effect in mammals. However, profiling unexpectedly suggested that some of these compounds might be histone deacetylase inhibitors – a target that seems to be associated to antiviral activity.
Unfortunately, at the current moment in time, the existing data are insufficient to support robust predictive structure‐activity models for quick virtual screening of electronic databases. This is true even for the SARS‐CoV strains of 2003. So far, a clear separation of actives from inactives by simple cartography is observed for the SARS‐CoV 3CL proteinase, albeit the rigor of activity label assignment had to be compromised in order to gather enough data for quantitative activity landscape construction. Even so, modest set sizes render cross‐validation difficult and suggest that prospective predictions of such a landscape would not be quite effective, because of its restrained applicability domain and the somehow fuzzy definition of the “active” classes.
However, GTMs are an extremely efficient tool for capturing structure‐activity relationship, since they do not need extensive data for model fitting. The ability to “host” predictive activity landscapes of the herein used UMs for hundreds of targets – including many reference proteases – was already demonstrated. Therefore, even though quantitative structure‐activity data against CoV is so‐far rather sketchy, cartography could nevertheless be used as a fast neighborhood‐based filter to pinpoint chemical space zones privileged by CoV compounds and quickly retrieve in‐there residing external molecules for testing. A set of 391 ZINC compounds were selected because they reside within the responsibility pattern‐based “Relevant Antiviral Spaces” of four or more of the seven UMs. Unsurprisingly, the top most consensual amongst them are already tested SARS‐CoV and/or DrugBank compounds, but the remaining 380 include quite diverse molecules. Interactive landscapes visualizing the RAS on each map, together with the underlying reference molecules were rendered publicly accessible at http://infochim.u‐strasbg.fr/onlineGTM/projectcorona1.php, while prediction of whether user‐submitted molecules fall within the RAS of these maps can be achieved on the public virtual screening server http://infochim.u‐strasbg.fr/webserv/VSEngine.html, by selecting CoronaChemSpace as property to predict in the QSAR property predictor tool.
This could be an admittedly imperfect, but nevertheless effective and very fast way to (pre)screen for anti‐SARS‐CoV agents, or more broadly, antiviral agents. Implicitly, anti‐SARS‐CoV compounds are the so‐far best working hypothesis to define an anti‐SARS‐CoV‐2 compound library. The only alternative to this is docking into homology‐modeled sites or protein‐protein interfaces, [35] albeit 3D structure elucidation of novel viral proteins is ongoing. [36] Cartography showed that recently published ZINC molecules prioritized by docking [17] according to their affinity score for SARS‐CoV‐2 3CL proteinase are interestingly only partially matching so‐far tested CoV chemical space. This implies the promise of paradigm‐breaking discoveries (novel actives of radically new chemotypes) but also a high degree of failure in screening.
Abbreviations
CoV – coronavirus, GTM ‐ Generative Topographic Mapping, MERS – Middle East Respiratory Syndrome, NB – Neighborhood Behavior, [Q]SAR – [Quantitative] Structure‐Activity Relationships, RAS – Relevant Antiviral Space, RP – Responsibility Pattern, SARS – Severe Acute Respiratory Syndrome, UM – Universal Map
Supplementary Material
A .tar file archiving SMILES and various information for all publicly available subsets discussed here is provided. Upon unpacking, it will create six directories: “spec”, ”gen”, ”DrugBank”, “ZINCVS” and eventually “SARS_coronavirus_3 C‐like_proteinase” corresponding to the SARS protein subset. In the latter, file “ref.smi_pos_act” relies compound SMILES to a local identifier in column 2 and the activity label in column 3 (1 – inactive, 2 – active). In the former two, subsets by species and genus respectively are provided – sets pertaining to coronaviruses are separately stored in subdirectories spec/corona and gen/corona. In “DrugBank” the file “ref.std.smi_name_id_app_org” contains SMILES, name, a local ID, approval status and organism name for the 130 DrugBank antivirals. “ZINCVS” contains the “novel” and “rediscovered” hits retrieved by the RP‐based virtual screen.
Last but not least, additional information and statistics about the text mining of ChEMBL records are provided in a separate PDF file.
Conflict of Interest
None declared.
Acknowledgements
The High Performance Computing (HPC) Center of the Strasbourg University is acknowledged for technical support. Yuliana Zabolotna, Ph.D. student of the Chemoinformatics Laboratory in Strasbourg, is acknowledged for the curation and mapping of 1.5 billion ZINC compounds. D.I.O thanks the State Research Funding for FSBSI “Chumakov FSC R&D IBP RAS” (research topic no. 0837‐2019‐0002) for support.
D. Horvath, A. Orlov, D. I. Osolodkin, A. A. Ishmukhametov, G. Marcou, A. Varnek, Mol. Inf. 2020, 39, 2000080.
Contributor Information
Dragos Horvath, Email: dhorvath@unistra.fr.
Alexandre Varnek, Email: varnek@unistra.fr.
References
- 1. Liu L., Clin. Infect. Dis. 2014, 59, 613–613. [Google Scholar]
- 2. Gorbalenya A. E., Baker S. C., Baric R. S., de Groot R. J., Drosten C., Gulyaeva A. A., Haagmans B. L., Lauber C., Leontovich A. M., Neuman B. W., Penzar D., Perlman S., Poon L. L. M., Samborskiy D. V., Sidorov I. A., Sola I., Ziebuhr J., V. Coronaviridae Study Group of the International Committee on Taxonomy of Nature Microbiology 2020, 5, 536–544. [Google Scholar]
- 3. Ogando N. S., Ferron F., Decroly E., Canard B., Posthuma C. C., Snijder E. J., Frontiers in Microbiology 2019, 10, 1813. [DOI] [PMC free article] [PubMed] [Google Scholar]
- 4.
- 4a. Kilianski A., Baker S. C., Antiviral Res. 2014, 101, 105–112; [DOI] [PMC free article] [PubMed] [Google Scholar]
- 4b. Zumla A., Chan J. F. W., Azhar E. I., Hui D. S. C., Yuen K.-Y., Nat. Rev. Drug Discovery 2016, 15, 327–347. [DOI] [PMC free article] [PubMed] [Google Scholar]
- 5. Gaulton A., Bellis L. J., Bento A. P., Chambers J., Davies M., Hersey A., Light Y., McGlinchey S., Michalovich D., Al-Lazikani B., Overington J. P., Nucleic Acids Res. 2011, 40, D1100-D1107. [DOI] [PMC free article] [PubMed] [Google Scholar]
- 6. Wang Y., Bryant S. H., Cheng T., Wang J., Gindulyte A., Shoemaker B. A., Thiessen P. A., He S., Zhang J., Nucleic Acids Res. 2016, 45, D955-D963. [DOI] [PMC free article] [PubMed] [Google Scholar]
- 7. Orlov A. A., Khvatov E. V., Koruchekov A. A., Nikitina A. A., Zolotareva A. D., Eletskaya A. A., Kozlovskaya L. I., Palyulin V. A., Horvath D., Osolodkin D. I., Varnek A., Mol. Inf. 2019, 38, 1800166. [DOI] [PubMed] [Google Scholar]
- 8. Nikitina A. A., Orlov A. A., Kozlovskaya L. I., Palyulin V. A., Osolodkin D. I., Database 2019, 2019. [DOI] [PMC free article] [PubMed] [Google Scholar]
- 9. Klimenko K., Marcou G., Horvath D., Varnek A., J. Chem. Inf. Model. 2016, 56, 1438–1454. [DOI] [PubMed] [Google Scholar]
- 10.
- 10a. Tarasova O. A., Urusova A. F., Filimonov D. A., Nicklaus M. C., Zakharov A. V., Poroikov V. V., J. Chem. Inf. Model. 2015, 55, 1388–1399; [DOI] [PMC free article] [PubMed] [Google Scholar]
- 10b. Stolbov A. L., Druzhilovskiy S. D., Filimonov A. D., Nicklaus C. M., Poroikov V. V., Molecules 2019, 25. [DOI] [PMC free article] [PubMed] [Google Scholar]
- 11. Oprea T. I., Gottfries J., J. Comb. Chem. 2001, 3, 157–166. [DOI] [PubMed] [Google Scholar]
- 12.
- 12a. Agrafiotis D. K., J. Comput. Chem. 2003, 24, 1215–1221; [DOI] [PubMed] [Google Scholar]
- 12b. Agrafiotis D. K., Rassokhin D. N., Lobanov V. S., J. Comput. Chem. 2001, 22, 488–500; [Google Scholar]
- 12c.I. T. Jolliffe, Principal Component Analysis, Springer Verlag, New York, 2002.
- 13.
- 13a.H. A. Gaspar, P. Sidorov, D. Horvath, I. I. Baskin, G. Marcou, A. Varnek, in Frontiers in Molecular Design and Chemical Information Science - Herman Skolnik Award Symposium 2015: Jürgen Bajorath, Vol. 1222 (Eds.: R. J. Bienstock, V. Shanmugasundaram, J. Bajorath), American Chemical Society, Washington, DC, 2016, pp. 211–241;
- 13b. Gaspar H. A., Baskin I. I., Marcou G., Horvath D., Varnek A., Mol. Inf. 2015, 34, 348–356; [DOI] [PubMed] [Google Scholar]
- 13c. Gaspar H. A., Baskin I. I., Marcou G., Horvath D., Varnek A., J. Chem. Inf. Model. 2015, 55, 84–94. [DOI] [PubMed] [Google Scholar]
- 14. Sidorov P., Gaspar H., Marcou G., Varnek A., Horvath D., J. Comput.-Aided Mol. Des. 2015, 29, 1087–1108. [DOI] [PubMed] [Google Scholar]
- 15. Kohonen T., Self-Organizing Maps, Springer, Heidelberg, Belin, Germany, 2001; [Google Scholar]; Kohonen T., Self-Organization and Associative Memory, Springer, Heidelberg, 1984. [Google Scholar]
- 16. Casciuc I., Zabolotna Y., Horvath D., Marcou G., Bajorath J., Varnek A., J. Chem. Inf. Model. 2019, 59, 564–572. [DOI] [PubMed] [Google Scholar]
- 17. Ton A.-T., Gentile F., Hsing M., Ban F., Cherkasov A., Mol. Inf. 2020, 39, 2000028. [DOI] [PMC free article] [PubMed] [Google Scholar]
- 18. Irwin J. J., Shoichet B. K., J. Chem. Inf. Model. 2005, 45, 177–182. [DOI] [PMC free article] [PubMed] [Google Scholar]
- 19.
- 19a. Bishop C. M., Svensén M., Williams C. K. I., Neurocomputing 1998, 21, 203–224; [Google Scholar]
- 19b. Bishop C. M., Svensén M., Williams C. K. I., Neural Computation 1998, 10, 215–234. [Google Scholar]
- 20. Lin A., Horvath D., Marcou G., Beck B., Varnek A., J. Comput.-Aided Mol. Des. 2019, 33, 331–343. [DOI] [PubMed] [Google Scholar]
- 21. Wishart D. S., Feunang Y. D., Guo A. C., Lo E. J., Marcu A., Grant J. R., Sajed T., Johnson D., Li C., Sayeeda Z., Assempour N., Iynkkaran I., Liu Y., Maciejewski A., Gale N., Wilson A., Chin L., Cummings R., Le D., Pon A., Knox C., Wilson M., Nucleic Acids Res. 2017, 46, D1074–D1082. [DOI] [PMC free article] [PubMed] [Google Scholar]
- 22.ChemAxon, www.chemaxon.com, Budapest, 2007.
- 23. Lin A., Beck B., Horvath D., Marcou G., Varnek A., J. Comput.-Aided Mol. Des. 2019. [DOI] [PubMed] [Google Scholar]
- 24. Sidorov P., Viira B., Davioud-Charvet E., Maran U., Marcou G., Horvath D., Varnek A., J. Comput.-Aided Mol. Des. 2017, 31, 441–451. [DOI] [PubMed] [Google Scholar]
- 25. De Clercq E., Li G., Clin. Microbiol. Rev. 2016, 29, 695–747. [DOI] [PMC free article] [PubMed] [Google Scholar]
- 26. Dong L., Hu S., Gao J., Drug Discoveries & Therapeutics 2020, 14, 58–60; Therapeutics 2020, 14, 58–60. [DOI] [PubMed] [Google Scholar]
- 27.
- 27a. Kadam R. U., Wilson I. A., Proc. Natl. Acad. Sci. USA 2017, 114, 206; [DOI] [PMC free article] [PubMed] [Google Scholar]
- 27b. Pécheur E.-I., Lavillette D., Alcaras F., Molle J., Boriskin Y. S., Roberts M., Cosset F.-L., Polyak S. J., Biochemistry 2007, 46, 6050–6059; [DOI] [PMC free article] [PubMed] [Google Scholar]
- 27c. Haviernik J., Štefánik M., Fojtíková M., Kali S., Tordo N., Rudolf I., Hubálek Z., Eyer L., Ruzek D., Viruses 2018, 10, 184. [DOI] [PMC free article] [PubMed] [Google Scholar]
- 28. Weston S., Matthews K. L., Lent R., Vlk A., Haupt R., Kingsbury T., Frieman M. B., J. Virol. 2019, 93, e00197–00119. [DOI] [PMC free article] [PubMed] [Google Scholar]
- 29. Roca Suarez A. A., Van Renne N., Baumert T. F., Lupberger J., PLoS Pathog. 2018, 14, e1006839. [DOI] [PMC free article] [PubMed] [Google Scholar]
- 30. Medvedev A., Buneeva O., Gnedenko O., Ershov P., Ivanov A., BioFactors 2018, 44, 95–108. [DOI] [PubMed] [Google Scholar]
- 31. Viira B., Gendron T., Lanfranchi D. A., Cojean S., Horvath D., Marcou G., Varnek A., Maes L., Maran U., Loiseau P. M., Davioud-Charvet E., Molecules 2016, 21, 18. [DOI] [PMC free article] [PubMed] [Google Scholar]
- 32. Di Pisa F., Landi G., Dello Iacono L., Pozzi C., Borsari C., Ferrari S., Santucci M., Santarem N., Cordeiro-da-Silva A., Moraes B. C., Alcantara M. L., Fontana V., Freitas-Junior H. L., Gul S., Kuzikov M., Behrens B., Pöhner I., Wade C. R., Costi P. M., Mangani S., Molecules 2017, 22. [DOI] [PMC free article] [PubMed] [Google Scholar]
- 33. Raj R., Biot C., Carrère-Kremer S., Kremer L., Guérardel Y., Gut J., Rosenthal P. J., Forge D., Kumar V., Chem. Biol. Drug Des. 2014, 83, 622–629. [DOI] [PubMed] [Google Scholar]
- 34. Zhou Y., Hou Y., Shen J., Huang Y., Martin W., Cheng F., Cell Discovery 2020, 6, 14. [DOI] [PMC free article] [PubMed] [Google Scholar]
- 35. Gordon D. E., Jang G. M., Bouhaddou M., Xu J., Obernier K., Meara M. J., Guo J. Z., Swaney D. L., Tummino T. A., Huttenhain R., Kaake R., Richards A. L., Tutuncuoglu B., Foussard H., Batra J., Haas K., Modak M., Kim M., Haas P., Polacco B. J., Braberg H., Fabius J. M., Eckhardt M., Soucheray M., Brewer M., Cakir M., McGregor M. J., Li Q., Naing Z. Z. C., Zhou Y., Peng S., Kirby I. T., Melnyk J. E., Chorba J. S., Lou K., Dai S. A., Shen W., Shi Y., Zhang Z., Barrio-Hernandez I., Memon D., Hernandez-Armenta C., Mathy C. J. P., Perica T., Pilla K. B., Ganesan S. J., Saltzberg D. J., Ramachandran R., Liu X., Rosenthal S. B., Calviello L., Venkataramanan S., Lin Y., Wankowicz S. A., Bohn M., Sharp P. P., Trenker R., Young J. M., Cavero D. A., Hiatt J., Roth T., Rathore U., Subramanian A., Noack J., Hubert M., Roesch F., Vallet T., Meyer B., White K. M., Miorin L., Rosenberg O. S., Verba K. A., Agard D., Ott M., Emerman M., Ruggero D., Garc, amp, iacute-Sastre A., Jura N., von Zastrow M., Taunton J., Schwartz O., Vignuzzi M., Enfert C., Mukherjee S., Jacobson M., Malik H. S., Fujimori D. G., Ideker T., Craik C. S., Floor S., Fraser J. S., Gross J., Sali A., Kortemme T., Beltrao P., Shokat K., Shoichet B. K., Krogan N. J., bioRxiv 2020, 2020.2003.2022.002386. [Google Scholar]
- 36. Jin Z., Du X., Xu Y., Deng Y., Liu M., Zhao Y., Zhang B., Li X., Zhang L., Peng C., Duan Y., Yu J., Wang L., Yang K., Liu F., Jiang R., Yang X., You T., Liu X., Yang X., Bai F., Liu H., Liu X., Guddat L. W., Xu W., Xiao G., Qin C., Shi Z., Jiang H., Rao Z., Yang H., bioRxiv 2020, 2020.2002.2026.964882. [Google Scholar]


