

Abstract
Background
The presentation of coronavirus 2019 (COVID‐19) overlaps with common influenza symptoms. There is limited data on whether a specific symptom or collection of symptoms may be useful to predict test positivity.
Methods
An anonymous electronic survey was publicized through social media to query participants with COVID‐19 testing. Respondents were questioned regarding 10 presenting symptoms, demographic information, comorbidities, and COVID‐19 test results. Stepwise logistic regression was used to identify predictors for COVID‐19 positivity. Selected classifiers were assessed for prediction performance using receiver operating characteristic (ROC) curve analysis.
Results
A total of 145 participants with positive COVID‐19 testing and 157 with negative results were included. Participants had a mean age of 39 years, and 214 (72%) were female. Smell or taste change, fever, and body ache were associated with COVID‐19 positivity, and shortness of breath and sore throat were associated with a negative test result (p < 0.05). A model using all 5 diagnostic symptoms had the highest accuracy with a predictive ability of 82% in discriminating between COVID‐19 results. To maximize sensitivity and maintain fair diagnostic accuracy, a combination of 2 symptoms, change in sense of smell or taste and fever was found to have a sensitivity of 70% and overall discrimination accuracy of 75%.
Conclusion
Smell or taste change is a strong predictor for a COVID‐19–positive test result. Using the presence of smell or taste change with fever, this parsimonious classifier correctly predicts 75% of COVID‐19 test results. A larger cohort of respondents will be necessary to refine classifier performance.
Keywords: COVID‐19, smell, taste, predictors, receiver operating characteristic curve, symptoms
In mid‐January 2020, the World Health Organization (WHO) reported 41 cases of a novel coronavirus infection that presented with fever, shortness of breath, and invasive pneumonic infiltrates on chest radiography. 1 Since that initial report, this novel coronavirus, now known as severe acute respiratory syndrome coronavirus 2 (SARS‐CoV‐2), has spread globally, with confirmed cases in almost every country. 2
With the swift spread of cases resulting in the virus's diseased state known as coronavirus 2019 (COVID‐19), development of reliable assessment methodologies to accurately predict and diagnose COVID‐19 infection is paramount to controlling its spread. Currently, the availability of COVID‐19 testing remains a limited resource. Insufficient access to testing supplies and reagents highlights the need to selectively restrict test kit usage to a relatively limited number of individuals. Many patients, including healthcare workers, are not tested as they do not meet “testing criteria” due to lack of an identifiable positive contact, lack of travel to a highly infected area, or lack of the common screening symptoms.
Although publicized symptoms for COVID‐19 include fever, fatigue, cough and shortness of breath, 3 , 4 several studies have also reported chemosensory dysfunction, such as anosmia and ageusia, as common findings in COVID‐19–positive patients. 5 , 6 , 7 Although upper respiratory infections are known to cause hyposmia in general, 8 in COVID‐19 patients, these symptoms can present in the absence of other nasal symptoms, suggesting that they are related to direct viral damage to the chemosensory system. 5 , 9 Within the United States, a study of COVID‐19 tested subjects revealed a significant association of smell and taste impairment in COVID‐19–positive patients. 10 A survey study of 417 European COVID‐19 patients identified cough, myalgia, and loss of appetite as the most common general presenting symptoms, with a significant percentage (86%) of patients noting smell dysfunction. 11 Based on these reports, it appears that smell and taste changes may be significant findings to consider when screening for COVID‐19 infection. 12
Several studies have developed prediction models for COVID‐19, most of which have focused on prognostic factors for survival. 13 A few prediction models for diagnosis have been published, but have mostly identified chest computed tomography (CT) and other laboratory findings as predictors. 14 One COVID‐19 diagnostic model identified the following key symptoms: fever, fatigue, shortness of breath, headache, and sore throat. 15 Smell and taste change have not been evaluated in any prediction models to date. We sought to address this information gap and included smell and taste change to construct prediction models for COVID‐19 positivity. We aimed to identify a parsimonious subset of symptoms that would enable a clinically tractable classifier to predict COVID‐19 positivity to improve both decision making on test resource allocation and evidence‐based counseling of concerned patients.
Materials and methods
The study was reviewed by the University of California, San Francisco (UCSF) Institutional Review Board and was given exempt status (IRB# 20‐30530). With the objective of obtaining a large number of responses over a short time period during this highly critical time of data collection and dissemination, an anonymous survey was publicized through several social media outlets. The public survey link was posted on social media venues including Facebook, Twitter, Reddit, and Nextdoor, targeting participant volunteers who had been tested or quarantined for COVID‐19 symptoms. Anonymous, self‐reported responses were collected between March 31, 2020, and April 10, 2020. Groups of healthcare workers treating COVID‐19 patients were also targeted. Recruitment included participants who identified as older than 18 years and had a history of prior COVID‐19 testing or history of being quarantined for symptoms of COVID‐19. To avoid bias, the survey title, “UCSF COVID‐19 Symptom Survey,” and questions, focused on broad COVID‐19 symptoms and presentation. Respondents reported COVID‐19 test results, demographic information, and COVID‐19–related comorbidities. The survey included forced choice, binary (yes/no) questions about the presence of 10 symptoms in the 2 weeks leading up to their test or quarantine: change in smell or taste, fever or chills, unexplained body aches, new sore throat, shortness of breath, new headache, new or worsened cough, nasal congestion, nausea or diarrhea, and runny nose.
Database management and statistical analysis
Data were collected and managed using Research Electronic Data Capture tools hosted at UCSF (REDCap Consortium, Vanderbilt University, Nashville, TN), and Microsoft Excel (Microsoft Corp, Redmond, WA).
Statistical analysis was preformed using Statistical Package for the Social Sciences version 26 (SPSS; IBM Corp., Armonk, NY). Demographic information was reported using descriptive statistics and univariate analysis was used to evaluate the incidence of each presenting symptom. Using the self‐reported COVID‐19–positive result, analysis was performed for each individual significant symptom to determine sensitivity = [true positives/(true positives + false negatives)] and specificity = [true negatives/(true negatives + false positives)]. Stepwise, forward selection, binary logistic regression was performed with COVID‐19 test result as the dependent variable and presence or absence of each classic COVID‐19 symptom, gender, number of comorbidities, age, and presence of chronic lung disease as independent variables to determine significant predictors for COVID‐19 positivity. The stepwise regression included thresholds of p = 0.05 for entry and 0.10 for removal with maximum iterations set at 20 and classifier cutoff at 0.5. This analysis was used to determine the best predictors for COVID‐19–positive test results. To assess for potential effects of all symptoms and confounders, all 14 variables were also entered in a full logistic regression model. Fourteen potential predictor variables were assessed for our cohort of 145 COVID‐19–positive subjects, which met the goal events per candidate predictor of 10 (Hosmer and Lemeneshow rule) to avoid model overfitting. 16
Internal validation of the predictors identified was performed using a randomly generated sample of 75% of the cohort (development set). This cohort was used to create a stepwise logistic regression model that was tested on the remaining 25% of the cohort (validation set), and classifier performance was examined. Cases without missing information (n = 246) were used for internal validation.
Receiver operating characteristic (ROC) curves were created to assess predictor performance after selecting relevant symptom classifiers based on the regression model and clinical utility. Area under the ROC curve (AUC) analysis was performed to assess the ability of symptom classifiers to discriminate COVID‐19–positive subjects from COVID‐19–negative subjects. Statistical significance was set at p value <0.05 for all analyses.
Results
Study participants
A total of 620 participants enrolled in the study between March 31, 2020, and April 10, 2020. A total of 339 participants reported a prior COVID‐19 test, 145 subjects (43%) had a positive test result (COVID+), 157 subjects (46%) reported a negative test result (COVID–), and 37 (11%) reported no result or uncertain result. Participants who reported a positive or negative test result (n = 302) at the time of the survey were included in this analysis. The cohort was predominantly female with a higher proportion of females in the COVID‐19–negative group (Table 1). Eleven (4%) respondents had been hospitalized (8 COVID+ and 3 COVID–, p = 0.095). There were no differences in age, race or ethnicity between positive and negative COVID‐19 test groups. A higher percentage of COVID‐19–negative patients reported chronic lung disease from asthma, chronic obstructive pulmonary disease (COPD), or emphysema as compared to COVID‐19–positive participants [χ2(1, N = 302) = 5.69, p = 0.017].
TABLE 1.
Demographic information
| Parameter | COVID+ | COVID– | χ2 or F | p |
|---|---|---|---|---|
| Total, n (%) | 145 (48) | 157 (52) | ||
| Age (years), mean ± SD | 40 ± 13 | 38 (11) | 8.32 | 0.33 |
| Sex, female, n (%) | 94 (65) | 120 (78) | 6.37 | 0.01 a |
| Comorbidities, n (%) | 5.05 | 0.17 | ||
| 0 | 120 (83) | 113 (72) | ||
| 1 | 20 (14) | 36 (23) | ||
| 2 | 4 (3) | 6 (4) | ||
| ≥3 | 1 (0.7) | 2 (1) | ||
| Presence of chronic lung disease, n (%) | 13 (9) | 29 (18) | 5.70 | 0.02 a |
aSignificant at p < 0.05.
COVID+ = COVID‐19 positive test; COVID– = COVID‐19 negative test; SD = standard deviation.
Symptom presentation
Based on self‐reporting of the 2 weeks prior to undergoing COVID‐19 testing or initiating quarantine for symptoms, the presence of fever, smell or taste change, and body aches were significantly associated with a positive diagnosis of COVID‐19, whereas shortness of breath and sore throat were associated with a negative COVID‐19 test result (Table 2). Incidence, sensitivity, and specificity of each symptom queried for COVID‐19 test result discrimination are shown in Table 2. Unexplained body aches demonstrated the highest sensitivity (80%) in univariate analysis, whereas change in smell or taste had the highest specificity (73%). Only 1 participant with a positive COVID‐19 test result reported none of the 10 symptoms.
TABLE 2.
Symptom features
| Symptom |
COVID+ n (%) |
COVID− n (%) |
Sensitivity (95% CI) (%) |
Specificity (95% CI) (%) |
p a |
|---|---|---|---|---|---|
| Unexplained body aches | 112 (77) | 87 (55) | 80 (72–86) | 44 (36–52) | <0.001 |
| Fever or chills | 106 (73) | 82 (52) | 73 (65–80) | 47 (39–56) | <0.001 |
| Change in smell or taste | 95 (66) | 42 (27) | 70 (61–77) | 73 (65–80) | <0.001 |
| New sore throat | 59 (41) | 107 (68) | 70 (62–77) | 54 (44–63) | <0.001 |
| Shortness of breath | 50 (34) | 81 (52) | 53 (45–61) | 62 (53–70) | 0.009 |
| New headache | 93 (64) | 90 (57) | 0.085 | ||
| New or worsened cough | 79 (54) | 104 (66) | 0.070 | ||
| Nasal congestion | 68 (47) | 61 (39) | 0.082 | ||
| Nausea or diarrhea | 64 (44) | 62 (39) | 0.347 | ||
| Rhinorrhea | 52 (36) | 54 (34) | 0.652 |
a p < 0.05 denotes significance.
CI = confidence interval; COVID+ = COVID‐19 positive test; COVID– = COVID‐19 negative test.
Determining predictors of COVID‐19
Stepwise, forward selection, binary logistic regression analysis was performed to determine the predictor variables associated with a COVID‐19 positive test result. The 5 classifier variables identified as the best predictors included the presence of smell or taste change, unexplained body aches, fever or chills, shortness of breath, and sore throat. Variables that fell out of the stepwise regression model, and were not significant in the analysis, included age, gender, history of lung disease, number of comorbidities, and presence of cough, rhinorrhea, nasal congestion, headache, or nausea or diarrhea. Each step in the model was statistically significant (p < 0.005), the final model (step 5) accounted for 44% of the variability of the outcome (Nagelkerke R 2 = 0.44) and the Hosmer and Lemeshow test demonstrated p > 0.05 for all model steps, denoting good model fit. Smell or taste change was the strongest predictor identified and when used as a sole classifier, accounted for 24% of the variability in the COVID‐19 positive test outcome (Nagelkerke R 2 = 0.24). Table 3 shows the logistic regression coefficient, Wald test, and odds ratio for each of the predictor variables and models. Fever or chills, smell or taste change, and myalgia were positively associated with a COVID‐19–positive test. Based on the step 5 predictor model created, the odds ratio for smell or taste change shows that when holding all other variables constant, an individual who reports smell or taste change is 7.4 times more likely to have a COVID‐19–positive test than 1 who does not report smell or taste change. Although significant, the effect of fever and myalgia was smaller than the effect from smell or taste change. An individual who reports fever is 2.4 times, and a person with myalgia is 3.1 times more likely to have a COVID‐19–positive test. Reported shortness of breath and sore throat were associated with a COVID‐19–negative result. Inverted odds ratios indicate that the odds of COVID‐19–negative result were 5 times higher if shortness of breath was reported and 3.3 times higher if sore throat was reported (Table 3). Full binary logistic regression with all 14 variables was done to evaluate the effect of all symptoms and potential confounders. The analysis identified the same 5 symptom variables as significant predictors and the other variables were not significant. Smell or taste change was associated with the largest odds ratio for COVID‐19 positivity. Adjusted odds ratios were similar to the final model in the stepwise logistic regression (Supporting Table 1).
TABLE 3.
Stepwise logistic regression, predictors for COVID‐19 positive test result *
| Step | Predictor | B | Wald | p | OR (95% CI) |
|---|---|---|---|---|---|
| Step 1 | Smell or taste change | 1.92 | 44.2 | <0.001 | 6.8 (3.9–12.0) |
| Step 2 | Smell or taste change | 2.27 | 47.4 | <0.001 | 9.7 (5.1–18.5) |
| Shortness of breath | –1.30 | 15.2 | <0.001 | 0.3 (0.1–0.5) | |
| Step 3 | Smell or taste change | 2.22 | 43.0 | <0.001 | 9.2 (4.7–17.8) |
| Shortness of breath | –1.69 | 21.4 | <0.001 | 0.2 (0.1–0.4) | |
| Fever or chills | 1.20 | 12.8 | <0.001 | 3.3 (1.7–6.4) | |
| Step 4 | Smell or taste change | 2.17 | 39.4 | <0.001 | 8.7 (4.4–17.2) |
| Shortness of breath | –1.58 | 18.0 | <0.001 | 0.2 (0.1–0.4) | |
| Fever or chills | 1.29 | 12.8 | <0.001 | 3.6 (1.8–7.1) | |
| New sore throat | –0.97 | 9.1 | 0.003 | 0.4 (0.2–0.7) | |
| Step 5 | Smell or taste change | 2.01 | 32.6 | <0.001 | 7.4 (3.7–14.8) |
| Shortness of breath | –1.74 | 20.2 | <0.001 | 0.2 (0.1–0.4) | |
| Fever or chills | 0.87 | 5.3 | 0.021 | 2.4 (1.1–5.0) | |
| New sore throat | –1.16 | 11.6 | 0.001 | 0.3 (0.2–0.6) | |
| Body aches | 1.14 | 7.9 | 0.005 | 3.1 (1.4–7.0) |
*Variable(s) entered on: Step 1: smell or taste change; Step 2: shortness of breath; Step 3: fever or chills; Step 4: new sore throat; Step 5: body aches.
B = logistic regression coefficient; CI = confidence interval; OR = odds ratio.
Classifier performance and discrimination
The selected predictors from the regression model were internally validated by splitting the cohort into a random 75% set (n = 184) for classifier development and a 25% (n = 62) set, which was used for validation. Stepwise logistic regression performed on the development set produced the same 5 predictors as when the analysis was run on the entire cohort. Table 4 shows the performance of the predictor model on the development and validation cohorts. Accuracy is defined as the sum of true positive and true negative cases relative to the total number of cases. The final predictor model created was able to correctly classify 74% of COVID‐19–positive test results and 71% of COVID‐19–negative results for an overall accuracy of 73% for the validation set. Accuracy of the validation set was within 3.5% of the development set.
TABLE 4.
Classifier validation
| Development set (n = 184) | Validation set (n = 62) | |||||
|---|---|---|---|---|---|---|
| Predictors | Sensitivity | Specificity | Accuracy a | Sensitivity | Specificity | Accuracy a |
| Step 5 | ||||||
| Smell or taste change | 77.9 | 74.5 | 76.1 | 74.1 | 71.4 | 72.6 |
| Shortness of breath | ||||||
| Fever or chills | ||||||
| New sore throat | ||||||
| Body aches | ||||||
aAccuracy = (true positive cases + true negative cases)/total number of cases.
Using classifiers identified from the regression model and clinical judgment, we chose to evaluate classifier discrimination for smell or taste change alone and with the presence of fever, myalgia, fever and myalgia, or absence of sore throat. To assess the discrimination ability of symptom predictor combinations, sensitivity and specificity analysis were performed and ROC curves were plotted (Fig. 1). AUC analysis to measure classifier performance using the presence of smell or taste change with either fever and/or myalgia showed fair diagnostic accuracy (AUC = 0.75, Table 5) with 75% correct discrimination of COVID‐19 positivity. Very good classifier performance (AUC = 0.82) required the inclusion of all 5 statistically modeled predictors (change in smell or taste, fever, myalgia, sore throat, and shortness of breath). 17
FIGURE 1.
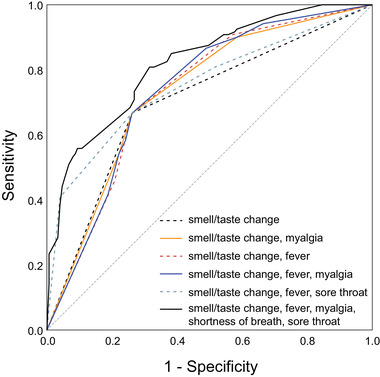
ROC curve plots for symptom classifier models. The dashed diagonal line shows a nondiagnostic result. AUC for each symptom classifier group is displayed in Table 5. AUC = area under the ROC curve; ROC = receiver operating characteristic.
TABLE 5.
Classifier performance
| Predictor set | AUC | Sensitivity | Specificity | OR (95% CI) | p a |
|---|---|---|---|---|---|
| Smell or taste change | 0.71 | 70 | 73 | 6.18 (3.71‐10.29) | <0.001 |
| Smell or taste change; myalgia | 0.74 | 69 | 73 | 6.20 (3.71‐10.33) | <0.001 |
| Smell or taste change; fever | 0.75 | 70 | 73 | 6.33 (3.79‐10.56) | <0.001 |
| Smell or taste change; myalgia; fever | 0.75 | 69 | 74 | 6.35 (3.79‐10.63) | <0.001 |
| Smell or taste change; sore throat | 0.75 | 67 | 74 | 5.74 (3.41‐9.69) | <0.001 |
| Smell or taste change; myalgia; fever sore throat; shortness of breath | 0.82 | 56 | 89 | 8.93 (5.59‐19.76) | <0.001 |
a p <0.05 denotes significance.
AUC = area under the receiver operating characteristic curve; CI = confidence interval; OR = odds ratio.
Discussion
In this study, we aimed to assess the symptoms associated with a COVID‐19–positive test in an outpatient population of individuals who were suitably healthy to complete the survey. Although we included smell and taste questions in our survey, we recruited any participant with a COVID‐19 test result regardless of specific symptoms. The goal of determining symptom‐based predictors for COVID‐19 was to better define those at risk for COVID‐19 infection for test resource allocation and patient counseling. Through logistic regression, we have identified and assessed the ability of symptom sets to accurately classify subjects as COVID‐19–positive. Symptoms associated with COVID‐19 positivity included the change to smell or taste, presence of fever and body aches, and absence of shortness of breath and sore throat. Although our findings differ from a European study that identified cough and gastrointestinal (GI) symptoms as common in COVID‐19, 11 our results are similar to other published work that reported both loss of smell and absence of sore throat in COVID‐19–positive patients with an adjusted odds ratio of 10.9 for COVID‐19 positivity if anosmia was reported. 10 We have similarly identified smell or taste change as the symptom with the strongest correlation to a COVID+ result, accounting for 24% of the variance in COVID‐19 test results. Variation most likely relates to differences in geographic locale and sample cohort COVID‐19 severity.
When screening patients for COVID‐19 positivity during this pandemic, is it important to consider both data‐driven information and reasoned clinical judgment. The statistical model using 5 diagnostic variables showed the highest overall accuracy of 82%, but the sensitivity of this model was low at 56%. Given the importance of a screening protocol with high sensitivity and exercising clinical judgment responsive to an evolving pandemic, we chose to assess performance of classifiers with the following symptoms: (1) presence of smell or taste change and fever, and (2) presence of smell or taste change and myalgia. Both prediction models performed very well with sensitivities between 69% and 70%, specificity of 73%, and overall discrimination accuracy of 74% to 75%. The diagnostic accuracy of adding either fever or myalgia to smell or taste change was minimal. We believe that either of these models are clinically reasonable when considering COVID‐19 patients, and both also performed well statistically.
Based on the favorable general health status of our outpatient study cohort constituted by younger adults with relatively few comorbidities and reasoned clinical judgment of symptom progression in severe COVID‐19 infection, we chose to exclude absence of shortness of breath in prediction model performance analysis. Because shortness of breath was found to be negatively associated with COVID‐19 positivity in the statistical model, we reported the association. We do not recommend inclusion of shortness of breath as a negative predictor of disease because it is a marker of more severe COVID‐19 disease that may not have been captured in the surveyed cohort. Chronic lung disease was found to be more common in COVID‐19–negative participants in this analysis and may be related to patients with lung disease seeking testing and medical treatment more frequently than their healthy counterparts. Moreover, our data suggest that a higher proportion of males were COVID‐19–positive, but we cannot exclude selection bias in seeking testing or in participating in an online survey.
Limitations of this study include dependence on retrospective self‐reporting with risk of recall bias regarding symptoms, possible duplicate entries, and selection bias of respondents to an anonymous online survey posted on social media. Due to the anonymous nature of this study and wide circulation to participants across the country, respondents were asked to self‐report their COVID‐19 results leading to potential erroneous responses. Additionally, COVID‐19 test performance indices are variable across testing locations, and specifics regarding testing procedures were not assessed, possibly contributing to variance in prediction model performance. Although we are not able to review patient medical records in this study, model validation results confirm that drawing from a large and diverse pool of subjects mitigates risk of self‐report errors from degrading prediction models in a significant manner. Last, we acknowledge that patient symptoms may change over time during the duration of their illness and asymptomatic and atypical presentations of COVID‐19 have been reported. 18 , 19 Therefore, although our models will be helpful for identification of at‐risk patients, it is important to remain vigilant for less common presenting symptoms of COVID‐19.
Online tools are under development for individual risk assessment of infection, and data to support these risk calculations will be extremely useful. The cohort evaluated in this study was relatively healthy, and able to participate in an online study. The survey responses may not reflect diverse populations of the United States, because age and race were not significant factors in our analysis. Although our work is exploratory, it represents 1 of the first steps to construct accurate predictor models for COVID‐19 positivity. Further work should include hospitalized patients to develop a more comprehensive prediction model that may be deployed broadly across the United States and abroad. More robust methods for prediction model development will require larger data sets and cross‐validation studies.
Conclusion
Chemosensory function change is strongly associated with a COVID‐19–positive test. In an outpatient population with few comorbidities, combining symptoms of smell or taste change with fever and/or myalgia predicts COVID‐19 positivity with fair accuracy. We believe that this information is highly valuable at a time in which testing resources remain highly constrained and important decisions must be made regarding testing resource allocation. While not a surrogate for testing, using predictive symptoms to determine pretest probability for COVID‐19 positivity can inform next steps in clinical decision‐making under uncertain circumstances.
Supporting information
Supporting Table 1 Binary Logistic Regression for COVID Positive Test Result
How to Cite this Article:Roland LT, Gurrola JG, Loftus PA, Cheung SW, Chang JL. Smell and taste symptom‐based predictive model for COVID‐19 diagnosis. Int Forum Allergy Rhinol. 2020;10:832–838.
Potential conflict of interest: S.W.C. is a consultant for ProLynx; L.T.R. is a consultant for Tissium.
References
- 1. World Health Organization (WHO) . Novel coronavirus ‐ China. Geneva, Switzerland: WHO; 2020. http://www.who.int/csr/don/12-january-2020-novel-coronavirus-china/en. Updated January 12, 2020. Accessed May 15, 2020. [Google Scholar]
- 2. Centers for Disease Control and Prevention (CDC) . Coronavirus Disease 2019 (COVID‐19). Global COVID‐19 . Atlanta, GA: CDC; 2020. https://www.cdc.gov/coronavirus/2019-ncov/cases-updates/world-map.html. Updated May 14, 2020. Accessed May 15, 2020. [Google Scholar]
- 3. Centers for Disease Control and Prevention (CDC) . Coronavirus Disease 2019 (COVID‐19). Symptoms of Coronavirus . Atlanta, GA: CDC; 2020. https://www.cdc.gov/coronavirus/2019-ncov/symptoms-testing/symptoms.html. Updated May 13, 2020. Accessed May 15, 2020. [Google Scholar]
- 4. World Health Organization (WHO) . Q&A on coronaviruses. Geneva, Switzerland: WHO; 2020. https://www.who.int/news-room/q-a-detail/q-a-coronaviruses. Updated May 4, 2020. Accessed May 15, 2020. [Google Scholar]
- 5. Vaira LA, Salzano G, Deiana G., De Riu G. Anosmia and ageusia: common findings in COVID‐19 patients. Laryngoscope. (in press). Epub 1 April 2020. 10.1002/lary.28692. Accessed May 15, 2020. [DOI] [PMC free article] [PubMed] [Google Scholar]
- 6. Gautier JF, Ravussin Y. A new symptom of COVID‐19: loss of taste and smell. Obesity (Silver Spring). (in press). Epub 1 April 2020. 10.1002/oby.22809. Accessed May 15, 2020. [DOI] [PMC free article] [PubMed] [Google Scholar]
- 7. Russell B, Moss C, Rigg A, Hopkins C, Papa S, Van Hemelrijck M. Anosmia and ageusia are emerging as symptoms in patients with COVID‐19: what does the current evidence say? Ecancermedicalscience. 2020;14:ed98. Epub 3 April 2020. 10.3332/ecancer.2020.ed98. Accessed May 15, 2020. [DOI] [PMC free article] [PubMed] [Google Scholar]
- 8. Soler Z, Patel Z, Turner J, Holbrook E. A primer on viral‐associated olfactory loss in the era of COVID‐19. Int Forum Allergy Rhinol. (in press). Epub 9 April 2020. 10.1111/alr.22578. Accessed April, 2020. [DOI] [PMC free article] [PubMed] [Google Scholar]
- 9. Brann DH, Tsukahara T, Weinreb C, et al. Non‐neuronal expression of SARS‐CoV‐2 entry genes in the olfactory system suggests mechanisms underlying COVID‐19‐associated anosmia. bioRxiv. 2020.03.25.009084. Epub 09 March 2020. 10.1101/2020.03.25.009084. Accessed May 15, 2020. [DOI] [PMC free article] [PubMed] [Google Scholar]
- 10. Yan C, Faraji F, DP P, Boone C, DeConde A. Association of chemosensory dysfunction and COVID‐19 in patients presenting with influenza‐like symptoms. Int Forum Allergy Rhinol. (in press). Epub 12 April 2020. 10.1002/alr.22579. Accessed May 15, 2020. [DOI] [PMC free article] [PubMed] [Google Scholar]
- 11. Lechien JR, Chiesa‐Estomba CM, De Siati DR, et al. Olfactory and gustatory dysfunctions as a clinical presentation of mild‐to‐moderate forms of the coronavirus disease (COVID‐19): a multicenter European study. Eur Arch Otorhinolaryngol. (in press). Epub 06 April 2020. 10.1007/s00405-020-05965-1. Accessed May 15, 2020. [DOI] [PMC free article] [PubMed] [Google Scholar]
- 12. Kaye R, Chang D, Kazahaya K, Brereton J, Denneny J. COVID‐19 anosmia reporting tool: initial findings. Otolaryngol Head Neck Surg. (in press). Epub 28 April 2020. 10.1177/0194599820922992. Accessed May 15, 2020. [DOI] [PubMed] [Google Scholar]
- 13. Wynants L, Van Calster B, Bonten MMJ, et al. Prediction models for diagnosis and prognosis of COVID‐19 infection: systematic review and critical appraisal. BMJ. 2020;369:m1328. [DOI] [PMC free article] [PubMed] [Google Scholar]
- 14. Song CY., Xu J., He JQ., Lu YQ. COVID‐19 early warning score: a multi‐parameter screening tool to identify highly suspected patients. medRxiv. 2020.03.05.20031906. Epub 08 March 2020. 10.1101/2020.03.05.20031906. Accessed May 15, 2020. [DOI] [Google Scholar]
- 15. Feng C, Huang Z, Wang L, et al. A novel triage tool of artificial intelligence assisted diagnosis aid system for suspected COVID‐19 pneumonia in fever clinics. medRxiv. 2020.03.19.20039099. Epub 20 March 2020. 10.1101/2020.03.19.20039099. Accessed May 15, 2020. [DOI] [Google Scholar]
- 16. Shipe ME, Deppen SA, Farjah F, Grogan EL. Developing prediction models for clinical use using logistic regression: an overview. J Thorac Dis. 2020;11(Suppl 4):S574‐S584. [DOI] [PMC free article] [PubMed] [Google Scholar]
- 17. Simundic, A. Measures of diagnostic accuracy: basic definitions. Med Biol Sci. 2020;22:61‐65. [PMC free article] [PubMed] [Google Scholar]
- 18. Bwire GM, Paulo LS. Coronavirus disease‐2019: is fever an adequate screening for the returning travelers? Trop Med Health. 2020;48:14. [DOI] [PMC free article] [PubMed] [Google Scholar]
- 19. Kim J, Thomsen T, Sell N, Goldsmith AJ. Abdominal and testicular pain: an atypical presentation of COVID‐19. Am J Emerg Med. (in press). Epub 31 March 2020. 10.1016/j.ajem.2020.03.052. Accessed May 15, 2020. [DOI] [PMC free article] [PubMed] [Google Scholar]
Associated Data
This section collects any data citations, data availability statements, or supplementary materials included in this article.
Supplementary Materials
Supporting Table 1 Binary Logistic Regression for COVID Positive Test Result