

Abstract
The coronavirus disease 2019 (COVID‐19) has evolved into a pandemic rapidly. The majority of COVID‐19 patients are with mild syndromes. This study aimed to develop models for predicting disease progression in mild cases. The risk factors for the requirement of oxygen support in mild COVID‐19 were explored using multivariate logistic regression. Nomogram as visualization of the models was developed using R software. A total of 344 patients with mild COVID‐19 were included in the final analysis, 45 of whom progressed and needed high‐flow oxygen therapy or mechanical ventilation after admission. There were 188 (54.7%) males, and the average age of the cohort was 52.9 ± 16.8 years. When the laboratory data were not included in multivariate analysis, diabetes, coronary heart disease, T ≥ 38.5℃ and sputum were independent risk factors of progressive COVID‐19 (Model 1). When the blood routine test was included the CHD, T ≥ 38.5℃ and neutrophil‐to‐lymphocyte ratio were found to be independent predictors (Model 2). The area under the receiver operator characteristic curve of model 2 was larger than model 1 (0.872 vs 0.849, P = .023). The negative predictive value of both models was greater than 96%, indicating they could serve as simple tools for ruling out the possibility of disease progression. In conclusion, two models comprised common symptoms (fever and sputum), underlying diseases (diabetes and coronary heart disease) and blood routine test are developed for predicting the future requirement of oxygen support in mild COVID‐19 cases.
Keywords: COVID‐19, mild, nomogram, progression, risk factor
Highlights
This study developed two models and visualized as nomogram for predicting the disease progression in mild COVID‐19. Model 1 only included symptoms and underlying diseases, which was more convenient for patients on self‐isolation to use. Blood routine tests have been added in model 2, which was mainly developed for doctors to assess the risk with simple laboratory examination and facilitated early decision making.
Abbreviations
- ALT
alanine aminotransferase
- AST
aspartate aminotransferase
- CHD
coronary heart disease
- COPD
chronic obstructive pulmonary disease
- COVID‐19
coronavirus disease 2019
- CRP
C‐reactive protein
- CVD
cerebrovascular disease
- DBP
diastolic pressure
- DM
diabetes mellitus
- ESR
erythrocyte sedimentation rate
- HR
heart rate
- ICU
intensive care unit
- IQRs
interquartile ranges
- LDH
lactic dehydrogenase
- NLR
neutrophil‐to‐lymphocyte ratio
- RR
respiratory rate
- RT‐PCR
real‐time polymerase chain reaction
- SARS‐CoV‐2
severe acute respiratory syndrome coronavirus 2
- SBP
systolic pressure
- WBC
white blood cell count
1. INTRODUCTION
Coronavirus disease 2019 (COVID‐19) is a new form of respiratory disorder caused by severe acute respiratory syndrome coronavirus 2 (SARS‐CoV‐2). 1 As reported by the World Health Organization coronavirus disease situation reports, it has infected over 1 773 088 cases and caused 111 652 deaths as of 13th April 2020. 2 Patients with COVID‐19 may develop hypoxemia and need oxygen support in hospital. 3 , 4
Most publications of COVID‐19 up to now mainly focus on severe patients. However, the majority of COVID‐19 is with mild syndromes. 5 , 6 Due to the scarcity of medical resources across the world, mild cases are recommended to stay at home with symptomatic treatment until a deterioration in many countries. 7 Apart from the physical discomfort, the panic in the possibility of disease progression is another serious problem. There is no simple tool for patients who are self‐isolated to quickly access individual risk for disease progression.
As all patients with COVID‐19 have been hospitalized in China regardless of the severity of diseases, 8 , 9 thus we have baseline data of mild COVID‐19 and the follow‐up data of disease progression. Herein we included patients with mild symptoms on admission to explore the risk factor for the requirement for aggressive treatment (defined as high‐flow oxygen supply, invasive or noninvasive mechanical ventilation) and develop simple tools for patients and doctors to predict the outcomes of mild COVID‐19.
2. METHODS
2.1. Study population
This is a retrospective cohort study including patients with COVID‐19 disease hospitalized in the Third People's Hospital of Yichang, Hubei from 25th January to 24th March 2020. The inclusion criteria for enrollment into the study were: (1) age ≥ 18 years; (2) positive result of SARS‐CoV‐2 in nasopharyngeal swab specimens tested by real‐time polymerase chain reaction (RT‐PCR) assay; (3) meet diagnostic criteria of COVID‐19 by WHO 10 ; (4) with complete clinical data; (5) no aggressive treatment required upon the first 24 hours after admission (because patients who require aggressive treatment upon the first 24 hours after admission are generally critical patients). The exclusion criteria were those needed high‐flow oxygen or mechanical ventilation on admission or within 24 hours after admission, or other special health conditions that required special medical intervention. The study was approved by the National Health Commission and the institutional board of the Third People's Hospital of Yichang and complied with the Declaration of Helsinki.
2.2. Patient characteristics
Data were extracted from electronic medical records. Onset time was defined as the time from the first relevant symptom of COVID‐19 to the time of admission. Those who smoked more than 10 cigarettes/day in the past 30 days were considered current smoker. 11 Heavy drinking was defined as long‐term habitual alcohol consumption, usually longer than 5 years, of more than 40 g/d in males and 20 g/d in females, or a history of binging on alcoholic beverages within the past 2 weeks with a converted alcohol intake > 80 g/d. 12 The comorbidity of interest that was recorded was hypertension, diabetes mellitus (DM), coronary heart disease (CHD), cerebrovascular disease (CVD), chronic obstructive pulmonary disease (COPD), and cancer.
2.3. Laboratory data
All blood samples were obtained at admission and analyzed by standard methods in the laboratory. The routine hematological and biochemical tests included measurement of white blood cell count (WBC), neutrophil count, lymphocyte count, monocyte count, C‐reactive protein (CRP), erythrocyte sedimentation rate (ESR), procalcitonin, fibrinogen, d‐dimer, liver and kidney function tests. Neutrophil‐to‐lymphocyte ratio (NLR) value was measured by dividing the neutrophil count by the lymphocyte count.
2.4. Definition of the stable group and progressive group
This definition of disease progression in this study was based on the practical need, which was, a self‐isolated COVID‐19 patient usually went to the hospital seeking for oxygen support because of dyspnea. According to whether they needed oxygen support (including high‐flow oxygen supply, invasive or noninvasive mechanical ventilation) or not, they were divided into the stable group and the progressive group.
2.5. Statistical analysis
Continuous variables were expressed as means ± SD or medians with interquartile ranges (IQRs), according to whether the distribution was normal or skewed. The Student t test was used for the comparison of normally distributed variables and the Mann‐Whitney U test for non‐normally distributed variables. Categorical variables were expressed as percentages and examined with the χ 2 test or Fisher's exact test as appropriate. The nomogram was developed based on a logistic regression model, which allowed us to obtain significant COVID‐19 progress probability estimations. An area under the receiver operator characteristic curve (AUROC) was used as a measure of diagnostic accuracy. A P‐value < .05 was considered statistically significant. Data management and analysis were performed using R software (R version 3.6.3, R Foundation for Statistical Computing, Vienna, Austria).
3. RESULTS
3.1. Baseline characteristics of patients
A total of 369 patients were hospitalized in the study, 11 patients were excluded for lack of laboratory examination, 6 patients were excluded for aggressive treatment on admission, and 8 cases were excluded for age under18 years old (Figure 1). A total of 344 patients were included in the final analysis, 45 of whom needed oxygen support 24 hours after admission and 299 stayed stable. There were 188 (54.7%) males, and the average age of the cohort was 52.9 ± 16.8 years. The median time from the onset of illness to admission was 3 days (IQR, 2‐5) and the median hospital stay was 23 days (IQR, 18‐31). Approximately 1 of 3 patients had comorbidities, of which hypertension, DM, CHD, CVD, COPD and cancer were present in 78 (22.7%), 38 (11.0%), 18 (5.2%), 9 (2.6%), 9 (2.6%), and 9 (2.6%) patients, respectively. The most common symptoms on admission were fever (78.5%) and cough (73.3%), followed by increased phlegm/sputum production (45.3%) and dyspnea (11.3%). A total of 15 (4.4%) patients eventually died (Table 1).
Figure 1.

Flow chart of cases selection
Table 1.
Comparison of baseline between stable and progressive groups
| Variables | Total | Stable group | Progressive group | P |
|---|---|---|---|---|
| N | 344 | 299 | 45 | |
| Male (%) | 188 (54.7) | 156 (52.2) | 32 (71.1) | .027 |
| Age, y | 52.9 ± 16.8 | 51.6 ± 16.5 | 61.5 ± 16.2 | <.001 |
| Onset time, median (IQR) | 3 (2, 5) | 3 (1, 5) | 5 (3, 7) | .006 |
| Death (%) | 15 (4.4) | 0 (0) | 15 (33.3) | <.001 |
| T ≥ 38.5 (%) | 162 (47.1) | 128 (42.8) | 34 (75.6) | <.001 |
| Current smoker (%) | 56 (16.3) | 47 (15.7) | 9 (20.0) | .611 |
| Heavy drinking (%) | 24 (7.0) | 22 (7.4) | 2 (4.4) | .753 |
| Comorbidity | 108 (31.4) | 80 (26.8) | 28 (62.2) | <.001 |
| Hypertension (%) | 78 (22.7) | 58 (19.4) | 20 (44.4) | <.001 |
| DM (%) | 38 (11.0) | 25 (8.4) | 13 (28.9) | <.001 |
| CHD (%) | 18 (5.2) | 9 (3.0) | 9 (20.0) | <.001 |
| CVD (%) | 9 (2.6) | 6 (2.0) | 3 (6.7) | .1 |
| COPD (%) | 9 (2.6) | 5 (1.7) | 4 (8.9) | .02 |
| Cancer (%) | 9 (2.6) | 5 (1.7) | 4 (8.9) | .02 |
| Fever (%) | 270 (78.5) | 227 (75.9) | 43 (95.6) | .005 |
| Cough (%) | 252 (73.3) | 212 (70.9) | 40 (88.9) | .018 |
| Sputum (%) | 156 (45.3) | 123 (41.1) | 33 (73.3) | <.001 |
| Dyspnea (%) | 39 (11.3) | 15 (5.0) | 24 (53.3) | <.001 |
| Headache (%) | 14 (4.1) | 11 (3.7) | 3 (6.7) | .407 |
| Fatigue (%) | 120 (34.9) | 99 (33.1) | 21 (46.7) | .107 |
| SBP, mm Hg | 127.3 ± 14.6 | 127.3 ± 14.6 | 127.2 ± 14.7 | .939 |
| DBP mm Hg | 77.3 ± 10.9 | 77.2 ± 10.7 | 77.9 ± 12.3 | .732 |
| HR, rates/min | 87.8 ± 10.8 | 87.8 ± 10.8 | 87.8 ± 11 | .987 |
| RR, rates/min | 21.7 ± 2.4 | 21.7 ± 2.3 | 21.9 ± 3.4 | .628 |
| WBC, ×109/L | 4.8 ± 2.1 | 4.6 ± 1.9 | 5.7 ± 3.1 | .027 |
| Neutrophil, ×109/L | 3.2 ± 2 | 3 ± 1.7 | 4.7 ± 3.3 | <.001 |
| Lymphocyte, ×109/L | 1.2 ± 0.5 | 1.2 ± 0.5 | 0.9 ± 0.4 | <.001 |
| NLR | 3.5 ± 4.5 | 2.9 ± 2.3 | 7.9 ± 10.1 | .002 |
| Monocyte, ×109/L | 0.3 ± 0.2 | 0.3 ± 0.2 | 0.3 ± 0.1 | .225 |
| CRP, mg/L | 24.4 ± 33 | 21.2 ± 31.1 | 44.7 ± 37.7 | <.001 |
| Procalcitonin, μg/L | 0.1 ± 0.5 | 0.1 ± 0.5 | 0.2 ± 0.3 | .258 |
| ESR, mm/h | 35.5 ± 25.9 | 33.1 ± 24.5 | 49.8 ± 29.5 | <.001 |
| FIB, g/L | 3.2 ± 1.0 | 3.2 ± 1 | 3.5 ± 0.9 | .106 |
| D‐dimer, mg/L | 1.2 ± 3.0 | 1.0 ± 1.9 | 2.5 ± 6.5 | .13 |
| TBIL, μmol/L | 11.1 ± 6.5 | 11.1 ± 6.7 | 11.1 ± 4.8 | .96 |
| Albumin, g/L | 37.7 ± 5.9 | 38.3 ± 5.8 | 33.5 ± 4.8 | <.001 |
| LDH, U/L | 234.9 ± 135.3 | 217.1 ± 108 | 339.2 ± 212.9 | <.001 |
| ALT, U/L | 27.4 ± 21.5 | 26.9 ± 20.8 | 30.8 ± 25.8 | .342 |
| AST, U/L | 25.3 ± 17.2 | 24.1 ± 16.7 | 32.6 ± 18.7 | .006 |
| Creatinine, μmolL | 74.6 ± 44.6 | 70.1 ± 24.0 | 103.8 ± 101.6 | .032 |
Note: Continuous variables were expressed as means ± SD or medians with interquartile ranges (IQRs).
Abbreviations: ALT, alanine aminotransferase; AST, aspartate aminotransferase; CHD, coronary heart disease; COPD, chronic obstructive pulmonary disease; CRP, C‐reactive protein; CVD, cerebrovascular disease; DBP, diastolic pressure; DM, diabetes mellitus; ESR, erythrocyte sedimentation rate; HR, heart rate; ICU, intensive care unit; LDH, lactic dehydrogenase; NLR, Neutrophil‐to‐lymphocyte ratio; RR, respiratory rate; SBP, systolic pressure; WBC, white blood cell count.
3.2. Comparison of the baseline between stable and progressive groups
Table 1 presents a comparison between the stable group and the progressive group. Compared with stable patients, those with disease progression were older, more likely to be male, with more comorbidities, and had a longer time of symptoms (P < .05). The laboratory examination revealed higher levels of WBC, neutrophil, NLR, CRP, ESR, LDH, AST, and creatinine, while a lower level of lymphocyte and albumin in the progressive group (P < .05). High body temperature (T ≥ 38.5℃) and lymphopenia were common in the progressive group. Smoking history, alcohol consumption, BP, HR, R, PCT, and other liver function tests were not statistically different between the two groups (P > .05).
3.3. Development of individualized prediction nomograms
Univariate and multivariate logistics regression were conducted to explore the risk factors for disease progression. Univariate analysis revealed age, gender, comorbidity, clinical symptoms (including fever and sputum), time of symptoms, WBC, and NLR were associated with COVID‐19 progression. When the laboratory data were not included in multivariate analysis, the DM (OR, 2.539; 95% CI, 1.014‐6.356), CHD (OR, 4.069; 95% CI, 1.068‐15.497), T ≥ 38.5℃ (OR, 5.675; 95% CI, 2.341‐13.757) and sputum (OR, 2.456; 95% CI, 1.113‐5.421) were independent risk factor of COVID‐19 progression (Table 2). We built Model 1 based on these variables. The best cutoff value of Model 1 was 0.133, with an AUROC of 0.849, a positive predictive value (PPV) of 34.6%, and a negative predictive value (NPV) of 96.2% (Table 3).
Table 2.
Multivariate logistic regression analysis for variables selection for models
| Model | Adjusted OR | 95% CI | P |
|---|---|---|---|
| Model 1 | |||
| Male gender | 2.026 | 0.906‐4.529 | .086 |
| Age | 1.018 | 0.992‐1.044 | .181 |
| Hypertension | 1.617 | 0.676‐3.867 | .280 |
| DM | 2.539 | 1.014‐6.356 | .047 |
| CHD | 4.069 | 1.068‐15.497 | .040 |
| CVD | 1.576 | 0.305‐8.134 | .587 |
| COPD | 1.786 | 0.343‐9.302 | .491 |
| Cancer | 3.500 | 0.659‐18.593 | .142 |
| Sputum | 2.456 | 1.113‐5.421 | .026 |
| T ≥ 38.5℃ | 5.675 | 2.341‐13.757 | <.001 |
| Onset time | 1.075 | 0.999‐1.157 | .053 |
| Constant | 0.006 | <.001 | |
| Model 2 | |||
| Male gender | 1.768 | 0.802‐3.899 | .158 |
| Age | 1.020 | 0.995‐1.046 | .116 |
| DM | 2.261 | 0.886‐5.769 | .088 |
| CHD | 5.106 | 1.369‐19.046 | .015 |
| Sputum | 2.131 | 0.950‐4.782 | .066 |
| T ≥ 38.5℃ | 5.084 | 2.071‐12.482 | <.001 |
| NLR | 1.182 | 1.051‐1.329 | .005 |
| WBC | 0.972 | 0.807‐1.170 | .764 |
| Constant | 0.006 | <.001 |
Note: Model 1 included age, gender, hypertension, DM, CHD, CVD, COPD, cancer, sputum, T ≥ 38.5, and onset time.
Model 2 included age, gender, DM, CHD, sputum, T ≥ 38.5℃, NLR and WBC.
Abbreviations: CHD, coronary heart disease; CVD, cerebrovascular disease; COPD, chronic obstructive pulmonary disease; DM, diabetes mellitus; NLR, neutrophil‐to‐lymphocyte ratio; WBC, white blood cell count.
Table 3.
Accuracy of prediction models for the diagnosis of progressive COVID‐19
| Models | Cutoff value | AUROC | Youden index | Sensitivity, % | Specificity, % | +LR | −LR | PPV, % | NPV, % |
|---|---|---|---|---|---|---|---|---|---|
| Model 1 | 0.133 | 0.849 | 0.573 | 80 | 77.26 | 3.52 | 0.26 | 34.6 | 96.2 |
| Model 2 | 0.136 | 0.872 | 0.603 | 80 | 80.27 | 4.05 | 0.25 | 37.9 | 96.4 |
Abbreviations: AUROC, area under the receiver operating characteristic curve; NPV, negative predictive value (%); PPV, positive predictive value; +LR, positive likelihood ratio; −LR, negative likelihood ratio.
When the blood routine test was included in multivariate analysis (Model 2), the CHD (OR, 5.106; 95% CI, 1.369‐19.046), T ≥ 38.5℃ (OR, 5.084; 95% CI, 2.071‐12.482) and NLR (OR, 1.182; 95% CI, 1.051‐1.329) were found to be independent predictors (Table 2). The AUROC of model 2 was 0.872, with a PPV of 37.9%, and an NPV of 96.4%. The best cutoff value of Model 2 was 0.136 (Table 3). The AUROC of model 2 was larger than model 1 (0.872 vs 0.849, P = .023). Two AUROC curves of the two models are presented in Figure 2. The visualization of the two models was presented as nomograms (Figure 3).
Figure 2.

Receiver operating characteristics (ROC) curves for predicting disease progression in mild COVID‐19
Figure 3.
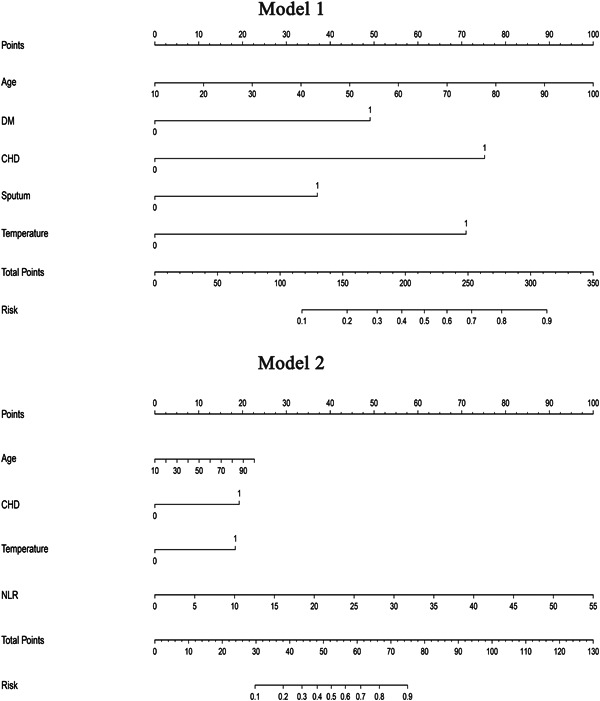
Nomogram of model 1 and model 2. Values for each variable are individually plotted and correspond to point values assigned from the point scale (top). These point values are then totaled and plotted on the total point scale (bottom), which is used to assign a corresponding value for risk of significant fibrosis. CHD, coronary heart disease; DM, diabetes mellitus; NLR, neutrophil‐to‐lymphocyte ratio
4. DISCUSSION
At present, oxygen supports (including high‐flow oxygen supply, invasive or noninvasive mechanical ventilation) are facing serious shortages, even in developed countries. 13 , 14 Therefore, it is very important to identify patients who do not need special oxygen inhalation, because these patients can be treated in isolation at home.
This study developed two models for predicting disease progression in mild COVID‐19. Model 1 included only age, symptoms, and underlying diseases, which was more convenient for patients on self‐isolation to use. Blood routine tests have been added in model 2, which was mainly developed for doctors to quickly assess the risk with simple laboratory examination and facilitated early decision making. The nomogram as the visualization of these models could serve as a simple tool for doctors and patients to calculate individual risk.
Comorbidities have already been proved to be associated with the severity of COVID‐19 by large amounts of literature. 5 , 6 , 15 , 16 , 17 , 18 , 19 , 20 , 21 In these two models, we found diabetes and CHD were the most powerful impact factors rather than any other comorbidity. As reported by the latest research, diabetic patients with COVID‐19 had higher expression of inflammation‐related markers such as C‐reactive protein and interleukin‐6, indicating they were prone to develop systemic inflammation and severe COVID‐19. 18 Patients with heart disease are more vulnerable to the hypopnea and pulmonary infection in COVID‐19, thus more likely to have deterioration in symptoms. 22 , 23
With additional blood routine indexes (including WBC and NLR), Model 2 showed a higher diagnostic value than model 1. NLR is increasingly recognized as a systemic inflammation factor, and the test is available in almost all laboratories. 19 , 24 The latest meta‐analysis showed that NLR reflecting an enhanced inflammatory process may suggest a poor prognosis of COVID‐19. 25 In addition, many population‐based studies have shown that an elevated level of NLR can be considered an independent risk factor for indicating the poor outcome of COVID. 19 , 26 , 27
Compared with Model 1, Model 2 had a larger AUROC with an additional blood routine test included. However, patients with mild COVID‐19 are not able to have a blood routine test in most parts of the world due to the scarcity of medical resources, which limits the application of Model 2. The variables in model 1, such as age, comorbidities, and symptoms, are all available at home and can be used by patients themselves. Although the PPV was not very high, the NPV of both models was as high as 96%, thus they could serve as useful tools to rule out the possibility of further medical intervention.
There were several limitations to this study. This study was a single‐center study with relatively small sample size. Moreover, due to the limited cases with disease progression, the internal‐external validation of these models was not able to be performed in this study. These two models had low PPV, which meant that the probability of screening positive patients was relatively low. However, the high NPV could make people of home quarantine at ease with stay at home treatment.
In conclusion, we developed two simple nomogram models as tools for predicting disease progression in mild COVID‐19. Common symptoms (including fever and sputum), underlying diseases (including diabetes and CHD), and blood routine tests are good indicators of COVID‐19 progression.
CONFLICT OF INTERESTS
All authors contributed to the manuscript for important intellectual content and approved the submission.
AUTHOR CONTRIBUTIONS
JH and AC designed the study and drafted the manuscript. AC acquired and did the statistical analysis. SL and JH made a critical revision. Yueyong Zhu and Gongping Chen did the study supervision.
ETHICS APPROVAL STATEMENT
Ethical approval for the study was obtained from the Ethics Committee of The Third People's Hospital of Yichang. All procedures performed in studies involving human participants were in accordance with the ethical standards of the Institutional Research Committee and with the 1964 Helsinki declaration and its later amendments or comparable ethical standards.
ACKNOWLEDGMENTS
This study is supported by the Chinese National 13th Five‐Year Plan's Science and Technology Projects (2017ZX10202201), the Fujian Province Health Youth Research Project (2019‐1‐37) and the Fujian Medical University Sailing Fund Project (2018QH1047).
Huang J, Cheng A, Lin S, Zhu Y, Chen G. Individualized prediction nomograms for disease progression in mild COVID‐19. J Med Virol. 2020;92:2074–2080. 10.1002/jmv.25969
Jiaofeng Huang and Aiguo Cheng contributed equally to this study, and share first authorship.
Contributor Information
Yueyong Zhu, Email: zhuyueyong@fjmu.edu.cn.
Gongping Chen, Email: cgp3542@163.com.
REFERENCES
- 1. El Zowalaty ME, Järhult JD. From SARS to COVID‐19: a previously unknown SARS‐ related coronavirus (SARS‐CoV‐2) of pandemic potential infecting humans—call for a One Health approach. One Health. 2020;9:100124. [DOI] [PMC free article] [PubMed] [Google Scholar]
- 2. WHO . Coronavirus Disease (COVID‐19) Outbreak Situation, 2020, https://www.who.int/emergencies/diseases/novel‐coronavirus‐2019. Accessed 13 April 2020.
- 3. Huang J, Lin H, Wu Y, et al. COVID‐19 in post‐transplantation patients—report of two cases. Am J Transplant. 2020:ajt.15896. [Google Scholar]
- 4. La Maestra S, Abbondandolo A, De Flora S. Epidemiological trends of COVID‐19 epidemic in Italy during March 2020. From 1,000 to 100,000 cases. J Med Virol. 2020:jmv.25908. [DOI] [PMC free article] [PubMed] [Google Scholar]
- 5. Xie H, Zhao J, Lian N, Lin S, Xie Q, Zhuo H. Clinical characteristics of non‐ICU hospitalized patients with coronavirus disease 2019 and liver injury: a retrospective study. Liver Int. 2020. [DOI] [PMC free article] [PubMed] [Google Scholar]
- 6. Guan W, Liang W, Zhao Y, et al. Comorbidity and its impact on 1590 patients with COVID‐19 in China: a nationwide analysis. Eur Respir J. 2020:2000547. [DOI] [PMC free article] [PubMed] [Google Scholar]
- 7. Razai MS, Doerholt K, Ladhani S, Oakeshott P. Coronavirus disease 2019 (COVID‐19): a guide for UK GPs. BMJ. 2020;368:m800. [DOI] [PubMed] [Google Scholar]
- 8. Ji D, Zhang D, Xu J, et al. Prediction for progression risk in patients with COVID‐19 pneumonia: the CALL Score. Clin Infect Dis. 2020. [DOI] [PMC free article] [PubMed] [Google Scholar]
- 9. Wynants L, Van Calster B, Bonten MMJ, et al. Prediction models for diagnosis and prognosis of COVID‐19 infection: systematic review and critical appraisal. BMJ. 2020;369:m1328. [DOI] [PMC free article] [PubMed] [Google Scholar]
- 10. WHO . Clinical management of severe acute respiratory infection when Novel coronavirus (nCoV) infection is suspected: interim guidance. https://www.who.int/internal‐publications‐detail/clinical‐management‐of‐severe‐acute‐respiratory‐infection‐when‐novel‐coronavirus‐(ncov)‐infection‐is‐suspected. Accessed March 10, 2020.
- 11. Haddad C, Sacre H, Hajj A, et al. Comparing cigarette smoking knowledge and attitudes among smokers and non‐smokers. Environ Sci Pollut Res Int. 2020. [DOI] [PubMed] [Google Scholar]
- 12. Li YM, Fan JG, Wang BY, et al. Guidelines for the diagnosis and management of alcoholic liver disease: update 2010: (published in Chinese on Chinese Journal of Hepatology 2010; 18: 167‐170). J Dig Dis. 2011;12:45‐50. [DOI] [PubMed] [Google Scholar]
- 13. Wells CR, Fitzpatrick MC, Sah P, et al. Projecting the demand for ventilators at the peak of the COVID‐19 outbreak in the USA. Lancet Infect Dis. 2020. [DOI] [PMC free article] [PubMed] [Google Scholar]
- 14. Arulkumaran N, Brealey D, Howell D, Singer M. Use of non‐invasive ventilation for patients with COVID‐19: a cause for concern? Lancet Resp Med. 2020. [DOI] [PMC free article] [PubMed] [Google Scholar]
- 15. Feng G, Zheng KI, Yan QQ, et al. COVID‐19 and liver dysfunction: current insights and emergent therapeutic strategies. J Clin Transl Hepatol. 2020;8:1‐7. [DOI] [PMC free article] [PubMed] [Google Scholar]
- 16. Graziano O, Giovanni R, Silvio B. Case‐fatality rate and characteristics of patients dying in relation to COVID‐19 in Italy. JAMA. 2020. [DOI] [PubMed] [Google Scholar]
- 17. Guan W, Ni Z, Hu Y, et al. Clinical characteristics of coronavirus disease 2019 in China. N Engl J Med. 2020;382:1708‐1720. [DOI] [PMC free article] [PubMed] [Google Scholar]
- 18. Guo W, Li M, Dong Y, et al. Diabetes is a risk factor for the progression and prognosis of COVID‐19. Diabetes Metab Res Rev. 2020:e3319. [DOI] [PMC free article] [PubMed] [Google Scholar]
- 19. Zhang Y, Zheng L, Liu L, Zhao M, Xiao J, Zhao Q. Liver impairment in COVID‐19 patients: a retrospective analysis of 115 cases from a single center in Wuhan city, China. Liver Int. 2020:liv.14455. [DOI] [PubMed] [Google Scholar]
- 20. Ca L, Ba X. The viral, epidemiologic, clinical characteristics and potential therapy options for COVID‐19: a review. Eur Rev Med Pharmacol Sci. 2020;24:4576–4584. [DOI] [PubMed] [Google Scholar]
- 21. Zhao Q, Meng M, Kumar R, et al. The impact of COPD and smoking history on the severity of Covid‐19: a systemic review and meta‐analysis. J Med Virol. 2020. [DOI] [PMC free article] [PubMed] [Google Scholar]
- 22. Yang C, Jin Z. An acute respiratory infection runs into the most common noncommunicable epidemic‐COVID‐19 and cardiovascular diseases. JAMA Cardiol. 2020. [DOI] [PubMed] [Google Scholar]
- 23. Du Y, Tu L, Zhu P, et al. Clinical features of 85 fatal cases of COVID‐19 from Wuhan: a retrospective observational study. Am J Respir Crit Care Med. 2020:rccm.202003‐0543OC. [DOI] [PMC free article] [PubMed] [Google Scholar]
- 24. Tan TP, Arekapudi A, Metha J, Prasad A, Venkatraghavan L. Neutrophil‐lymphocyte ratio as predictor of mortality and morbidity in cardiovascular surgery: a systematic review. ANZ J Surg. 2015;85:414‐419. [DOI] [PubMed] [Google Scholar]
- 25. Lagunas‐Rangel FA. Neutrophil‐to‐lymphocyte ratio and lymphocyte‐to‐C‐reactive protein ratio in patients with severe coronavirus disease 2019 (COVID‐19): a meta‐analysis. J Med Virol. 2020. [DOI] [PMC free article] [PubMed] [Google Scholar]
- 26. Liu Y, Du X, Chen J, et al. Neutrophil‐to‐lymphocyte ratio as an independent risk factor for mortality in hospitalized patients with COVID‐19. J Infect. 2020. [DOI] [PMC free article] [PubMed] [Google Scholar]
- 27. Yang AP, Liu J, Tao W, Li H. The diagnostic and predictive role of NLR, d‐NLR and PLR in COVID‐19 patients. Int Immunopharmacol. 2020;84:106504. [DOI] [PMC free article] [PubMed] [Google Scholar]