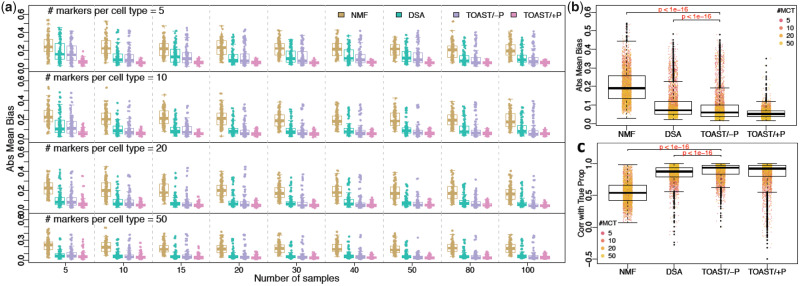
Fig. 2.
Results of simulation studies to evaluate the performance of TOAST/-P, TOAST/+P and existing methods. (a) Boxplots of Abs Mean Bias of estimated versus true proportions, by NMF, DSA, TOAST without prior (TOAST/-P) and TOAST with prior (TOAST/+P). Four rows from top to bottom are results with 5, 10, 20 and 50 markers per cell type. Nine columns from left to right are results with 5, 10, 15, 20, 30, 40, 50, 80 and 100 samples in total. (b and c) Abs Mean Biases and Corr with True Prop of four methods across different sample sizes and marker numbers. The P-values are obtained using paired t-test. The presented results are summarized over 100 Monte Carlo simulation experiments

