

Abstract
Summary
Single-cell RNA-sequencing (scRNA-seq) technology enables studying gene expression programs from individual cells. However, these data are subject to diverse sources of variation, including ‘unwanted’ variation that needs to be removed in downstream analyses (e.g. batch effects) and ‘wanted’ or biological sources of variation (e.g. variation associated with a cell type) that needs to be precisely described. Surrogate variable analysis (SVA)-based algorithms, are commonly used for batch correction and more recently for studying ‘wanted’ variation in scRNA-seq data. However, interpreting whether these variables are biologically meaningful or stemming from technical reasons remains a challenge. To facilitate the interpretation of surrogate variables detected by algorithms including IA-SVA, SVA or ZINB-WaVE, we developed an R Shiny application [Visual Surrogate Variable Analysis (V-SVA)] that provides a web-browser interface for the identification and annotation of hidden sources of variation in scRNA-seq data. This interactive framework includes tools for discovery of genes associated with detected sources of variation, gene annotation using publicly available databases and gene sets, and data visualization using dimension reduction methods.
Availability and implementation
The V-SVA Shiny application is publicly hosted at https://vsva.jax.org/ and the source code is freely available at https://github.com/nlawlor/V-SVA.
Contact
leed13@miamioh.edu or duygu.ucar@jax.org
Supplementary information
Supplementary data are available at Bioinformatics online.
1 Introduction
Single-cell RNA-sequencing (scRNA-seq) is a revolutionary technology for characterizing transcriptional profiles of individual cells. However, these data harbor multiple hidden (latent) sources of variation, including ‘unwanted variation’ that can stem from diverse technical sources (e.g. cell contamination, cell cycle stage and batch effects) and ‘wanted variation’ that stems from biological sources (e.g. cell subtypes). Detecting and adjusting for these latent variables in downstream analyses is a very active research area in single-cell genomics. We recently developed Iteratively Adjusted Surrogate Variable Analysis (IA-SVA) (Lee et al., 2018), an SVA-based algorithm (Leek and Storey, 2007; Leek et al., 2012) that can accurately estimate hidden sources of variation even if these factors are correlated with each other and with known sources of variation. However, a challenge with SVA-based analyses is the annotation of detected SVs and their interpretation for downstream analyses. To address this challenge, we developed an R Shiny (Chang et al., 2018) application for Visual Surrogate Variable Analysis (V-SVA). V-SVA is the first web tool capable of detecting hidden sources of variation and annotating these using diverse gene sets and functional databases (e.g. pathways) to help interpret these sources. This interactive framework is user-friendly and provides functions for visualization and data analyses.
2 Materials and methods
2.1 Input data, preprocessing and normalization
V-SVA requires a 2D matrix containing feature counts and sample identifiers. Users may optionally provide a sample metadata file (Supplementary Material) containing known factor information. Users then follow four optional steps for data preprocessing; which are summarized in Supplementary Material.
2.2 Estimating SVs (hidden factors)
Next, users may specify which known factor(s) (from the input metadata file) they wish to adjust for in estimating hidden sources of variation (hidden factors). Afterwards, users choose from three algorithms for SV estimation: IA-SVA (default) (Lee et al., 2018), SVA (Leek et al., 2012) or ZINB-WaVE (Risso et al., 2018) (Supplementary Material).
3 Results
3.1 Using V-SVA to study responses to IFN-β
To illustrate the utility of V-SVA, we explored a publicly available scRNA-seq dataset consisting of 14 039 human peripheral blood mononuclear cells (PBMCs) stimulated with IFN-β (Kang et al., 2018). Here, for proof-of-concept, we assume that the treatment status (the factor indicating which cells are treated with IFN-β) is not known and we use V-SVA (with the IA-SVA algorithm) to infer the SV associated with the IFN-β response and genes associated with it. After gene filtering (≥5 counts in at least five cells), 1324 genes were retained; filtered data were normalized using a counts per million (CPM) approach (Chen et al., 2014). Five SVs were estimated while adjusting for the donor of origin as a known factor.
3.1.1. Studying the correlation between SVs and known factors
V-SVA provides a plot (Wei et al., 2017) of the absolute Pearson correlation coefficients between detected SVs and known sources of variation (Fig. 1A). In this example, SV2 is highly correlated (R = 0.88) with IFN-β treatment, the target hidden factor (Supplementary Table S1 and Fig. S1).
Fig. 1.
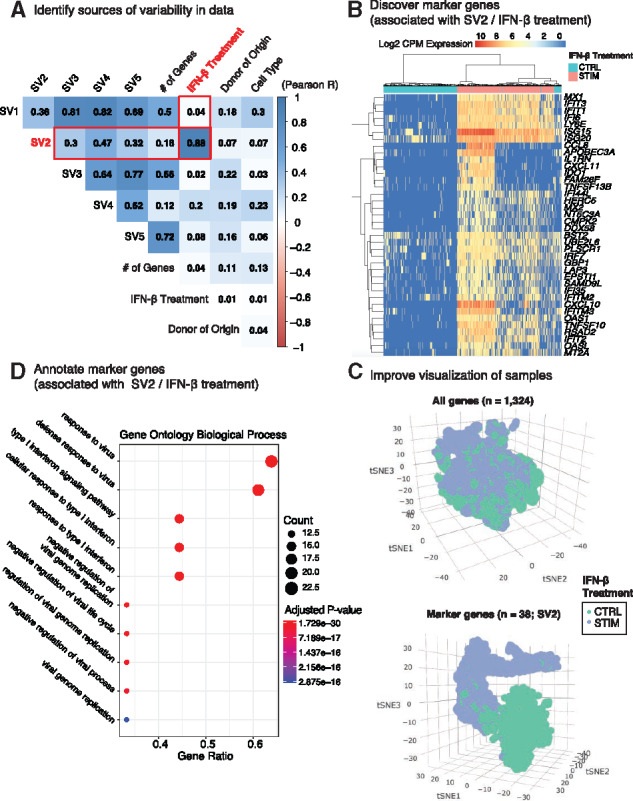
An overview of V-SVA workflow for studying responses to IFN-β. (A) Correlation of detected five SVs with each other and known sources of variation. (B) Heatmap of expression levels (log2 CPM) of IFN-β response-associated genes (n=38, SV2). Cells are labeled by IFN-β treatment status (‘STIM’ or ‘CTRL’). (C) t-SNE plots of PBMCs using all genes (top; n=1324 genes) or SV2 marker genes (bottom; n=38). (D) GO enrichment analysis of SV2 marker genes. Note the enrichment of immune response related biological terms. Size (color) of the circle represents the numbers of marker genes present in the term (Benjamini–Hochberg adjusted P-values). X-axis (gene ratio) indicates the % of marker genes present in the term relative to the size of the term
3.1.2. Identifying marker genes associated with IFN-β response
We used V-SVA to identify genes that are associated with IFN-β treatment (detected as SV2). We identified 38 genes (Fig. 1B;Supplementary Table S2) associated with this response, which included interferon-induced genes (IFIT1, IFIT2, IFIT3, IFITM2, IFITM3) implicated in innate immune system activation (Diamond and Farzan, 2013) and chemokine ligand genes (CXCL10, CXCL11) involved in the Th1 adaptive immune response (Sokol and Luster, 2015).
3.1.3. Visualization of single cells with SV marker genes
V-SVA supports dimension reduction techniques, such as principal component analysis, classical multidimensional scaling and t-distributed stochastic neighbor embedding (t-SNE) (Maaten, 2014) for interactive visualization (Sievert et al., 2018) (Supplementary Table S3). In our case study, t-SNE of 14 039 PBMCs using the 38 genes associated with the IFN-β response primarily separated cells based on their treatment status (Fig. 1C; bottom) as expected, while a similar t-SNE analysis using all genes (n = 1324) grouped all cells together (Fig. 1C; top). These analyses indicate that gene selection via V-SVA can aid single-cell visualization.
3.1.4. Gene annotation and enrichment analysis
To associate detected SVs with biological and cellular functions, V-SVA conducts enrichment analyses using diverse regulatory genomic sources including Gene Ontology (GO) terms, Kyoto Encyclopedia of Genes and Genomes pathways, genes associated with cell cycle progression, human immune system modules (Weiner, 2018) and immune cell-specific gene sets inferred from scRNA-seq data (Supplementary Material). For our case study, we performed enrichment analyses (Yu et al., 2012) for SV2-associated genes using GO biological process terms using default settings (Supplementary Material). As expected, the resulting enrichment plot (Fig. 1D) included terms associated with innate immune system activation (e.g. response to virus, type I interferon signaling pathway, response to type I interferon) (Supplementary Table S4).
4 Discussion
Detecting and interpreting hidden sources of variation in scRNA-seq data is a challenging task. Currently, there are no tools for the interpretation of hidden sources. To address this gap, we designed V-SVA, an easy to use framework for interactive detection and annotation of hidden variation in scRNA-seq datasets using diverse gene sets.
Funding
This work was supported by the National Institute of General Medical Sciences under award number [GM124922 to D.U.]; and a grant from Chan-Zuckerberg Initiative and Silicon Valley Community Foundation [2018-182753 (5022) to D.U.].
Conflict of Interest: none declared.
Supplementary Material
References
- Chang W. et al. (2018) shiny: web Application Framework for R https://cran.r-project.org/web/packages/shiny/index.html (11 October 2019, date last accessed).
- Chen Y. et al. (2014) Differential expression analysis of complex RNA-seq experiments using edger In: Datta,S. and Nettleton,D. (eds.) Statistical Analysis of Next Generation Sequencing Data. Springer, New York, pp. 51–74. [Google Scholar]
- Diamond M.S., Farzan M. (2013) The broad-spectrum antiviral functions of IFIT and IFITM proteins. Nat. Rev. Immunol., 13, 46–57. [DOI] [PMC free article] [PubMed] [Google Scholar]
- Kang H.M. et al. (2018) Multiplexed droplet single-cell RNA-sequencing using natural genetic variation. Nat. Biotechnol., 36, 89–94. [DOI] [PMC free article] [PubMed] [Google Scholar]
- Lee D. et al. (2018) Detection of correlated hidden factors from single cell transcriptomes using Iteratively Adjusted-SVA (IA-SVA). Sci. Rep., 8, 17040. [DOI] [PMC free article] [PubMed] [Google Scholar]
- Leek J.T., Storey J.D. (2007) Capturing heterogeneity in gene expression studies by surrogate variable analysis. PLoS Genet., 3, e161. [DOI] [PMC free article] [PubMed] [Google Scholar]
- Leek J.T. et al. (2012) The sva package for removing batch effects and other unwanted variation in high-throughput experiments. Bioinformatics, 28, 882–883. [DOI] [PMC free article] [PubMed] [Google Scholar]
- Maaten L. v d. (2014) Accelerating t-SNE using tree-based algorithms. J. Mach. Learn. Res., 15, 3221–3245. [Google Scholar]
- Risso D. et al. (2018) A general and flexible method for signal extraction from single-cell RNA-seq data. Nat. Commun., 9, 284. [DOI] [PMC free article] [PubMed] [Google Scholar]
- Sievert C. et al. (2018) plotly: create Interactive Web Graphics via ‘plotly.js’ https://cran.r-project.org/web/packages/plotly/index.html (14 February 2020, date last accessed).
- Sokol C.L., Luster A.D. (2015) The chemokine system in innate immunity. Cold Spring Harb. Perspect. Biol., 7, a016303. [DOI] [PMC free article] [PubMed] [Google Scholar]
- Wei T. et al. (2017) corrplot: visualization of a Correlation Matrix https://cran.r-project.org/web/packages/corrplot/index.html (26 April 2019, date last accessed).
- Weiner J. (2018) tmod: feature Set Enrichment Analysis for Metabolomics and Transcriptomics https://cran.r-project.org/web/packages/tmod/index.html (26 April 2019, date last accessed).
- Yu G. et al. (2012) clusterProfiler: an R package for comparing biological themes among gene clusters. OMICS J. Integr. Biol., 16, 284–287. [DOI] [PMC free article] [PubMed] [Google Scholar]
Associated Data
This section collects any data citations, data availability statements, or supplementary materials included in this article.