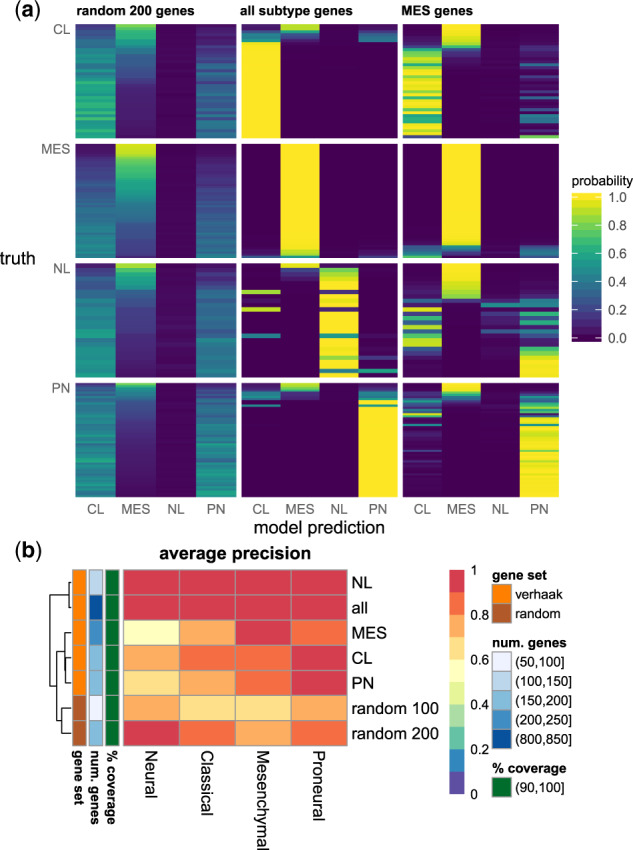
Fig. 5.

Gene masking of the subtype neural network: (a) estimated subtype probabilities, where each row was a patient and grouped by their true subtype and (b) classification performance measured by AP in gene set masking, where each row was a gene set and each column was the subtype prediction (see also Supplementary Figs S6–S8). The random gene set excluded ones in a subtype set. For visualization purposes, rows were sorted by the mesenchymal probabilities. CL, classical; MES, mesenchymal; NL, neural; PN, proneural; all, all 840 subtype genes; coverage, percent of gene set that exist in gene expression profiles
