

Abstract
Cortical surface templates are an important standardized coordinate frame for cortical structure and function analysis in magnetic resonance (MR) imaging studies. The widely used adult cortical surface templates (e.g., fsaverage, Conte69, and the HCP‐MMP atlas) are based on the Caucasian population. Neuroanatomical differences related to environmental and genetic factors between Chinese and Caucasian populations make these templates unideal for analysis of the cortex in the Chinese population. We used a multimodal surface matching algorithm in an iterative procedure to create Chinese (sCN200) and Caucasian (sUS200) cortical surface atlases based on 200 demographically matched high‐quality T1‐ and T2‐weighted (T1w and T2w, respectively) MR images from the Chinese Human Connectome Project (CHCP) and the Human Connectome Project (HCP), respectively. Templates for anatomical cortical surfaces (white matter, pial, midthickness) and cortical feature maps of sulcal depth, curvature, thickness, T1w/T2w myelin, and cortical labels were generated. Using independent subsets from the CHCP and the HCP, we quantified the accuracy of cortical registration when using population‐matched and mismatched atlases. The performance of the cortical registration and accuracy of curvature alignment when using population‐matched atlases was significantly improved, thereby demonstrating the importance of using the sCN200 cortical surface atlas for Chinese adult population studies. Finally, we analyzed female and male cortical differences within the Chinese and Caucasian populations. We identified significant between‐sex differences in cortical curvature, sulcal depth, thickness, and T1w/T2w myelin maps in the frontal, temporal, parietal, occipital, and insular lobes as well as the cingulate cortices.
Keywords: CHCP, Chinese adult, cortical surface templates, HCP, MRI, MSM
1. INTRODUCTION
Advances in magnetic resonance imaging (MRI) technologies have significantly improved our understanding of the structure and function of the human brain in vivo. In a typical group‐level MRI analysis, spatial normalization is usually an indispensable preprocessing step used to reduce intersubject anatomical variability (Fischl, Sereno, Tootell, & Dale, 1999; Friston et al., 1995; Van Essen, 2005). Thus, a brain template, or an atlas, is required as a reference to provide a standard anatomical stereotactic coordinate space.
There are currently two major types of standard brain templates: Volumetric and surface templates. Volumetric templates of different populations, namely, Chinese and Caucasian, were constructed, and the differences between them were well studied (Evans, Janke, Collins, & Baillet, 2012; Lancaster et al., 2007; Luo et al., 2014; Richards, Sanchez, Phillips‐Meek, & Xie, 2016; Shi et al., 2017; Tang et al., 2010; Zhao et al., 2019). Furthermore, previous studies have shown that adopting a population‐matched volumetric brain template can reduce the variability of spatial deformation during image registration and help retain more characteristics of an individual brain (Xie, Richards, Lei, Lee, & Gong, 2015; Yang et al., 2020; Yoon, Fonov, Perusse, Evans, & the Brain Development Cooperative, 2009). Indeed, several previous studies on the cross‐cultural analysis of brain mapping have illustrated significant differences in brain functions across populations (Ge et al., 2015; Jacob et al., 2019; Zhang et al., 2017). However, these studies analyzed Asian participants based on the Caucasian brain template, inducing registration bias. Thus, to reduce this bias, population‐matched volumetric templates have been proposed and constructed (Tang et al., 2010; Yang et al., 2020; Zhao et al., 2019).
Compared with traditional volumetric analysis, surface‐based analysis using features of cortical areas improves the registration of areas and helps in obtaining complex functional activation patterns as reported in numerous fMRI studies that have included a wide variety of behavioral tasks and analysis paradigms (Coalson, Van Essen, & Glasser, 2018; Glasser et al., 2016). Ghosh et al. (2010) found that surface‐based registration provided significantly better alignment of cortical landmarks than volume‐based registration. Furthermore, in a cortical morphometric analysis of population brain geometry, Fan et al. (2015) reported that the geometry of the brain cortical surface contains rich information about ancestry and further characterizes variable regional patterns in the cortical folding and gyrification of the human brain associated with different ancestral lineages. This finding indicates that genetic and environmental factors induce different surface geometry features in different populations. However, existing adult cortical surface atlases are mostly based on the Caucasian population (Lyttelton, Boucher, Robbins, & Evans, 2007; Van Essen, 2005). Chinese adult cortical surface templates are not available, and the effect of different populations on cortical surface templates remains unclear. Here, we hypothesize and show that population‐matched cortical surface templates more reliably represent the individual brain, that is, the Chinese cortical surface template more accurately represents the brains of the Chinese population.
Differences in morphology are present not only within populations but also between males and females (Ritchie et al., 2018). However, most studies that have investigated differences between male and female brains used Caucasian datasets (Lotze et al., 2019; Ritchie et al., 2018; Szalkai, Varga, & Grolmusz, 2019; Xin, Zhang, Tang, & Yang, 2019). Lv et al. (2010) analyzed differences between males and females in the Chinese population, but they focused only on cortical thickness. To the best of our knowledge, there has been no thorough analysis of male versus female differences of other cortical features within the Chinese population.
This study contributes to two main findings. First, we are the first to construct a population‐specific cortical surface atlas for the Chinese population and evaluate the effect of population differences in cortical surface registration. Second, we performed a thorough analysis of male and female differences in cortical features for the Chinese and Caucasian populations.
In the first part of this study, we constructed a Chinese cortical surface atlas (sCN200) and a Caucasian cortical surface atlas (sUS200) based on 200 MR images from the Chinese Human Connectome Project (CHCP) and 200 MR images from the Human Connectome Project (HCP), respectively. These two datasets were age‐, sex‐ and sample size‐matched. We built the atlases using an unbiased cortical surface template construction algorithm. The algorithm is based on a multimodal surface matching (MSM) algorithm (Robinson et al., 2014; Robinson et al., 2018) that employs an iterative procedure for atlas refinement (Bozek et al., 2018). The sCN200 and sUS200 atlases include averaged anatomical cortical surfaces (white matter, pial, and mid thickness surface) and surface features (sulcal depth, curvature, T1w/T2w myelin, thickness, and cortical labels). The sex‐specific templates were also constructed using the CHCP and HCP datasets, resulting in Chinese female (sCN100 (F)) and male (sCN100 (M)) templates and Caucasian female (sUS100 (F)) and male (sUS100 (M)) templates. The atlases were analyzed in terms of registration accuracy when using population‐matched or population‐mismatched templates. This analysis was performed according to the strength of areal distortion indexes and curvature map alignment when using the sCN200 and sUS200 cortical surface atlases.
In the second part of our study, we analyzed and compared morphological differences in terms of the spread across subjects between females and males for the CHCP dataset, that is, the Chinese population, and for the HCP dataset, that is, the Caucasian population.
2. MATERIALS AND METHODS
2.1. Participants and image acquisition
Both the CHCP and HCP datasets were used in this study. The CHCP dataset included 250 (121 females, aged 19–37 years, mean ± SD: 21.5 ± 2.4 years) native Chinese healthy participants; all were right‐handed, and none of the participants reported a history of psychiatric or neurological disorders. All participants provided written informed consent, and the study was approved by the Institutional Review Board of Peking University. The dataset was collected through the Chinese Human Connectome Project, which aims to build a public research database with a focus on studies of connections within the Chinese brain. MRI data were acquired using a 3 T Siemens Prisma scanner. T1w images were acquired using a 3D MPRAGE sequence with 0.8 mm isotropic resolution (TR = 2.4 s, TI = 1 s, TE = 2.22 ms, flip angle = 8°, 224 axial slices, FOV = 256 × 256 mm, and data matrix = 320 × 320). T2w images were acquired using the Siemens SPACE sequence (Mugler et al., 2000) with 0.8 mm isotropic resolution with the same matrix, FOV, and number of slices as used for the T1w images, TR = 3.2 s, and TE = 563 ms.
The HCP dataset used in this study consisted of 250 Caucasian participants (125 females, aged 22–35 years, mean ± SD: 22.8 ± 3.2 years) from the HCP S1200, which is publicly available from the Human Connectome Project (Van Essen et al., 2013). The local institutional review board at Washington University approved the protocol, and all participants provided written informed consent. MR images from each participant were acquired using a Siemens 3 T Connectome Skyra scanner. T1w images were acquired with a 3D MPRAGE sequence with 0.7 mm isotropic resolution (TR = 2.4 s, TI = 1 s, TE = 2.14 ms, flip angle = 8°, FOV = 224 × 224 mm, data matrix = 320 × 320, slices = 256). T2w images were acquired using the Siemens SPACE sequence with 0.7 mm isotropic resolution with the same number of slices, matrix, and FOV as used for the T1w images, TR = 3.2 ms and TE = 565 ms. The HCP is a multiethnic study with a large number of 800 participants. However, it is important to note that we controlled for ethnicity and selected only the Caucasian population.
In the present study, we used two subsets from each dataset: A subset with 200 cases for constructing an atlas and analyzing differences between males and females and a subset with 50 cases for testing the registration accuracy. The subsets were matched in terms of age and sex. Specifically, for constructing the Chinese adult cortical surface atlas, we used 200 subjects from the CHCP dataset. Then, we selected 200 Caucasian subjects that could be considered representative of the Caucasian population from the HCP dataset for the construction of the Caucasian adult cortical surface atlas. Finally, we used the remaining 50 subjects (25 males and 25 females), which were not included in the cortical surface atlas construction, from both the CHCP and HCP datasets as independent test sets for further investigating the influence of different population atlases.
2.2. Data preprocessing
For both the CHCP and HCP datasets, the “minimal preprocessing pipelines” (Glasser et al., 2013) were used to preprocess all MR images. This pipeline generates spherical, midthickness, white matter, pial, inflated, and very inflated surfaces, as well as feature maps describing sulcal depth, cortical thickness, mean curvature, cortical T1w/T2w myelin, and cortical labels. Specifically, preprocessing was performed using the following steps: (a) The intensity inhomogeneity in each scan was corrected using bias field correction (Glasser & Van Essen, 2011; Rilling, Glasser, Jbabdi, Andersson, & Preuss, 2011). (b) Brain extraction was performed based on an initial linear (FLIRT) and nonlinear (FNIRT) registration deformation field, which were warped from the individual space to the ICBM152 template. This deformation field is then inverted and used for bringing the template brain mask back into the native space, thereby resulting in an individual brain mask, which was used to remove the skull. (c) The FreeSurfer version 5.3 recon‐all command was used to reconstruct the cortical surface. It is important to note that the pipeline introduces several in‐between steps and stops the recon‐all algorithm to correct the white and gray matter surfaces using both high‐resolution T1w and T2w images. (d) All cortical surfaces were prealigned through the estimation of a rigid transformation between the T1w native space and the Montreal Neurological Institute (MNI) space to ensure that the cortical surfaces of all subjects had the same orientation. (e) For each subject's surface, a rotation between the MNI space and the adult Conte69 template was estimated and applied (Glasser & Van Essen, 2011; Van Essen, Glasser, Dierker, Harwell, & Coalson, 2012). This step is similar to the approach in Van Essen et al. (2012), where a rotation was estimated from the “fsaverage” space to the Conte69 space for initial alignment.
2.3. Template construction
Templates were constructed using an unbiased surface template construction framework proposed by Bozek et al. (2018) based on the MSM registration algorithm (Robinson et al., 2014; Robinson et al., 2018; available from https://github.com/ecr05/MSM_HOCR ) and through multiple iterations. Briefly, as Figure 1a shows, the preprocessed surfaces of each individual subject were initialized through affine spherical alignment to the Conte69 template (Van Essen et al., 2012). This matching was performed based on sulcal depth maps, which reflect coarse‐scale anatomical folding patterns. Sulcal depth reflects the integrated distance each vertex moves during the inflation process and is particularly useful for measuring cortical shape because it provides information on the continuous changes in coarse shape attributes (Fischl, Sereno, & Dale, 1999; Van Essen, 2004).
Figure 1.
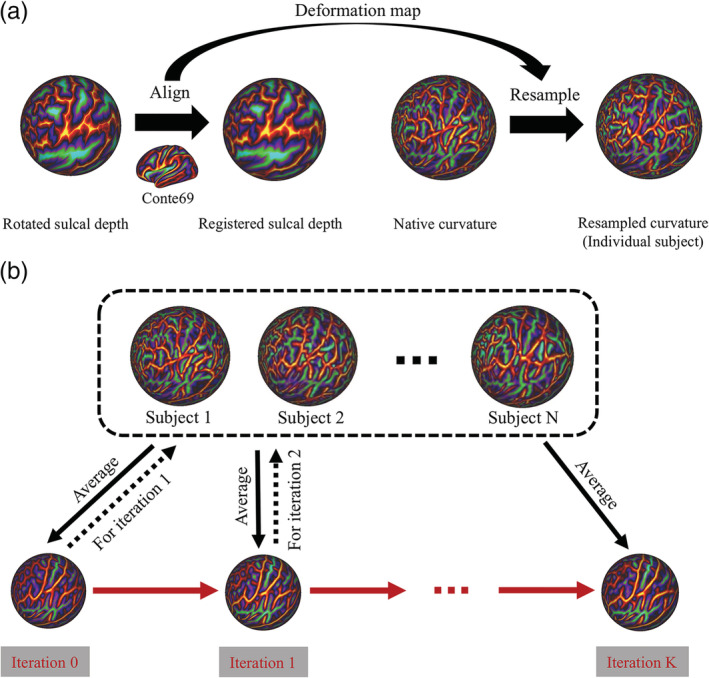
Flowchart of the unbiased surface template construction framework. After data preprocessing, the resulting data were used as inputs into this framework to construct a template. (a) For each individual subject, rotated sulcal depth maps were affinely aligned to the Conte 69 template to generate registered individual sulcal depth maps. Then, individual native curvature maps were resampled using the deformation map generated during sulcal depth map alignment, which resulted in individual resampled curvature maps. (b) Individual resampled curvature features were averaged across all subjects to generate the initial curvature template (Iteration 0). This was used as a reference feature for registering individual spherical meshes to the template spherical mesh via direct nonrigid MSM spherical alignment in the next iteration. The iterations were stopped when the variation of curvature feature templates converged. The final iteration result was the cortical curvature template
A finer pattern of cortical folding is represented by curvature features, which were used to drive the registration and to obtain a refined template. Using the correspondence learned from sulcal depth alignment, individual subject's curvature features were resampled onto the Conte69 template sphere mesh based on a barycentric interpolation algorithm. These individual resampled curvature features were averaged across all subjects to generate the initial curvature template. Then, the template was refined via direct nonrigid MSM alignment of all subject spheres to the averaged template over several iterations (Figure 1b). At each iteration, averaged curvature features obtained from previous iterations were used as the target features for registering individual spherical meshes to the template spherical mesh. The iterations were stopped when the variation of the curvature feature template converged.
Then, the corresponding transformation, which was learned during spherical alignment of the curvature mapping in the final iteration, was used to warp individual subject surfaces and average them across all subjects to generate white matter, pial, and midthickness cortical templates. Similarly, individual feature maps (sulcal depth, T1w/T2w myelin maps, and thickness) were also resampled using a barycentric interpolation algorithm to the template spherical mesh based on the correspondences learned from curvature alignment in the final iteration. These resampled feature maps were averaged across all subjects to generate their population average templates. Finally, the bias induced by the Conte69 reference was eliminated by removing mean scaling from the final template. For more detailed information, please refer to Bozek et al. (2018).
We generated a set of Chinese and Caucasian atlases based on the CHCP dataset and HCP dataset, respectively: (a) anatomical cortical surface atlases for the white mater, pial, and midthickness surfaces; (b) feature templates for the mean curvature, sulcal depth maps, cortical thickness and T1w/T2w myelin maps; and (c) sex‐specific cortical surface and feature templates.
2.4. Construction of cortical labels for Chinese and Caucasian templates
Cortical labels for sCN200 and sUS200 templates were also constructed. Briefly, for each individual subject from the CHCP and HCP datasets, 35 (DK atlas) and 75 (Destrieux atlas; Destrieux, Fischl, Dale, & Halgren, 2010) structures in each hemisphere were automatically segmented using FreeSurfer. Then, individual label feature maps were resampled onto the template mesh using the corresponding transformation learned through the curvature‐defined mapping. We calculated probabilistic maps representing the overlap of these labels across the subjects by averaging all resampled label feature maps. Then, a maximum probability map across all subjects was created by assigning each vertex to the most likely labels at this position. Finally, we generated the population averaged cortical label templates, namely, the sCN200 DK, sCN200 Destrieux, sUS200 DK, and sUS200 Destrieux atlases.
2.5. Cortical surface registration to the Chinese and Caucasian templates
We used the CHCP and HCP test sets to investigate the image registration performance by employing population‐matched brain templates (i.e., registration of subjects from the CHCP test set to the sCN200 surface template, and registration of subjects from the HCP test set to the sUS200 surface template) and population‐mismatched brain templates (i.e., registration of subjects from the CHCP test set to the sUS200 surface template, and registration of subjects from the HCP test set to the sCN200 surface template).
First, to rule out the effect of global scaling, initialization of the CHCP and HCP test sets was performed through affine registration to the sCN200 and sUS200 brain templates (Zilles, Kawashima, Dabringhaus, Fukuda, & Schormann, 2001). Following this, nonrigid MSM registration of the subjects to templates was driven using mean curvature features. Then, to evaluate the influence of the population‐matched and population‐mismatched surface template registration, an areal distortion map was computed for each subject. Areal distortion is defined as log2(Area1/Area2), where Area1 and Area2 are the areas of the registered spherical surface tile and the original spherical surface tile (Bozek et al., 2018). An absolute areal distortion value of zero would be obtained when the source is the same as the target (e.g., a surface registered to itself). The absolute areal distortion is an index that reflects the strength of the distortion during the alignment between the individual subject surface and the template, and it estimates the biological plausibility of deformations. Although the exact values of allowed distortions remain an open question, it is considered that distortion less than fourfold expansion of compression is within a biologically plausible range (Van Essen, 2005). For each individual, we expect that the usage of the population‐matched templates will reduce areal distortion during image registration. A paired t‐test was performed to detect the statistical significance of the global absolute areal distortion values when using population‐matched and population‐mismatched templates.
Furthermore, we examined the regional distributions of absolute areal distortion maps. Specifically, based on the seven resting‐state networks atlas from Yeo et al. (2011), we performed a comparison of absolute areal distortion maps in each network between registrations to population‐matched and population‐mismatched templates. The seven resting‐state networks atlas is a cortical label feature map on the fsaverage surface mesh. We used a nonrigid MSM algorithm to register the fsaverage template to the sCN200 and sUS200 templates. After obtaining the correspondences between the fsaverage template and the sCN200 and sUS200 templates, the seven resting‐state networks atlas was resampled using a barycentric interpolation algorithm onto sCN200 and sUS200 templates. Then, each template's spherical mesh was nonrigidly aligned to each individual subject's spherical mesh using the MSM algorithm driven by curvature features. This learned correspondence between the template and the subject was applied to the seven‐network atlas, which was resampled on the individual subject's surface using barycentric interpolation, to obtain an adjusted individual brain network. For each adjusted brain network, we calculated the mean absolute areal distortion value in each individual and performed a paired t‐test between the CHCP and HCP test sets. Multiple comparisons were taken into account for the brain regions using false discovery rate (FDR) correction at a 0.05 level of significance (Genovese, Lazar, & Nichols, 2002).
2.6. Evaluation of the template effects (sCN200 vs. sUS200) on the accuracy of curvature map alignment
We further evaluated the effect of using different population templates, that is, using population matched versus population mismatched templates, through the accuracy of curvature map alignment. Curvature maps represent the amount of cortical folding with positive values at gyral crowns and negative values at sulcal fundi (Pantazis et al., 2010). Using nonrigid MSM registration, driven using mean curvature features, we registered individuals from the CHCP and HCP test sets to the population matched and mismatched surface templates. Then, the accuracy of the curvature map alignment was calculated as the overlap of the individual registered curvature maps with the curvature map of the corresponding template (generated in section 2.3). Specifically, we thresholded the registered individual curvature maps and template curvature maps by assigning a value of one to curvature values less than zero and assigning a value of zero to curvature values greater than zero, thereby creating binarized sulci maps for calculating alignment accuracy. In this evaluation, we expected that the usage of the population‐matched templates would result in better alignment of the curvature because they primarily represent the folding patterns of the test set population, although the test sets were not used for building the templates. We used the Dice coefficient (Dice, 1945) to reflect the strength of overlap to quantify the accuracy of alignment between template curvature maps and individual registered curvature maps based on the binarized sulci maps. A Dice coefficient near 1 indicates more accurate registration. A paired t‐test was performed on the Dice coefficients to investigate whether using the population‐matched atlas could significantly improve the accuracy of the cortical curvature map alignment compared with the population‐mismatched atlas.
To investigate the template effect on the curvature map alignment accuracy for specific brain cortical regions, we examined the regional distributions of the t statistic for the Dice coefficient and compared population‐matched and mismatched template effects on the curvature map alignment accuracy for the CHCP and HCP test sets. Specifically, based on the sCN200 DK and sUS200 DK atlases (constructed in section 2.4), we performed a comparison of Dice coefficient maps in each brain region between registrations to population‐matched and population‐mismatched templates. For each brain, we calculated the mean Dice coefficient value in each individual and performed a paired t‐test for the CHCP and HCP test sets. Multiple comparisons were taken into account for the brain regions using FDR correction at a 0.05 significance level (Genovese et al., 2002).
2.7. Evaluation of regional anatomical male and female differences within Chinese and Caucasian cohorts
We performed anatomical comparisons between male and female subjects from Chinese and Caucasian cohorts (100 Chinese females and 100 Chinese males, and 100 Caucasian females and 100 Caucasian males used for creating the atlases) in terms of the spread of the average feature values across subjects within each cortical region for DK atlases (Desikan et al., 2006). In each subject, the mean value of the features within each cortical region was averaged from individual feature maps obtained from HCP “minimal preprocessing pipelines” for both the Chinese and Caucasian cohorts. The features included mean curvature, sulcal depth, thickness and T1w/T2w myelin maps. Since the mean curvature and sulcal depth maps contain both positive and negative values, we averaged the absolute values. The age and brain size were regressed out using ordinary least‐squares regression (i.e., a general linear model, GLM). The brain size was calculated using the intracranial volume, which added the total volume of GM, WM and CSF from the segmented images (Im et al., 2008). Next, a statistical comparison between the females and males for the CHCP and HCP cohorts was conducted for each region in the feature map using a two‐sample t‐test with the FDR correction at a 0.05 significance level (Genovese et al., 2002).
3. RESULTS
3.1. Convergence of the template construction algorithm in the Chinese and Caucasian adult atlases
Figure 2a shows curvature templates from several iteration steps and their vertexwise absolute difference in adjacent iterations for the sCN200 atlas construction. Figure 2b shows that around the 15‐th iteration, the global curvature difference converged and reached a plateau. Similar characteristics of convergence processes were found for both the CHCP and HCP cohorts.
Figure 2.
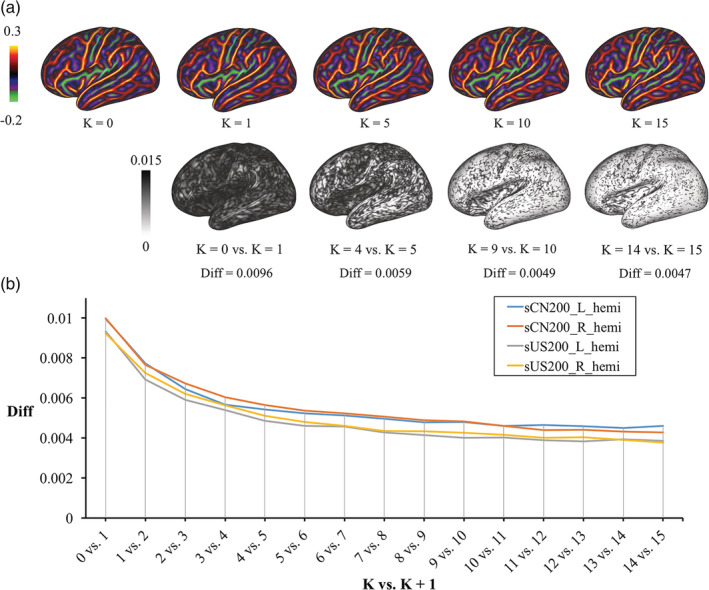
(a) Initial (K = 0) curvature template for the sCN200 template and curvature templates after different numbers of iterations (K = 1, 5, 10, and 15; top row), and a map of the absolute vertexwise difference in curvature templates between subsequent iterations K and K + 1 (bottom row), where Diff is the mean of the absolute vertexwise difference across the map (left hemisphere, projected on the very inflated sCN200 template). (b) Plot of Diff for the sCN200 and sUS200 templates for each hemisphere against K versus K + 1
3.2. Cortical surface atlases for Chinese and Caucasian adults
We generated anatomical cortical surface atlases for the white matter, pial and midthickness surfaces for sCN200 and sUS200 (shown in Figure 3 with Cartesian axes overlaid in a 1 cm grid). Visual inspection indicated that the sCN200 cortical surface templates were shorter in length and slightly greater in height than the sUS200 cortical surface templates. Furthermore, minor differences in the morphological structures of the brain sulci and gyri are noticeable between these two cortical surface atlases. Additionally, Figures 4 and 5 show sex‐specific cortical surface atlases for the Chinese and Caucasian populations, including sCN100 (F), sCN100 (M), sUS100 (F), and sUS100 (M). Final feature templates for the sulcal depth maps, curvature, T1w/T2w myelin maps and cortical thickness for sCN200 and sUS200 are shown in Figure 6. Chinese and Caucasian sex‐specific feature templates are shown in Figures 7 and 8. Finally, Figure 9 shows the constructed label atlases, including the sCN200 DK, sCN200 Destrieux, sUS200 DK, and sUS200 Destrieux atlases.
Figure 3.
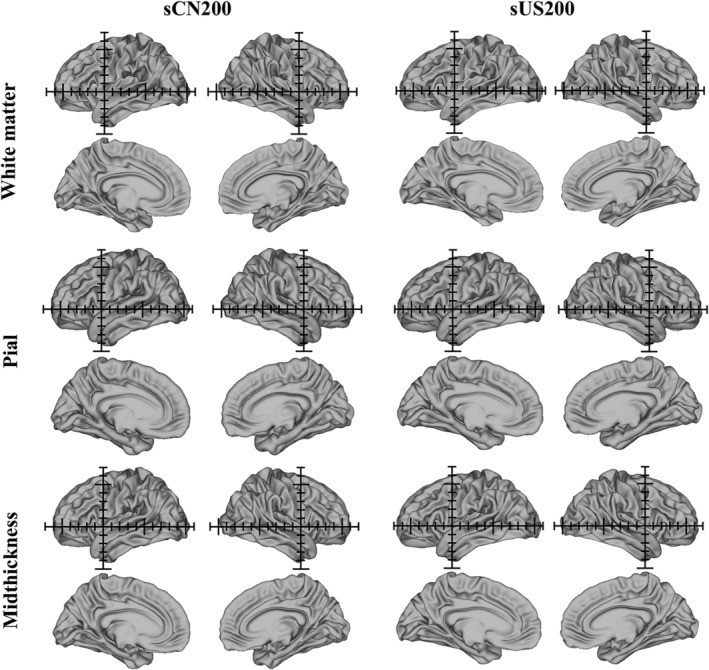
Chinese (sCN200) and Caucasian (sUS200) anatomical cortical surface atlases, including white matter, pial and midthickness surface atlases (left and right hemispheres, lateral and medial views). The axes (1 cm grid) in the sCN200 and sUS200 templates are centered on the origin (anterior commissure)
Figure 4.
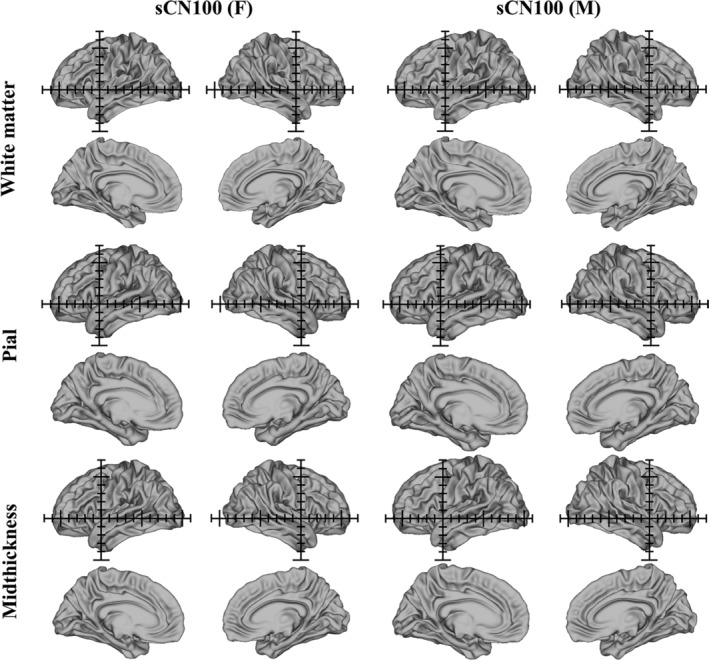
Chinese female (sCN100 (F)) and male (sCN100 (M)) anatomical cortical surface atlases, including white matter, pial and midthickness surface atlases (left and right hemispheres, lateral and medial views). The axes (1 cm grid) in the sCN100 (F) and sCN100 (M) templates are centered on the origin (anterior commissure)
Figure 5.
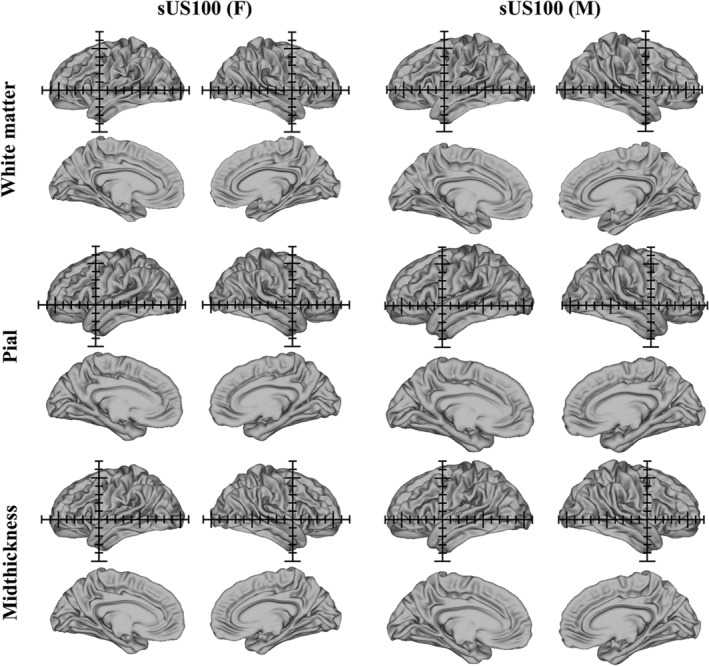
Caucasian female (sUS100 (F)) and male (sCN100 (M)) anatomical cortical surface atlases, including white matter, pial and midthickness surface atlases (left and right hemispheres, lateral and medial views). The axes (1 cm grid) in the sUS100 (F) and sUS100 (M) templates are centered on the origin (anterior commissure)
Figure 6.
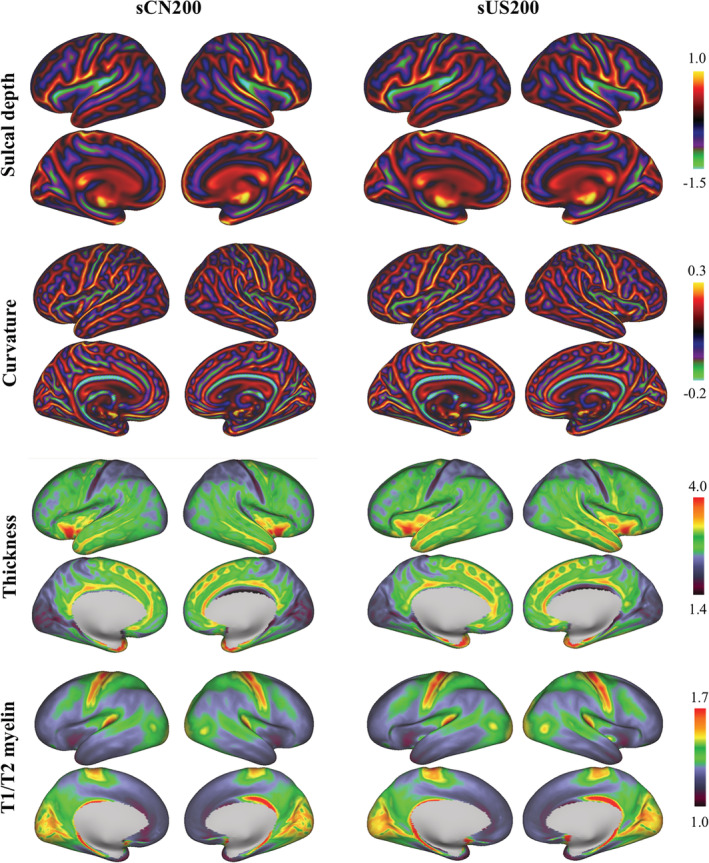
Chinese (sCN200) and Caucasian (sUS200) cortical surface feature atlases, including sulcal depth, curvature, thickness and T1w/T2w myelin maps (left and right hemispheres, lateral and medial views; data projected on a very inflated surface)
Figure 7.
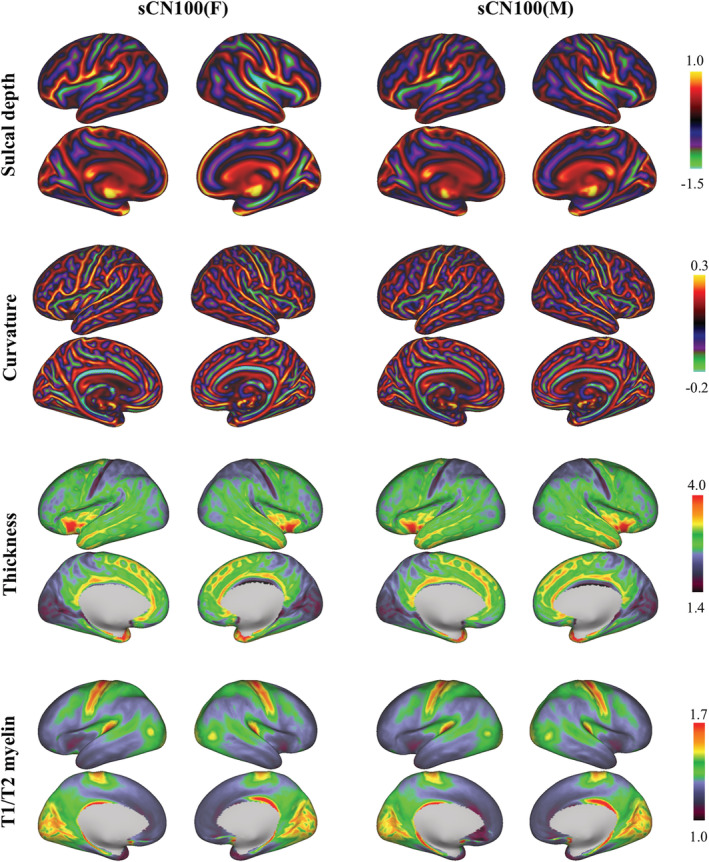
Chinese female (sCN100 (F)) and male (sCN100 (M)) cortical surface feature atlases, including sulcal depth, curvature, thickness, and T1w/T2w myelin maps (left and right hemispheres, lateral and medial views; data projected on a very inflated surface)
Figure 8.
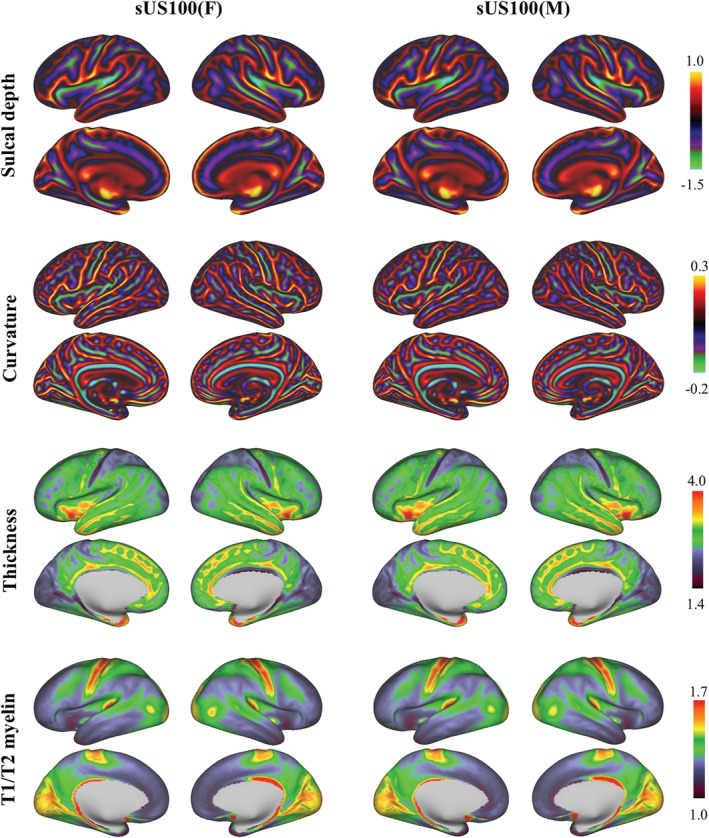
Caucasian female (sUS100 (F)) and male (sUS100 (M)) cortical surface feature atlases, including sulcal depth, curvature, thickness, and T1w/T2w myelin maps (left and right hemispheres, lateral and medial views; data projected on a very inflated surface)
Figure 9.

The labeled atlases include the sCN200 DK, sCN200 Destrieux, sUS200 DK, and sUS200 Destrieux atlases
3.3. Population‐matched templates produce lower absolute areal distortion
Figure 10a shows the average absolute areal distortion mapped onto the very inflated surfaces, including the averaged absolute areal distortion maps obtained through the registration of subjects from the CHCP test set to the sCN200 template, from the CHCP test set to the sUS200 template, from the HCP test set to the sUS200 template, and from the HCP test set to the sCN200 template. Figure 10b shows violin plots of the global mean absolute areal distortion. The nonrigid MSM registration using the population‐matched brain template induced smaller absolute areal distortion, that is, the population‐matched template induces lower biological deformations of the cortical folding of the individuals registered to it and may suggest a more accurate registration. As demonstrated by paired t‐tests, for both the CHCP and HCP test sets, significant differences were observed between the population‐matched and population‐mismatched brain templates (all p values <.001).
Figure 10.
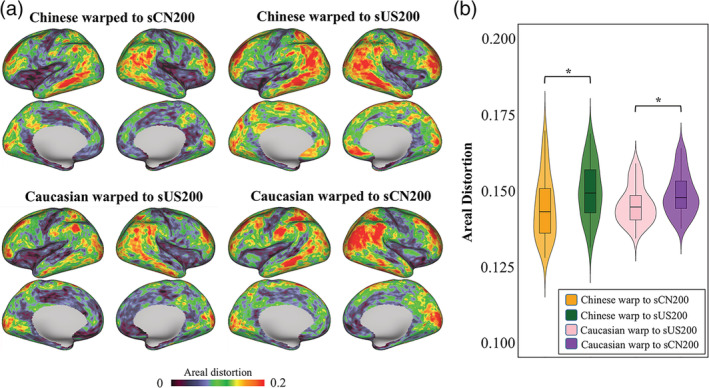
Absolute areal distortion maps were obtained following registration of the test sets from the CHCP and HCP datasets to the sCN200 and sUS200 cortical surface templates. (a) The averaged absolute areal distortion maps for the CHCP (top) and HCP (bottom) test sets after registering to the sCN200 and sUS200 templates (projected on very inflated surfaces). (b) Violin plots of the global mean absolute areal distortion. (*p < .001)
Furthermore, Figure 11 shows the regional distribution of the absolute areal distortion maps resulting from the registration of the CHCP and HCP test sets to the sCN200 and sUS200 templates. The absolute areal distortion values were averaged across regions defined by seven resting‐state networks. Figure 11a,b show the spatially distributed regional t‐map and bar plots of the CHCP test set, demonstrating that regions that exhibit the highest level of absolute areal distortion include the somatomotor, limbic and default networks (FDR corrected p < .05, t > 2.2, and t < −2.2). Similarly, Figure 11c,d show the regional t‐map and bar plots of the HCP test set, illustrating that the regions with the highest level of absolute areal distortion include the somatomotor, frontoparietal and default networks (FDR corrected p < .05, t > 2.2, and t < −2.2).
Figure 11.
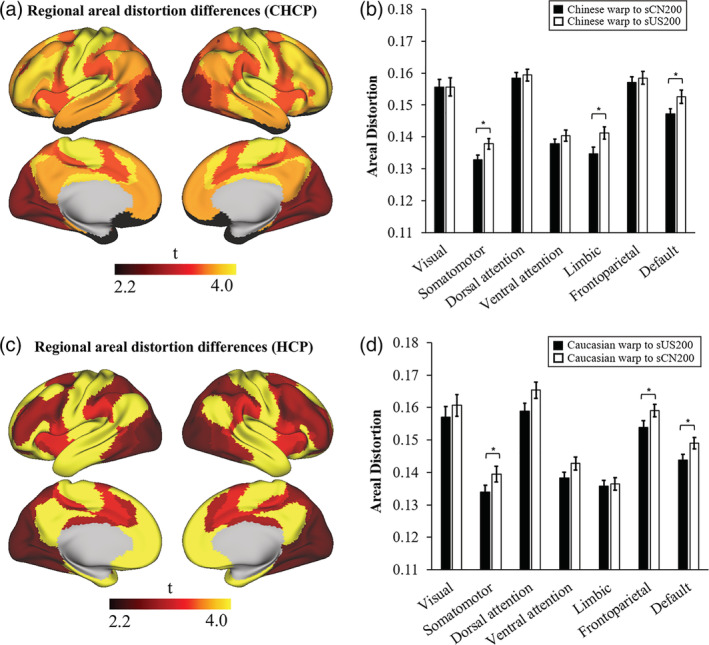
Absolute areal distortion maps of the CHCP and HCP test sets were compared when registering to population‐matched and population‐mismatched brain templates using two‐sample t‐tests in seven resting‐state networks. (a) The t‐map of regional areal distortion differences for the CHCP test set and (b) bar plots of the group average areal distortion in each resting‐state network in the CHCP test set. (c) The t‐map of regional areal distortion differences for the HCP test set and (d) bar plots of the group average areal distortion in each resting‐state network in the HCP test set. (*p < .001)
3.4. Population‐matched templates improve curvature maps alignment accuracy
Figure 12a shows the accuracy of the curvature map alignment between the proposed sCN200 and sUS200 feature templates evaluated using two independent test sets. For both the CHCP and HCP test sets, the regional distributions of the t statistic for the Dice coefficient show that using the population‐matched template improved the curvature alignment in most brain regions (73% DK regions for the CHCP test set, 71% DK regions for the HCP test set, FDR corrected p < .05, t > 3, and t < −3). Figure 12b shows bar plots that demonstrate a significantly higher Dice coefficient for use of the population‐matched atlases than for use of the population‐mismatched atlases for the curvature alignment of both the CHCP and HCP test sets (t test, p < .001).
Figure 12.
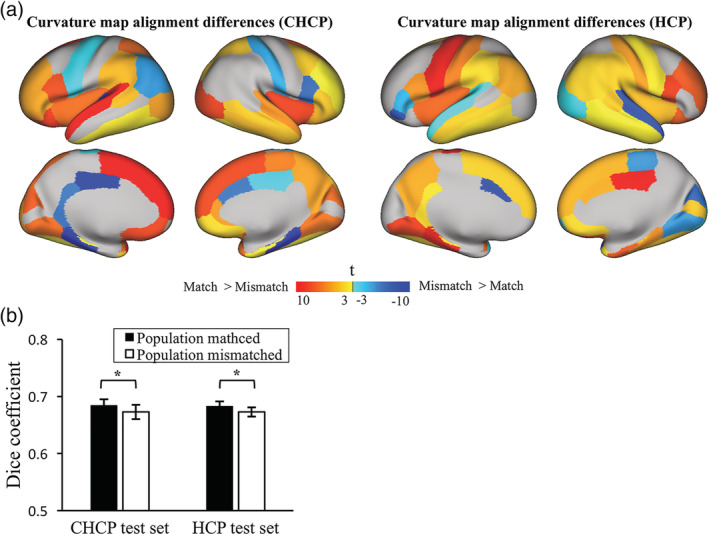
Accuracy of the curvature map alignment for two independent samples (CHCP and HCP test sets) after their registration to the sCN200 and sUS200 feature templates. (a) Regional distributions of the t statistic for the Dice coefficient, which measures the effect of population‐matched and population‐mismatched templates based on the curvature map overlap accuracy for the CHCP and HCP test sets. (b) Bar plots for the Dice coefficient of the curvature map overlap accuracy averaged over the whole brain when using population‐matched atlases and population‐mismatched atlases. (*p < .001)
3.5. Regional anatomical differences between females and males in the Chinese and Caucasian cohorts
We performed a regional anatomical comparison between the female and male subjects and computed, within each cortical region, the average values of curvature maps, sulcal depth maps, cortical thickness and T1w/T2w myelin maps for Chinese and Caucasian cohorts that were used for building sCN200 and sUS200 atlases, respectively. All t values were corrected using the FDR procedure at the specific p < .05.
3.5.1. Female versus male differences in the Chinese cohort
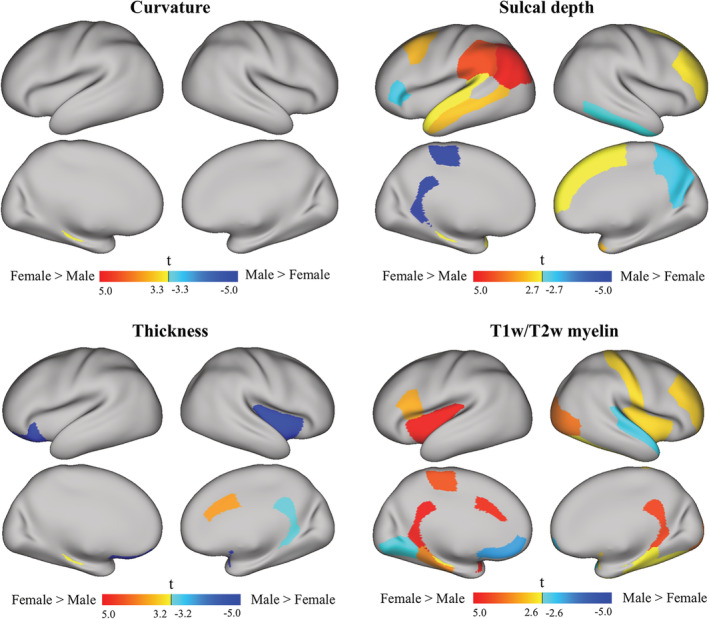
The mean curvature between the females and males in the Chinese cohort showed almost no differences, as shown in Figure 13 (top left, FDR corrected p < .05, t > 3.7, and t < −3.7). The only observed difference was larger left rostral anterior cingulate in females than in males.
Figure 13.
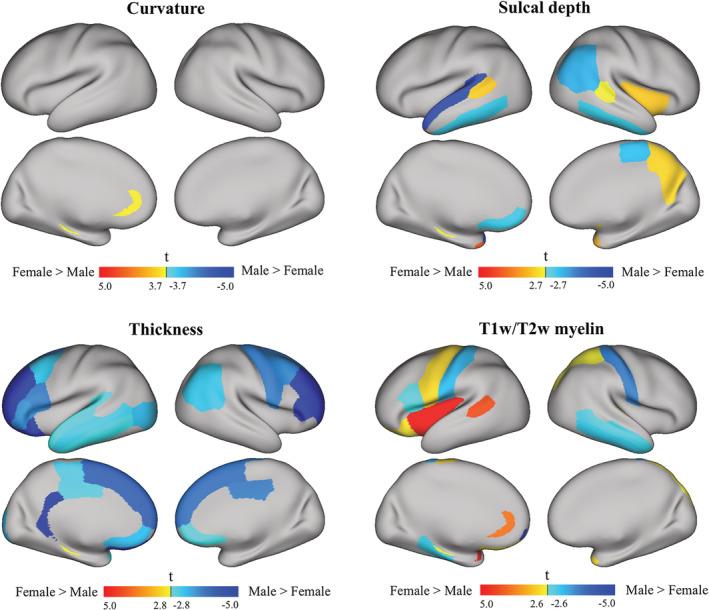
t‐maps of the cortical regions of interest based on the DK atlas in each hemisphere for the Chinese cohort. The mean values of the features (curvature, sulcal depth, thickness and T1w/T2w myelin map) were calculated within each cortical region for each subject. A paired t‐test was performed in each region to detect the differences between females and males with FDR correction at a 0.05 significance level (greater t values and warmer colors indicate larger feature values for females than males; smaller t values and cooler colors indicate smaller feature values for females than males)
The sulcal depth differences between the females and males are shown in Figure 13 (top right, FDR corrected p < .05, t > 2.7, and t < −2.7). Females showed larger sulcal depth in the bilateral superior temporal sulcus, the right insula and the right precuneus cortex. Males showed a larger sulcal depth in the bilateral inferior temporal gyri, the right inferior parietal gyrus, and the right medial orbito‐frontal gyrus.
The significant regional differences in cortical thickness between females and males are shown in Figure 13 (bottom left, FDR corrected p < .05, t > 2.8, and t < −2.8). The most significant cortical thickening in males appeared extensively in the bilateral frontal, left temporal and right parietal lobes. Females did not exhibit thicker cortical regions than males across the whole brain.
The regional differences in the T1w/T2w myelin maps are shown in Figure 13 (bottom right, FDR corrected p < .05, t > 2.6, and t < −2.6). We observed a significantly larger myelin map in females in the left insula, the left superior temporal sulcus, the left precentral gyrus and the right superior parietal. Males showed a larger T1w/T2w myelin map in the bilateral postcentral gyri, the right inferior temporal, and the left pars opercularis.
3.5.2. Female versus male differences in the Caucasian cohort
In the Caucasian cohort, there were no significant differences between females and males in the mean curvature maps, as shown in Figure 14 (top left, FDR corrected p < .05, t > 3.3, and t < −3.3).
Figure 14.
t‐maps of the cortical regions of interest based on the DK atlas in each hemisphere for the Caucasian cohort. The mean values of the features (curvature, sulcal depth, thickness, and T1w/T2w myelin map) were calculated within each cortical region for each subject. A paired t‐test was performed in each region to detect the differences between females and males with FDR correction at a 0.05 significance level (greater t values and warmer colors indicate larger feature values for females than males; smaller t values and cooler colors indicate smaller feature values for females than males)
The significant differences in sulcal depth between females and males are shown in Figure 14 (top right, FDR corrected p < 0.05, t > 2.7, and t < −2.7). Females have significantly larger sulcal depth in the left parietal lobe, the left superior temporal gyri, the left rostral middle frontal gyri, and the right superior frontal gyri. Males showed larger sulcal depth in the right inferior temporal gyri, the right precuneus and the right pars triangularis.
The cortical thickness difference between females and males is shown in Figure 14 (bottom left, FDR corrected p < .05, t > 3.2, and t < −3.2). Females showed thicker cortex at the right caudal anterior cingulate. Males showed thicker cortex at the right insula, the right isthmus cingulate cortex, and the left lateral orbitofrontal gyri.
Finally, the significant differences in the T1w/T2w myelin map between females and males are shown in Figure 14 (bottom right, FDR corrected p < .05, t > 2.6, and t < −2.6). Females showed a greater amount of myelin in the bilateral insula, the right postcentral gyrus, the right rostral middle frontal gyrus, the right lateral occipital gyrus, and the left pars‐opercularis. Males showed a greater amount of myelin in the right superior temporal gyrus, the left lingual gyrus, and the left medial orbitofrontal gyrus.
4. DISCUSSION
In the present study, we constructed a Chinese cortical surface atlas (sCN200) and a Caucasian cortical surface atlas (sUS200) using large samples of 200 MR images from the CHCP dataset and 200 MR images from the HCP dataset, respectively. The sCN200 and sUS200 atlases included anatomical cortical atlases of the white matter, pial and midthickness surface, surface feature atlases of sulcal depth, curvature, T1w/T2w myelin and thickness, and cortical labels. We also constructed sex‐specific brain templates for both Chinese and Caucasian cohorts. Our results showed that using the proposed Chinese adult sCN200 atlas for registering Chinese subjects from the CHCP test set significantly improved the performance of the brain cortical registration and the accuracy of the curvature alignment compared with the usage of a population mismatched Caucasian sUS200 atlas. Finally, direct comparisons of cortical curvature, sulcal depth, cortical thickness, and T1w/T2w myelin maps between females and males in the Chinese (from the CHCP dataset) and Caucasian (from the HCP dataset) populations revealed significant differences in the frontal, temporal, parietal, occipital, and insular lobes as well as the cingulate cortices.
When constructing a surface brain template, the criterion for choosing the number of subjects is critical. As demonstrated by Lyttelton et al. (2007), even a smaller sample size between 30 and 50 subjects can generate a stable brain surface template. In this study, we used a large number of subjects for the construction of Chinese and Caucasian atlases (n = 200) and sex‐specific atlases (n = 100), thereby obtaining atlases that are highly representative of brain morphological features and ensuring strong statistical power of the results.
Several different strategies have been proposed for constructing cortical surface templates (Bozek et al., 2018; Lyttelton et al., 2007; Van Essen, 2005). Here, we choose an unbiased iterative procedure based on the MSM cortical surface registration algorithm for the construction of the sCN200 and sUS200 cortical surface atlases. The MSM algorithm is a spherical registration approach that provides flexible and accurate registration of surfaces and improves map sharpness of a variety of different features (Robinson et al., 2018); this algorithm has been widely used in cortical surface registration and is driven by an extensive variety of features, such as cortical sulcal depth, cortical myelination, cortical thickness, and resting‐state network maps (Coalson et al., 2018; Glasser et al., 2016; Harrison et al., 2015; Robinson et al., 2014). The MSM algorithm has the advantage of improving alignment and generating smooth distortions, especially in areas that have significant feature variance attributable to population variability (Robinson et al., 2018). Thus, we chose this approach and combined it with our high‐quality MRI data to create Chinese and Caucasian brain cortical surface atlases.
The current study has four main strengths compared with previous studies. First, we used large sample sizes for both the Chinese and Caucasian cohorts, which were based on the CHCP and HCP datasets, to improve the statistical power of group comparisons. Second, extending previous studies of the group‐level comparison of cortical morphological features between populations, we investigated the effect of population‐matched and mismatched templates on surface registration by assessing cortical curvature alignment accuracies. Third, we constructed sex‐specific brain atlases for the Chinese and Caucasian populations. Fourth, we performed an analysis of differences in cortical features between females and males for the Chinese cohort as well as for the Caucasian cohort.
Areal distortion maps and Dice coefficients of curvature alignment can be used for assessing the performance of registration methods and the cortical registration accuracy (Bozek et al., 2018; Pantazis et al., 2010). Here, we used these measures to assess the cortical registration and accuracy of cortical alignment when using the sCN200 and sUS200 templates, either as population‐matched or population‐mismatched templates. Our analysis showed that population‐matched templates produced lower absolute areal distortions and improved cortical alignment accuracy. These findings further demonstrate the importance of constructing a Chinese adult cortical surface atlas.
Previous studies have reported significant cortical surface morphology differences (e.g., gray matter cortical volume, cortical surface area, and cortical thickness) between Chinese and Caucasian brains (Chee, Zheng, Goh, Park, & Sutton, 2011; Kochunov et al., 2003; Tang et al., 2018). Visual assessment of our results showed that the sCN200 cortical surface templates are shorter in length and slightly greater in height than the sUS200 cortical surface templates, which is consistent with previous studies that reported differences between Chinese and Caucasian volumetric measures (Tang et al., 2010; Yang et al., 2020). Furthermore, the default network exhibited the greatest differences in the absolute areal distortion in both test sets when the CHCP and HCP test sets were respectively registered to the population‐matched and population‐mismatched brain templates. Previous volumetric brain template studies have shown that the anatomical differences between the Chinese and Caucasian volumetric templates are largely located in parts of Wernicke's and Broca's areas. Moreover, Yang et al. (2019) found that the default network was central and most pervasively related to discourse comprehension and that the language network overlapped with the default network. Thus, the absolute areal distortion results in the present study, which showed that the greatest differences were in the default network, are somehow matched with those in previous studies and indicated that the Chinese and Caucasian template differences in the language network may also exist in brain cortical surface morphology.
Prior volumetric template studies note the template variability across populations (Yang et al., 2020; Zhao et al., 2019). In our previous volumetric templates study (Yang et al., 2020), the volumes from all subjects that were used to construct the Chinese template were rigidly aligned to the ICBM152 space. Using only rigid alignment for the initialization retained the Chinese global shape in the final template and removed the bias toward the ICBM152 space. We further analyzed both the linear and nonlinear registration effects by employing population‐matched and population‐mismatched brain templates. The morphological template comparisons included the global shape differences and nonlinear registration differences, which were performed after excluding the linear affine effect. However, in a study by Zhao et al. (2019), each scan was linearly transformed (nine‐parameter affine transformation) to ICBM152 space, which resulted in the global shape of the final brain template representing the shape feature of the templates of the Caucasian population. Thus, although they pointed out differences in brain anatomical features, they did not perform a global shape comparison between the Chinese and Caucasian templates. They calculated the anatomical differences between the Chinese and Caucasian atlases using the mean square difference (MSD) and normalized cross‐correlation (NCC), which did not estimate the global shape effect. Notably, Im et al. (2008) found that as the brain size increases, the cortex thickness only slightly increases but the sulcal convolution increases dramatically, indicating that human cortices are not simply scaled versions of one another. Thus, the transformation from individual Chinese subjects to Caucasian population space might induce bias in brain morphological measurements. In the present study, to maintain the global shape of the Chinese surface template, we removed the bias induced by the affine registration of all Chinese subjects to the Conte69 atlas during the initialization of template construction using the approach proposed in Kuklisova‐Murgasova et al. (2011). Specifically, all individual affine transformations were averaged, and their inverse was applied to the template obtained in the final iteration to obtain the final unbiased Chinese surface template.
The analysis of differences between males and females showed some interesting results. Regional anatomical comparison of curvature maps showed almost no difference between females and males in both the Chinese and Caucasian cohorts. Among all analyzed cortical features, the T1w/T2w myelin maps showed the most obvious differences between females and males. This was consistent with a previous study of sex differences in cortical features based on the HCP dataset (Luo, Hou, Wang, & Hu, 2019). The myelin content is closely correlated with neuronal cell density, cortical expansion, and primate evolution. Previous studies have found that the key factor that induces myelin content differences might be the density of neurons, which could lead to an increased density of exiting myelinated axons or of tangential fibers relative to the more heavily myelinated deep layers (Glasser & Van Essen, 2011). Thus, the present findings suggested that there could be significant differences in the intensity of neurons across the cortical surfaces of females and males. Furthermore, genetic factors have been indicated to be significantly correlated with the mean variation in cortical myelination (Schmitt, Raznahan, Liu, & Neale, 2019). Several studies have explained female and male differences across multiple imaging phenotypes based on the hypothesis of the “female‐protective” mechanism, which involves the effects of the X chromosome (Johnson, Carothers, & Deary, 2009; Reinhold & Engqvist, 2013). These findings suggest that the primary reason for the differences in myelin content between sexes in the present study may be regulated by genes. However, since such explanations are speculative at present, we recommend that further work should aim to uncover the mechanism of the influence of genes on the cortical myelin content differences between sexes. The sulcal depth maps showed moderate differences between females and males in both the Chinese and Caucasian cohorts, which is consistent with the findings of Luo et al. (2019) using the HCP dataset. It is interesting to note that our analysis showed that males have a thicker cortex than females. This finding is not consistent with some previous studies (Im et al., 2006; Lv et al., 2010; Ritchie et al., 2018; Sowell et al., 2007). The reason why our results differ from those of previous studies may be that we used the HCP “minimal preprocessing pipeline”. As stated in section 2.2, the pipeline uses high‐resolution T1w and T2w images to improve the surface extraction of white matter and pial surfaces. These high‐resolution images are used to eliminate partial volume effects, and T2w images, which have very different gray matter intensities, are used to remove the dura and blood vessels for correcting the pial surface. Finally, these corrected white and pial surfaces were used to calculate cortical thickness (Glasser et al., 2013). Thus, these corrections can be used to obtain more accurate measurements of cortical thickness and can cause differences in cortical thickness between males and females, inconsistent with previous studies. In the future, to validate this contradictory finding, we will investigate the cortical thickness between the different sexes based on the postmortem method, which is considered the “gold standard” in cortical morphological analysis. Overall, the regional anatomical comparisons of the sex effect showed various distributions across the whole brain between the Chinese and Caucasian populations in the sulcal depth maps, cortical thickness and T1w/T2w myelin maps. These findings suggest that there exist interactions between the sex effect and the population effect.
Recently, the Chinese Imaging Genetics (CHIMGEN) study established the largest Chinese neuroimaging genetics cohort, which prospectively collected genomic, neuroimaging, environmental, and behavioral data from more than 7,000 healthy Chinese Han participants aged 18–30 years (Xu et al., 2019). CHIMGEN can remarkably enhance cross‐ethnic and cross‐geographic brain research and uncover genetic and environmental factors and their interactions, including neuroimaging and behavioral phenotypes. Our Chinese surface templates will produce more accurate image registration in Chinese cortical surface‐based mapping analysis, which would promote an explosion of precise and novel insights into the cross‐ethnic and genetic‐neuroimaging research field.
Several limitations related to this study should be noted. First, our Chinese cortical surface atlas could be used in the analysis of Chinese structural, functional, and diffusion MR images. However, cortical folding‐based registration is not optimal when registering functional data due to the differences in functional and anatomical variability across subjects (Conroy, Singer, Guntupalli, Ramadge, & Haxby, 2013; Tootell et al., 1995; Watson et al., 1993). Previous studies have found that using functional registration based on neural activity, for example, resting‐state networks, improves intersubject registration accuracies and increases the sensitivity of group statistical analysis (Robinson et al., 2014; Sabuncu et al., 2010). Thus, future work will focus on optimizing the template construction framework and constructing a brain template using functional alignment. Second, the CHCP and HCP datasets were collected at different sites, which could induce nonbiological variability and exert a serious impact, especially in studies of rare disorders or subtle effects in diverse populations (Dansereau et al., 2017; Han et al., 2006; Keshavan et al., 2016; Yu et al., 2018). Furthermore, based on a large population of subjects, even the tiniest of systematic differences between populations is likely to be statistically significant. Thus, we did not perform a direct comparison between Chinese and Caucasian cohorts but focused the analysis on the effect of using population‐matched and mismatched templates on cortical registration and alignment accuracy; we analyzed differences between females and males only within each population, not between populations.
5. CONCLUSION
In conclusion, our proposed atlas represents the first Chinese cortical surface atlas based on high‐quality MR images of the adult Chinese population (both sCN200 and sUS200 atlases are available at https://www.nitrc.org/projects/scn200_sus200/). This study found significant improvements in brain cortical registration and the accuracy of curvature alignment for the use of population‐matched templates, which demonstrates the importance and necessity of having population‐matched cortical surface templates. Furthermore, we compared a wide variety of features on the cortical surface, and the presented results showed significant differences between females and males in Chinese and Caucasian cohorts.
CONFLICT OF INTEREST
The authors have no financial or competing interests to declare.
ACKNOWLEDGMENTS
This work was supported by the National Natural Science Foundation of China (81790651, 81790650, 81727808, 81430037, 31771253, and 31421003), the Beijing Municipal Science & Technology Commission (Z171100000117012), and the Beijing Brain Initiative of Beijing Municipal Science & Technology Commission (Z181100001518003). The Guangdong key basic research grant (2018B030332001) and Guangdong Pearl River Talents Plan (2016ZT06S220). Data were provided in part by the Human Connectome Project, the WU‐Minn Consortium (Principal Investigators: David Van Essen and Kamil Ugurbil; 1U54MH091657) funded by the 16 NIH Institutes and Centers that support the NIH Blueprint for Neuroscience Research and by the McDonnell Center for Systems Neuroscience at Washington University. JB is supported by the European Regional Development Fund under grant KK.01.1.1.01.0009 (DATACROSS). We are thankful to Sizhong Zhou, Jianqiao Ge and Weiwei Men for the data acquisition.
Yang G, Bozek J, Han M, Gao J‐H. Constructing and evaluating a cortical surface atlas and analyzing cortical sex differences in young Chinese adults. Hum Brain Mapp. 2020;41:2495–2513. 10.1002/hbm.24960
Funding information European Regional Development Fund, Grant/Award Number: KK.01.1.1.01.0009; National Natural Science Foundation of China, Grant/Award Numbers: 31421003, 31771253, 81430037, 81727808, 81790650, 81790651; The Beijing Brain Initiative of Beijing Municipal Science & Technology Commission, Grant/Award Number: Z181100001518003; The Beijing Municipal Science & Technology Commission, Grant/Award Number: Z171100000117012; The Guangdong Key Basic Research Grant, Grant/Award Number: 2018B030332001; The Guangdong Pearl River Talents Plan, Grant/Award Number: 2016ZT06S220
DATA AVAILABILITY STATEMENT
The sCN200 and sUS200 atlases have been released on the Neuroimage Informatics Tools and Resources Clearinghouse (NITRC) website (https://www.nitrc.org/projects/scn200_sus200/).
REFERENCES
- Bozek, J. , Makropoulos, A. , Schuh, A. , Fitzgibbon, S. , Wright, R. , Glasser, M. F. , … Robinson, E. C. (2018). Construction of a neonatal cortical surface atlas using multimodal surface matching in the developing human connectome project. NeuroImage, 179, 11–29. 10.1016/j.neuroimage.2018.06.018 [DOI] [PMC free article] [PubMed] [Google Scholar]
- Chee, M. W. L. , Zheng, H. , Goh, J. O. S. , Park, D. , & Sutton, B. P. (2011). Brain structure in young and old east Asians and westerners: Comparisons of structural volume and cortical thickness. Journal of Cognitive Neuroscience, 23(5), 1065–1079. [DOI] [PMC free article] [PubMed] [Google Scholar]
- Coalson, T. S. , Van Essen, D. C. , & Glasser, M. F. (2018). The impact of traditional neuroimaging methods on the spatial localization of cortical areas. Proc Natl Acad Sci USA, 115, 6356–6365. 10.1073/pnas.1801582115 [DOI] [PMC free article] [PubMed] [Google Scholar]
- Conroy, B. R. , Singer, B. D. , Guntupalli, J. S. , Ramadge, P. J. , & Haxby, J. V. (2013). Inter‐subject alignment of human cortical anatomy using functional connectivity. NeuroImage, 81, 400–411. 10.1016/j.neuroimage.2013.05.009 [DOI] [PMC free article] [PubMed] [Google Scholar]
- Dansereau, C. , Benhajali, Y. , Risterucci, C. , Pich, E. M. , Orban, P. , Arnold, D. , & Bellec, P. (2017). Statistical power and prediction accuracy in multisite resting‐state fMRI connectivity. NeuroImage, 149, 220–232. 10.1016/j.neuroimage.2017.01.072 [DOI] [PubMed] [Google Scholar]
- Desikan, R. S. , Segonne, F. , Fischl, B. , Quinn, B. T. , Dickerson, B. C. , Blacker, D. , … Killiany, R. J. (2006). An automated labeling system for subdividing the human cerebral cortex on MRI scans into gyral based regions of interest. NeuroImage, 31(3), 968–980. 10.1016/j.neuroimage.2006.01.021 [DOI] [PubMed] [Google Scholar]
- Destrieux, C. , Fischl, B. , Dale, A. , & Halgren, E. (2010). Automatic parcellation of human cortical gyri and sulci using standard anatomical nomenclature. NeuroImage, 53(1), 1–15. 10.1016/j.neuroimage.2010.06.010 [DOI] [PMC free article] [PubMed] [Google Scholar]
- Dice, L. R. (1945). Measures of the amount of ecologic association between species. Ecology, 26(3), 297–302. [Google Scholar]
- Evans, A. C. , Janke, A. L. , Collins, D. L. , & Baillet, S. (2012). Brain templates and atlases. NeuroImage, 62(2), 911–922. 10.1016/j.neuroimage.2012.01.024 [DOI] [PubMed] [Google Scholar]
- Fan, C. C. , Bartsch, H. , Schork, A. J. , Chen, C. H. , Wang, Y. , Lo, M. T. , … Genetics, S. (2015). Modeling the 3D geometry of the cortical surface with genetic ancestry. Current Biology, 25(15), 1988–1992. 10.1016/j.cub.2015.06.006 [DOI] [PMC free article] [PubMed] [Google Scholar]
- Fischl, B. , Sereno, M. I. , & Dale, A. M. (1999). Cortical surface‐based analysis: II: Inflation, flattening, and a surface‐based coordinate system. NeuroImage, 9(2), 195–207. [DOI] [PubMed] [Google Scholar]
- Fischl, B. , Sereno, M. I. , Tootell, B. H. , & Dale, A. M. (1999). High‐resolution intersubject averaging and a coordinate system for the cortical surface. Human Brain Mapping, 8(7), 272–284. [DOI] [PMC free article] [PubMed] [Google Scholar]
- Friston, K. J. , Ashburner, J. , Frith, C. D. , Poline, C. , Heather, J. D. , & Frackowiak, R. S. J. (1995). Spatial registraion and normalizatioin of images. Human Brain Mapping, 2, 165–189. [Google Scholar]
- Ge, J. , Peng, G. , Lyu, B. , Wang, Y. , Zhuo, Y. , Niu, Z. , … Gao, J.‐H. (2015). Cross‐language differences in the brain network subserving intelligible speech. Proc Natl Acad Sci USA, 112(10), 2972–2977. [DOI] [PMC free article] [PubMed] [Google Scholar]
- Genovese, C. R. , Lazar, N. A. , & Nichols, T. (2002). Thresholding of statistical maps in functional neuroimaging using the false discovery rate. NeuroImage, 15(4), 870–878. [DOI] [PubMed] [Google Scholar]
- Ghosh, S. S. , Kakunoori, S. , Augustinack, J. , Nieto‐Castanon, A. , Kovelman, I. , Gaab, N. , … Fischl, B. (2010). Evaluating the validity of volume‐based and surface‐based brain image registration for developmental cognitive neuroscience studies in children 4 to 11 years of age. NeuroImage, 53(1), 85–93. 10.1016/j.neuroimage.2010.05.075 [DOI] [PMC free article] [PubMed] [Google Scholar]
- Glasser, M. F. , Smith, S. M. , Marcus, D. S. , Andersson, J. L. , Auerbach, E. J. , Behrens, T. E. , … Van Essen, D. C. (2016). The human connectome project's neuroimaging approach. Nature Neuroscience, 19(9), 1175–1187. 10.1038/nn.4361 [DOI] [PMC free article] [PubMed] [Google Scholar]
- Glasser, M. F. , Sotiropoulos, S. N. , Wilson, J. A. , Coalson, T. S. , Fischl, B. , Andersson, J. L. , … Consortium, W. U.‐M. H . (2013). The minimal preprocessing pipelines for the human connectome project. NeuroImage, 80, 105–124. 10.1016/j.neuroimage.2013.04.127 [DOI] [PMC free article] [PubMed] [Google Scholar]
- Glasser, M. F. , & Van Essen, D. C. (2011). Mapping human cortical areas in vivo based on myelin content as revealed by T1‐ and T2‐weighted MRI. The Journal of Neuroscience, 31(32), 11597–11616. 10.1523/JNEUROSCI.2180-11.2011 [DOI] [PMC free article] [PubMed] [Google Scholar]
- Han, X. , Jovicich, J. , Salat, D. , van der Kouwe, A. , Quinn, B. , Czanner, S. , … Fischl, B. (2006). Reliability of MRI‐derived measurements of human cerebral cortical thickness: The effects of field strength, scanner upgrade and manufacturer. NeuroImage, 32(1), 180–194. 10.1016/j.neuroimage.2006.02.051 [DOI] [PubMed] [Google Scholar]
- Harrison, S. J. , Woolrich, M. W. , Robinson, E. C. , Glasser, M. F. , Beckmann, C. F. , Jenkinson, M. , & Smith, S. M. (2015). Large‐scale probabilistic functional modes from resting state fMRI. NeuroImage, 109, 217–231. 10.1016/j.neuroimage.2015.01.013 [DOI] [PMC free article] [PubMed] [Google Scholar]
- Im, K. , Lee, J. M. , Lee, J. , Shin, Y. W. , Kim, I. Y. , Kwon, J. S. , & Kim, S. I. (2006). Gender difference analysis of cortical thickness in healthy young adults with surface‐based methods. NeuroImage, 31(1), 31–38. 10.1016/j.neuroimage.2005.11.042 [DOI] [PubMed] [Google Scholar]
- Im, K. , Lee, J. M. , Lyttelton, O. , Kim, S. H. , Evans, A. C. , & Kim, S. I. (2008). Brain size and cortical structure in the adult human brain. Cerebral Cortex, 18(9), 2181–2191. 10.1093/cercor/bhm244 [DOI] [PubMed] [Google Scholar]
- Jacob, A. , Shukla, A. , Thonse, U. , Nagendra, B. , Chacko, D. M. , Hiremath, C. , … Rao, N. P. (2019). Cultural differences and neural correlates of cognitive insight in schizophrenia. Schizophrenia Research, 209, 98–104. 10.1016/j.schres.2019.05.010 [DOI] [PubMed] [Google Scholar]
- Johnson, W. , Carothers, A. , & Deary, I. J. (2009). A role for the X chromosome in sex differences in variability in general intelligence? Perspectives on Psychological Science, 4(6), 598–611. [DOI] [PubMed] [Google Scholar]
- Keshavan, A. , Paul, F. , Beyer, M. K. , Zhu, A. H. , Papinutto, N. , Shinohara, R. T. , … Henry, R. G. (2016). Power estimation for non‐standardized multisite studies. NeuroImage, 134, 281–294. 10.1016/j.neuroimage.2016.03.051 [DOI] [PMC free article] [PubMed] [Google Scholar]
- Kochunov, P. , Fox, P. , Lancaster, J. , Tan, L. H. , Amunts, K. , Zilles, K. , … Gao, J. H. (2003). Localized morphological brain differences between English‐speaking Caucasians and Chinese‐speaking Asians: New evidence of anatomical plasticity. Neuroreport, 14(7), 961–964. 10.1097/01.wnr.0000075417.59944.00 [DOI] [PubMed] [Google Scholar]
- Kuklisova‐Murgasova, M. , Aljabar, P. , Srinivasan, L. , Counsell, S. J. , Doria, V. , Serag, A. , … Rueckert, D. (2011). A dynamic 4D probabilistic atlas of the developing brain. NeuroImage, 54(4), 2750–2763. 10.1016/j.neuroimage.2010.10.019 [DOI] [PubMed] [Google Scholar]
- Lancaster, J. L. , Tordesillas‐Gutierrez, D. , Martinez, M. , Salinas, F. , Evans, A. , Zilles, K. , … Fox, P. T. (2007). Bias between MNI and Talairach coordinates analyzed using the ICBM‐152 brain template. Human Brain Mapping, 28(11), 1194–1205. 10.1002/hbm.20345 [DOI] [PMC free article] [PubMed] [Google Scholar]
- Lotze, M. , Domin, M. , Gerlach, F. H. , Gaser, C. , Lueders, E. , Schmidt, C. O. , & Neumann, N. (2019). Novel findings from 2,838 adult brains on sex differences in gray matter brain volume. Scientific Reports, 9(1), 1671 10.1038/s41598-018-38239-2 [DOI] [PMC free article] [PubMed] [Google Scholar]
- Luo, Y. , Shi, L. , Weng, J. , He, H. , Chu, W. C. , Chen, F. , & Wang, D. (2014). Intensity and sulci landmark combined brain atlas construction for Chinese pediatric population. Human Brain Mapping, 35(8), 3880–3892. 10.1002/hbm.22444 [DOI] [PMC free article] [PubMed] [Google Scholar]
- Luo, Z. , Hou, C. , Wang, L. , & Hu, D. (2019). Gender identification of human cortical 3‐D morphology using hierarchical sparsity. Frontiers in Human Neuroscience, 13, 29 10.3389/fnhum.2019.00029 [DOI] [PMC free article] [PubMed] [Google Scholar]
- Lv, B. , Li, J. , He, H. , Li, M. , Zhao, M. , Ai, L. , … Wang, Z. (2010). Gender consistency and difference in healthy adults revealed by cortical thickness. NeuroImage, 53(2), 373–382. 10.1016/j.neuroimage.2010.05.020 [DOI] [PubMed] [Google Scholar]
- Lyttelton, O. , Boucher, M. , Robbins, S. , & Evans, A. (2007). An unbiased iterative group registration template for cortical surface analysis. NeuroImage, 34(4), 1535–1544. 10.1016/j.neuroimage.2006.10.041 [DOI] [PubMed] [Google Scholar]
- Mugler, J. P. , Bao, S. , Mulkern, R. V. , Guttmann, C. R. , Robertson, R. L. , Jolesz, F. A. , Brookeman, J. R. (2000). Optimized single‐slab three‐dimensional spin‐echo MR imaging of the brain. Radiology, 216(3), 891–899. [DOI] [PubMed] [Google Scholar]
- Pantazis, D. , Joshi, A. , Jiang, J. , Shattuck, D. W. , Bernstein, L. E. , Damasio, H. , & Leahy, R. M. (2010). Comparison of landmark‐based and automatic methods for cortical surface registration. NeuroImage, 49(3), 2479–2493. 10.1016/j.neuroimage.2009.09.027 [DOI] [PMC free article] [PubMed] [Google Scholar]
- Reinhold, K. , & Engqvist, L. (2013). The variability is in the sex chromosomes. Evolution, 67(12), 3662–3668. 10.1111/evo.12224 [DOI] [PubMed] [Google Scholar]
- Richards, J. E. , Sanchez, C. , Phillips‐Meek, M. , & Xie, W. (2016). A database of age‐appropriate average MRI templates. NeuroImage, 124, 1254–1259. 10.1016/j.neuroimage.2015.04.055 [DOI] [PMC free article] [PubMed] [Google Scholar]
- Rilling, J. K. , Glasser, M. F. , Jbabdi, S. , Andersson, J. , & Preuss, T. M. (2011). Continuity, divergence, and the evolution of brain language pathways. Frontiers in Evolutionary Neuroscience, 3, 11 10.3389/fnevo.2011.00011 [DOI] [PMC free article] [PubMed] [Google Scholar]
- Ritchie, S. J. , Cox, S. R. , Shen, X. , Lombardo, M. V. , Reus, L. M. , Alloza, C. , … Deary, I. J. (2018). Sex differences in the adult human brain: Evidence from 5216 UKbiobank participants. Cerebral Cortex, 28(8), 2959–2975. 10.1093/cercor/bhy109 [DOI] [PMC free article] [PubMed] [Google Scholar]
- Robinson, E. C. , Garcia, K. , Glasser, M. F. , Chen, Z. , Coalson, T. S. , Makropoulos, A. , … Rueckert, D. (2018). Multimodal surface matching with higher‐order smoothness constraints. NeuroImage, 167, 453–465. 10.1016/j.neuroimage.2017.10.037 [DOI] [PMC free article] [PubMed] [Google Scholar]
- Robinson, E. C. , Jbabdi, S. , Glasser, M. F. , Andersson, J. , Burgess, G. C. , Harms, M. P. , … Jenkinson, M. (2014). MSM: A new flexible framework for multimodal surface matching. NeuroImage, 100, 414–426. 10.1016/j.neuroimage.2014.05.069 [DOI] [PMC free article] [PubMed] [Google Scholar]
- Sabuncu, M. R. , Singer, B. D. , Conroy, B. , Bryan, R. E. , Ramadge, P. J. , & Haxby, J. V. (2010). Function‐based intersubject alignment of human cortical anatomy. Cerebral Cortex, 20(1), 130–140. 10.1093/cercor/bhp085 [DOI] [PMC free article] [PubMed] [Google Scholar]
- Schmitt, J. E. , Raznahan, A. , Liu, S. , & Neale, M. C. (2019). The genetics of cortical myelination in young adults and its relationships to cerebral surface area, cortical thickness, and intelligence: A magnetic resonance imaging study of twins and families. NeuroImage, 206, 116319 10.1016/j.neuroimage.2019.116319 [DOI] [PMC free article] [PubMed] [Google Scholar]
- Shi, L. , Liang, P. , Luo, Y. , Liu, K. , Mok, V. C. T. , Chu, W. C. W. , … Li, K. (2017). Using large‐scale statistical Chinese brain template (Chinese2020) in popular neuroimage analysis toolkits. Frontiers in Human Neuroscience, 11, 414 10.3389/fnhum.2017.00414 [DOI] [PMC free article] [PubMed] [Google Scholar]
- Sowell, E. R. , Peterson, B. S. , Kan, E. , Woods, R. P. , Yoshii, J. , Bansal, R. , … Toga, A. W. (2007). Sex differences in cortical thickness mapped in 176 healthy individuals between 7 and 87 years of age. Cerebral Cortex, 17(7), 1550–1560. 10.1093/cercor/bhl066 [DOI] [PMC free article] [PubMed] [Google Scholar]
- Szalkai, B. , Varga, B. , & Grolmusz, V. (2019). Mapping correlations of psychological and structural connectome properties of the dataset of the human connectome project with the maximum spanning tree method. Brain Imaging and Behavior, 13(5), 1185–1192. 10.1007/s11682-018-9937-6 [DOI] [PubMed] [Google Scholar]
- Tang, Y. , Hojatkashani, C. , Dinov, I. D. , Sun, B. , Fan, L. , Lin, X. , … Toga, A. W. (2010). The construction of a Chinese MRI brain atlas: A morphometric comparison study between Chinese and Caucasian cohorts. NeuroImage, 51(1), 33–41. 10.1016/j.neuroimage.2010.01.111 [DOI] [PMC free article] [PubMed] [Google Scholar]
- Tang, Y. , Zhao, L. , Lou, Y. , Shi, Y. , Fang, R. , Lin, X. , … Toga, A. (2018). Brain structure differences between Chinese and Caucasian cohorts: A comprehensive morphometry study. Human Brain Mapping, 39(5), 2147–2155. 10.1002/hbm.23994 [DOI] [PMC free article] [PubMed] [Google Scholar]
- Tootell, R. B. , Reppas, J. B. , Kwong, K. K. , Malach, R. , Born, R. T. , Brady, T. J. , … Belliveau, J. W. (1995). Functional analysis of human MT and related visual cortical areas using magnetic resonance imaging. Journal of Neuroscience, 15(4), 3215–3230. [DOI] [PMC free article] [PubMed] [Google Scholar]
- Van Essen, D. C. (2004). Surface‐based approaches to spatial localization and registration in primate cerebral cortex. NeuroImage, 23(Suppl 1), S97–S107. 10.1016/j.neuroimage.2004.07.024 [DOI] [PubMed] [Google Scholar]
- Van Essen, D. C. (2005). A population‐average, landmark‐ and surface‐based (PALS) atlas of human cerebral cortex. NeuroImage, 28(3), 635–662. 10.1016/j.neuroimage.2005.06.058 [DOI] [PubMed] [Google Scholar]
- Van Essen, D. C. , Glasser, M. F. , Dierker, D. L. , Harwell, J. , & Coalson, T. (2012). Parcellations and hemispheric asymmetries of human cerebral cortex analyzed on surface‐based atlases. Cerebral Cortex, 22(10), 2241–2262. 10.1093/cercor/bhr291 [DOI] [PMC free article] [PubMed] [Google Scholar]
- Van Essen, D. C. , Smith, S. M. , Barch, D. M. , Behrens, T. E. , Yacoub, E. , Ugurbil, K. , & WU‐Minn Human Connectome Consortium . (2013). The WU‐Minn Human Connectome project: An overview. NeuroImage, 80, 62–79. 10.1016/j.neuroimage.2013.05.041 [DOI] [PMC free article] [PubMed] [Google Scholar]
- Watson, J. D. , Myers, R. , Frackowiak, R. S. , Hajnal, J. V. , Woods, R. P. , Mazziotta, J. C. , … Zeki, S. (1993). Area V5 of the human brain: Evidence from a combined study using positron emission tomography and magnetic resonance imaging. Cerebral Cortex, 3(2), 79–94. [DOI] [PubMed] [Google Scholar]
- Xie, W. , Richards, J. E. , Lei, D. , Lee, K. , & Gong, Q. (2015). Comparison of the brain development trajectory between Chinese and U.S. children and adolescents. Frontiers in Systems Neuroscience, 8, 249 10.3389/fnsys.2014.00249 [DOI] [PMC free article] [PubMed] [Google Scholar]
- Xin, J. , Zhang, Y. , Tang, Y. , & Yang, Y. (2019). Brain differences between men and women: Evidence from deep learning. Frontiers in Neuroscience, 13, 185 10.3389/fnins.2019.00185 [DOI] [PMC free article] [PubMed] [Google Scholar]
- Xu, Q. , Guo, L. , Cheng, J. , Wang, M. , Geng, Z. , Zhu, W. , … Consortium, C. (2019). CHIMGEN: A Chinese imaging genetics cohort to enhance cross‐ethnic and cross‐geographic brain research. Molecular Psychiatry, 1–13. 10.1038/s41380-019-0627-6 [DOI] [PMC free article] [PubMed] [Google Scholar]
- Yang, G. , Zhou, S. , Bozek, J. , Dong, H. M. , Han, M. , Zuo, X. N. , … Gao, J. H. (2020). Sample sizes and population differences in brain template construction. NeuroImage, 206, 116318 10.1016/j.neuroimage.2019.116318 [DOI] [PMC free article] [PubMed] [Google Scholar]
- Yang, X. , Li, H. , Lin, N. , Zhang, X. , Wang, Y. , Zhang, Y. , … Yang, Y. (2019). Uncovering cortical activations of discourse comprehension and their overlaps with common large‐scale neural networks. NeuroImage, 203, 116200 10.1016/j.neuroimage.2019.116200 [DOI] [PubMed] [Google Scholar]
- Yeo, B. T. , Krienen, F. M. , Sepulcre, J. , Sabuncu, M. R. , Lashkari, D. , Hollinshead, M. , … Buckner, R. L. (2011). The organization of the human cerebral cortex estimated by intrinsic functional connectivity. Journal of Neurophysiology, 106(3), 1125–1165. 10.1152/jn.00338.2011 [DOI] [PMC free article] [PubMed] [Google Scholar]
- Yoon, U. , Fonov, V. S. , Perusse, D. , Evans, A. C. , & Brain Development Cooperative, G . (2009). The effect of template choice on morphometric analysis of pediatric brain data. NeuroImage, 45(3), 769–777. 10.1016/j.neuroimage.2008.12.046 [DOI] [PubMed] [Google Scholar]
- Yu, M. , Linn, K. A. , Cook, P. A. , Phillips, M. L. , McInnis, M. , Fava, M. , … Sheline, Y. I. (2018). Statistical harmonization corrects site effects in functional connectivity measurements from multi‐site fMRI data. Human Brain Mapping, 39(11), 4213–4227. 10.1002/hbm.24241 [DOI] [PMC free article] [PubMed] [Google Scholar]
- Zhang, Y. , Fan, L. , Caspers, S. , Heim, S. , Song, M. , Liu, C. , … Jiang, T. (2017). Cross‐cultural consistency and diversity in intrinsic functional organization of Broca's region. NeuroImage, 150, 177–190. 10.1016/j.neuroimage.2017.02.042 [DOI] [PubMed] [Google Scholar]
- Zhao, T. , Liao, X. , Fonov, V. S. , Wang, Q. , Men, W. , Wang, Y. , … He, Y. (2019). Unbiased age‐specific structural brain atlases for Chinese pediatric population. NeuroImage, 189, 55–70. 10.1016/j.neuroimage.2019.01.006 [DOI] [PubMed] [Google Scholar]
- Zilles, K. , Kawashima, R. , Dabringhaus, A. , Fukuda, H. , & Schormann, T. (2001). Hemispheric shape of European and Japanese brains: 3‐D MRI analysis of intersubject variability, ethnical, and gender differences. NeuroImage, 13(2), 262–271. 10.1006/nimg.2000.0688 [DOI] [PubMed] [Google Scholar]
Associated Data
This section collects any data citations, data availability statements, or supplementary materials included in this article.
Data Availability Statement
The sCN200 and sUS200 atlases have been released on the Neuroimage Informatics Tools and Resources Clearinghouse (NITRC) website (https://www.nitrc.org/projects/scn200_sus200/).