

Abstract
We examined the effect of galvanic vestibular stimulation (GVS) on resting state brain activity using fMRI (rs‐fMRI) in patients with bilateral vestibulopathy. Based on our previous findings, we hypothesized that GVS, which excites the vestibular nerve fibers, (a) increases functional connectivity in temporoparietal regions processing vestibular signals, and (b) alleviates abnormal visual–vestibular interaction. Rs‐fMRI of 26 patients and 26 age‐matched healthy control subjects was compared before and after GVS. The stimulation elicited a motion percept in all participants. Using different analyses (degree centrality, DC; fractional amplitude of low frequency fluctuations [fALFF] and seed‐based functional connectivity, FC), group comparisons revealed smaller rs‐fMRI in the right Rolandic operculum of patients. After GVS, rs‐fMRI increased in the right Rolandic operculum in both groups and in the patients' cerebellar Crus 1 which was related to vestibular hypofunction. GVS elicited a fALFF increase in the visual cortex of patients that was inversely correlated with the patients' rating of perceived dizziness. After GVS, FC between parietoinsular cortex and higher visual areas increased in healthy controls but not in patients. In conclusion, short‐term GVS is able to modulate rs‐fMRI in healthy controls and BV patients. GVS elicits an increase of the reduced rs‐fMRI in the patients' right Rolandic operculum, which may be an important contribution to restore the disturbed visual–vestibular interaction. The GVS‐induced changes in the cerebellum and the visual cortex were associated with lower dizziness‐related handicaps in patients, possibly reflecting beneficial neural plasticity that might subserve visual–vestibular compensation of deficient self‐motion perception.
Keywords: bilateral vestibulopathy, galvanic vestibular stimulation, visual–vestibular interaction, fALFF, degree centrality, functional connectivity, rs‐fMRI
Abbreviations
- DC
degree centrality
- DHI
dizziness handicap score
- fALFF
fractional amplitude of low frequency fluctuations
- FC
seed‐based functional connectivity
- HC
healthy control
- IPL
inferior parietal lobule
- OP2
core vestibular area of parietal operculum
- PIVC
parietoinsular vestibular cortex
- ROI
region of interest
- SMA
supplementary motor area
- SMG
supramarginal gyrus
- STG
superior temporal gyrus
- VOR
vestibulo‐ocular reflex
- VSS
vertigo symptom scale
1. INTRODUCTION
Patients with bilateral vestibular failure (bilateral vestibulopathy, BV) complain of unsteadiness of gait and oscillopsia, an illusion that the environment is moving during locomotion and head movements (Strupp et al., 2017). This results from a deficient vestibulo‐ocular reflex (VOR) which normally stabilizes gaze during locomotion and rapid head movements. Postural ataxia becomes evident with reduced visual and proprioceptive control (Sprenger, Wojak, Jandl, & Helmchen, 2017). BV has a wide spectrum of etiologies (Zingler et al., 2007). While the cause remains unclear (“idiopathic”) in most patients (Cutfield, Scott, Waldman, Sharp, & Bronstein, 2014), many were previously exposed to ototoxic drugs. Unfortunately, the majority of BV patients do not recover, particularly since peripheral vestibular nerve cell regeneration is poor (Zingler et al., 2008).
Accordingly, clinical improvement, once it occurs, most likely comes from central compensatory mechanisms (Lacour, Helmchen, & Vidal, 2016), that is, by modifying the gain in the somatosensory (Strupp, Arbusow, Dieterich, Sautier, & Brandt, 1998), the proprioceptive (Cutfield et al., 2014) or visual system (Ahmad et al., 2017; Dieterich, Bauermann, Best, Stoeter, & Schlindwein, 2007; Kalla et al., 2011). This may be accomplished by changing the excitability in the brain (Ahmad et al., 2017; Cutfield et al., 2014; Helmchen, Rother, Spliethoff, & Sprenger, 2019) and its intra‐ and interhemispheric interactions (Cutfield et al., 2014), as well as alterations of network properties in the brain, that is, functional connectivity (Gottlich et al., 2014) and/or regional structural changes (Brandt et al., 2005; Cutfield et al., 2014; Gottlich et al., 2016; Kremmyda et al., 2016).
Transient experimental vestibular deprivation has been shown to elicit (a) changes in the functional connectivity of the right supramarginal gyrus (SMG) of cosmonauts (Pechenkova et al., 2019) which correlated with the severity of motion sickness and (b) altered responsivity in the vestibular cortical network (Yuan et al., 2018). Prolonged head‐down‐tilt bed rest over >2 months (HDBR) is utilized as a spaceflight analog research condition to study related behavioral and neural changes in the absence of gravitational modifications (Yuan et al., 2018). Excitability of the bilateral insular cortex, part of the vestibular network, in response to experimental vestibular stimulation gradually increased across the course of HDBR, suggesting an upregulation of the responsivity to vestibular inputs during prolonged deprivation from daily vestibular stimulation.
Visuo‐vestibular interaction plays an important role in integrating and disambiguating visual and vestibular cues that may arise from conflicting signals in our environment or by visual or vestibular diseases (Roberts et al., 2017). If visual and vestibular cues are congruent (signaling motion in the same direction) the visual cortex is largely activated. If visual and vestibular stimuli signal contradictory information with respect to self‐motion perception, multisensory vestibular cortex areas are activated to resolve this conflict. The importance of inhibitory reciprocal visuo‐vestibular cortical interaction has first been described by Brandt, Bartenstein, Janek, and Dieterich (1998): visual motion stimulation reduced neural activity in the parietoinsular vestibular cortex to reduce motion perception by vestibular cues and, vice versa, in the case of vestibular cortex activation, the visual cortex is inhibited to reduce retinal slip by involuntary vestibular nystagmus. Abnormal visuo‐vestibular processing with decreased visual cortex (V1) activation during congruent visuo‐vestibular motion stimulation in vestibular neuritis patients may account for their increased visually induced dizziness (Roberts et al., 2018) and increased vestibular perceptional thresholds of self‐motion in vestibular migraine (Bednarczuk et al., 2019).
How does vestibular deafferentation affect visuo‐vestibular interaction in BV? Visual motion coherence threshold is increased in BV and associated with decreased motion processing in the attempt to counteract involuntary oscillopsia during locomotion (Kalla et al., 2011). Moreover, thresholds of self‐motion perception following vestibular stimulation are also increased in BV (Helmchen et al., 2019). In PET brain imaging (H2O15) during vestibular caloric stimulation the parietoinsular vestibular cortex showed decreased activation (Bense et al., 2004), that is, visuo‐vestibular interaction was reduced as deactivation of the visual cortex was concomitantly smaller compared to healthy controls. Recently, natural circular and linear vestibular stimulation using a self‐propelled chair with rotations and linear sideways movements elicited activation (FDG uptake using 18F‐PET) bilaterally in the intersection of the posterior insula and Heschl's gyrus (Devantier et al., 2019). The cytoarchitectonic area OP2 in the parietal operculum was identified as the primary candidate for the human vestibular cortex in a meta‐analysis of 28 PET and fMRI studies employing various vestibular stimuli, an area representing the human homolog of the “parietoinsular vestibular cortex” (PIVC) in macaque monkeys (zu Eulenburg, Caspers, Roski, & Eickhoff, 2012). Recently, two regions have been separated in the parietoinsular vestibular cortex in humans: the posterior insula, which corresponds to the nonhuman primate PIVC responding to vestibular stimuli, and the more posteriorly, retroinsular located “posterior insular cortex” (PIC) which is activated by both vestibular and visual stimuli (Frank & Greenlee, 2018). The latter is crucial for the distinction between visual self‐motion and visual object motion.
A method of vestibular stimulation without head movements is galvanic vestibular stimulation (GVS) that has been shown to reliably activate core vestibular regions (Bense, Stephan, Yousry, Brandt, & Dieterich, 2001; Cyran, Boegle, Stephan, Dieterich, & Glasauer, 2016; Lobel, Kleine, Bihan, Leroy‐Willig, & Berthoz, 1998; Stephan et al., 2005). On a behavioral level, GVS evokes sensation of body rotation (Fitzpatrick, Marsden, Lord, & Day, 2002). In contrast to caloric vestibular stimuli, GVS excites the vestibular afferent nerve fibers. This potentially bypasses the further peripheral damage in the sensory vestibular hair cells in BV. Using GVS in BV patients, we recently found pronounced neural activity with steep stimulus–response functions in cortical regions of vestibular processing, nearly indistinguishable from healthy controls, and even stronger activity in early visual cortex and superior temporal gyrus (STG) which was related to the level of dizziness‐related disability (Helmchen et al., 2019). This pronounced cortical responsivity potentially provides a physiological ground for artificial vestibular stimulation in BV, that is, by vestibular implants (Fornos et al., 2017; van de Berg et al., 2017) or portable GVS devices. This, however, may also change the brain activity at rest, that is, without any task or stimulus.
Using resting state fMRI (rs‐fMRI), it was shown that vestibular failure changes functional brain networks in unilateral (Helmchen, Ye, Sprenger, & Munte, 2014; Klingner, Volk, Brodoehl, Witte, & Guntinas‐Lichius, 2014) and BV (Gottlich et al., 2014), that is, in the absence of vestibular stimulation. In unilateral vestibulopathy, decreased functional connectivity in the SMG partially reversed over a period of 3 months while patients clinically improved (Helmchen et al., 2014). In BV, we found functional connectivity in the posterior insula and parietal operculum to be reduced and related to adaptive changes in the VOR (Gottlich et al., 2014).
In the current study, we used GVS in BV patients to modify abnormal fluctuations of the blood‐oxygen‐level‐dependent (BOLD) fMRI signal in different regions of the resting brain and related the rs‐fMRI group differences to behavioral, perceptional and quantitative vestibular parameters. We employed different methods of rs‐fMRI analyses: local and global functional connectivity measures (FC, and degree centrality, DC), to detect temporal correlations between spatially remote neurophysiological events (Biswal, Yetkin, Haughton, & Hyde, 1995; Fox & Raichle, 2007), and the fractional amplitude of low frequency fluctuations (fALFF) to reveal regional changes in the magnitude of spontaneous neuronal activity (Yang et al., 2007; Zang et al., 2007; Zou et al., 2008). As FC and DC, the more recent fALFF measure has been proven to be clinically meaningful by revealing significant fALFF‐behavior correlations in different brain diseases (Kublbock et al., 2014; Machner et al., 2020; Wang et al., 2018; Zuo et al., 2010).
We pursued the following hypotheses concerning the influence of GVS on the disturbed cortical processing and visuo‐vestibular interactions in BV patients (see Figure 1 for schematic illustration):
We expected GVS to increase the reduced resting‐state brain activity in vestibular core regions of BV patients via stimulation of vestibular nerve afferents that transmit vestibular signals to the chronically deprived cortical areas engaged in vestibular processing. This change may be related to the severity of vestibular hypofunction.
Due to the known abnormal visual–vestibular interaction in BV patients (Helmchen et al., 2019), the visual cortex is less suppressed by vestibular stimuli and, accordingly, resting state brain activity in the visual cortex should be increased in BV and related to the level of perceived dizziness of BV. After GVS, this increased activity in visual cortex is expected to be decreased since inhibitory visual–vestibular interaction are suspected to be partially resumed. This should be reflected in a GVS‐related increase of functional connectivity between cortical areas involved in the visual–vestibular interaction. Finally, the change of activity in the visual cortex is expected to be related to the severity of perceived dizziness.
Figure 1.
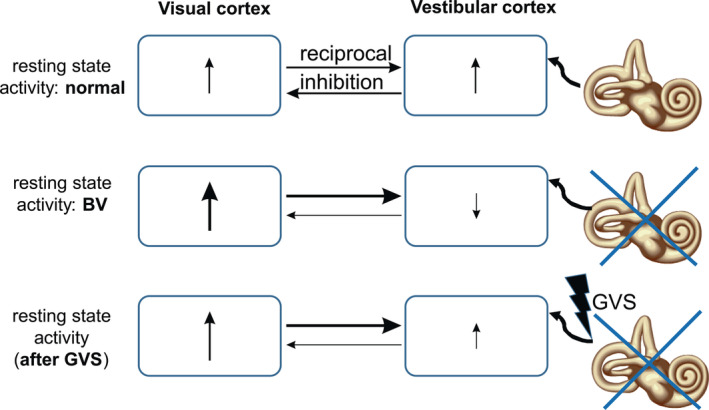
Schematic drawing of assumed resting state brain activity (RSBA) in the visual and vestibular cortex of healthy subjects (HC, upper row), patients with bilateral vestibulopathy (BV, center row) and BV patients after galvanic stimulation (GVS‐BV, lower row). For the sake of simplicity, the multiregional distribution of other vestibular‐responsive cortical brain regions is neglected as the distinction of the visual motion and nonmotion related visual areas. In HC without GVS, ↑ indicates a given amount of RSBA in visual and vestibular cortices under “normal” conditions that influence each other via reciprocal inhibition (horizontal arrows, their thickness indicates the strength of assumed visual–vestibular interactions). Under no‐GVS condition, BV patients show reduced RSBA in the vestibular cortex and reduced inhibition of the visual cortex leading to increased RSBA. GVS at the peripheral nerve site in BV patients leads to a relative increase of the (still abnormal) RSBA in the vestibular cortex with resumed inhibition of the visual cortex, thereby partially rebalancing disturbed visuo‐vestibular interactions in BV patients. The presumed increase of RSBA in the vestibular cortex determines the degree of suppression in the visual cortex
2. METHODS
Twenty‐six patients with BV and 26 healthy control (HC) subjects were enrolled in this study which was approved by the Ethics Committee of the University of Luebeck. They were recruited from the University Centre for Vertigo and Balance Disorders. The majority of subjects of this group participated in a related study examining the GVS‐evoked brain activity in an event‐related study design (Helmchen et al., 2019). Each participant provided informed oral and written consent in accordance with the Declaration of Helsinki.
After controlling for motion in the MRI bore (see Section 2.3), five BV patients and four HC subjects had to excluded resulting in the final analysis of 21 BV patients [mean age 64.1 ± 7.7 years (SD), 52.4% female] and 22 age‐matched HC subjects [mean age 62.1 ± 7.8 years (SD), 50.0% female].
All patients reported dizziness, gait unsteadiness and oscillopsia during locomotion and head movements. All participants underwent neurological, neuro‐ophthalmological, and neuro‐otological examinations (caloric irrigation, quantitative head impulse test, subjective visual vertical). All participants were right‐handed as indexed by the Edinburgh Handedness Inventory and had normal or corrected‐to‐normal vision. BV patients and controls were on no regular medication known to affect central nervous system processing. None of the patients took psychotropic medication.
Patients were diagnosed for BV based on clinical examinations by experienced neuro‐otologists of the University Centre for Vertigo and Balance Disorders in Lübeck and on electrophysiological recordings (bithermal cold [27°C] and warm [44°C] caloric irrigation, quantitative head impulse test [qHIT]). Inclusion criteria for BVF were the following: (a) clinical assessment of a bilaterally pathologic HIT (Jorns‐Haderli, Straumann, & Palla, 2007), (b) bilaterally reduced gain of the horizontal VOR (<0.7) assessed by video‐HIT (Helmchen, Knauss, Trillenberg, Frendl, & Sprenger, 2017; Machner, Sprenger, Fullgraf, Trillenberg, & Helmchen, 2013), (c) bilateral caloric hyporesponsiveness (mean peak slow phase velocity [SPV] of <5°/s on both sides), and (d) normal structural cranial magnetic resonance imaging. All patients met the criteria of BVF recently revised by a consensus group of the Barany Society (Strupp et al., 2017). Patients with depression, dementia, hearing deficits and those with additional evidence for autoimmune and paraneoplastic diseases were excluded from the study. Pure tone audiometry showed normal hearing thresholds. General cognitive impairment was evaluated by the Montreal Cognitive Assessment test (MoCA). Participants subjectively rated their level of disease‐related impairment by the Dizziness Handicap Inventory (DHI) score and the Vertigo Symptom Scale (VSS; Tschan et al., 2008). In these scores, larger values indicate increased vestibular‐induced subjective disability. The most common etiology of BVF was idiopathic BVF (n = 17), second was antibiotic ototoxicity (n = 4). All of the patients suffered from BVF for at least 1 year before they participated in the study. Apart from clinical signs of BVF and ataxia of stance and gait there were no other abnormal neurological signs.
None of the healthy control participants had abnormal vestibular functions on clinical and quantitative recordings at the time of enrollment and recording.
For head impulse test, eye and head movements were recorded by the EyeSeeCam® HIT System (Autronics, Hamburg, Germany) at a sampling rate of 220 Hz. For further details see (Gottlich et al., 2016; Helmchen et al., 2017; Sprenger, Wojak, Jandl, Hertel, & Helmchen, 2014). In the MRI, eye fixation and eye movements were monitored using a video based eyetracker (Eyelink 1,000+, 1,000 Hz sampling rate, SR Research Ltd., Ottawa, ON/CA). Horizontal and vertical eye positions were analyzed offline using Matlab® (R2018B, The Mathworks Inc., Natick, MA). This was used to control fixation and to rule out eye movements as a potential covariate influencing brain activity.
2.1. Galvanic vestibular stimulation
Bilateral bipolar GVS was applied by a current stimulator (DS5 model, Digitimer Ltd., UK) at both mastoid bones using contact electrodes (E224N‐MR‐HSR‐500, EasyCap GmbH, Herrsching, Germany) as described before (Helmchen et al., 2019; Woll, Sprenger, & Helmchen, 2019). This stimulator has also been used and approved in other centers and studies (Cai et al., 2018; Cyran et al., 2016). Individual sensory (vestibular) thresholds were obtained by applying 10 s 1 Hz alternating stimulation, that is, low frequency alternating current that passed between the two mastoid electrodes. The ramp stimulus profile hampered sharp transients at stimulus onset and offset (ramp onset and offset of 100 ms duration) with a stimulation plateau of 300 ms leading to perceived head and body tilt. Threshold testing started with an above threshold current (usually 1 mA). Subsequently, the stimulus intensity was decreased gradually in steps of 0.05 mA until the subject reported no vestibular sensations anymore. Then the procedure started again from a low threshold (0.20 mA) gradually increasing in steps of 0.05 mA until the subject reported vestibular sensations again while sitting in an upright position, that is, a perception of body motion. The threshold was verified by varying the stimulation intensity until a stable threshold was found. All subjects indicated a motion direction around the roll axis. We used perception‐matched vestibular stimuli of different magnitude, with low (0.5 mA) and high (1.5 mA) intensity currents above the perceived threshold (Helmchen et al., 2019). The sequence of experimental stimuli was pseudo‐randomized. This kind of stimulation induced a somatosensory and nociceptive stimulation but no vestibular perception. To exclude or at least minimize nociceptive stimulation of higher GVS the stimulation site was pretreated with local anesthetics prior the experiment (Anesderm® lotion).
With the eyes open, each GVS‐stimulus was examined 12 times resulting in 3 runs (duration of a single trial: 12 s stimulation, 4 s rating, 10 s pause interval; 1 block = 8 min). At the end of each GVS perceived motion intensity was rated on a visual analog scale that was displayed at the end of the MR bore. The participant had to respond after a visual rating command by moving the cursor on the display of the visual analog scale with the right hand within 4 s using a fiberoptic joystick (TETHYX, Current Designs, Inc., Philadelphia, PA; Helmchen et al., 2019). The total interval between both resting state recordings was 30 min.
2.2. Image acquisition
Structural and functional MR imaging was performed at the CBBM Core Facility Magnetic Resonance Imaging using a 3‐T Siemens Magnetom Skyra scanner equipped with a 64‐channel head‐coil. First, structural images of the whole brain using a 3D T1‐weighted MP‐RAGE sequence were acquired (TR = 1,900 ms; TE = 2.44 ms; TI = 900 ms; flip angle 9°; 1 × 1 × 1 mm3 resolution; 192 × 256 × 256 mm3 field of view; acquisition time 6.08 min). Two runs of functional image recordings were acquired each applying a single‐shot gradient‐recalled echo‐planar imaging (GRE‐EPI) sequence sensitive to blood oxygen level dependent (BOLD) contrast (298 volumes, TR = 1,620 ms; TE = 25 ms; flip angle = 70°; in‐plane resolution 2.5 × 2.5 mm2; 192 × 192 mm2 field of view; 58 axial slices; 2.5 mm slice thickness, no interslice gap; simultaneous multislice factor 2; acquisition time: 8.05 min). Lights were switched off during recordings. Subjects were asked to keep their eyes open and to foveate a small red dot on a black background. We used the fixation target in darkness to prevent nystagmus to occur while lying in the MRI bore which is induced by magnetic vestibular stimulation (MVS) reflecting a Lorentz force resulting from the interaction between the magnetic field and naturally occurring ionic currents in the labyrinthine endolymph fluid (D. C. Roberts et al., 2011). It is suppressed during visual fixation (Ward, Roberts, Otero‐Millan, & Zee, 2019). Eye movements were monitored via the MRI‐compatible eye tracker to ensure that subjects followed the instruction and that no nystagmus was present during fixation. None of the participants, neither patients nor healthy control subjects, showed nystagmus during fixation while resting state brain activity was recorded. Importantly, as Lorentz forces were kept constant throughout the MRI recordings the changes in resting state brain activity between the two recording sessions before and after GVS intervention are unlikely to be related to MVS. In order to minimize noise, ear plugs were used. Head movements were reduced by using ear pads (Multipad ear, Pearltec Technology AG, Schlieren, CH).
2.3. Data quality check of head motion
The six realignment parameters, that is, three displacements and three elementary rotations with respect to the first image in the EPI series, were used as an estimator for head motion. The maximum displacements were required to be smaller than 3.0 mm and the individual rotations smaller than 3.0°. Instantaneous motion below this threshold can still have a major confounding effect on rs‐fMRI measures (Power, Barnes, Snyder, Schlaggar, & Petersen, 2012; Van Dijk, Sabuncu, & Buckner, 2012). We therefore additionally enabled DPARSF to scrub the data by identifying and cutting out single motion contaminated frames (“bad” time points). The method is based on calculating the frame‐to‐frame displacement as described by Power and colleagues (Power et al., 2012), defining a “bad” time point when the framewise displacement threshold of >0.6 mm was exceeded, and deleting the current time point, the previous one and the following two time points (i.e., EPI volumes). This cutting led to a significant reduction of the number of EPI volumes but for each subject and each recording a minimum of 5 min of valid data was available for rs‐fMRI analyses. Subjects exceeding these cut‐offs were excluded from the study, which applied to five patients and four healthy subjects of the original study cohort.
2.4. Preprocessing and analysis
Preprocessing and further image analysis was performed with the SPM12 software (http://www.fil.ion.ucl.ac.uk/spm; Wellcome Trust Centre for Neuroimaging, London, UK) implemented in Matlab® 2018B (MathWorks®, Natick, MA). We performed slice timing correction using SPM standard procedure, subsequent processing using DPARSFA toolbox (data processing assistant for resting‐state fMRI, version 4.4; https://www.nitrc.org/projects/dparsf; Yan, Craddock, Zuo, Zang, & Milham, 2013), together with the SPM software. The first 10 time points of each data set were discarded to allow for magnetization equilibrium and for subjects to adjust to the environment. The preprocessing steps included: (a) a six parameter rigid body spatial transformation to correct for head motion during data acquisition (spatial realignment); (b) co‐registration of the structural image to the mean functional image; (c) gray and white matter segmentation, bias correction and spatial normalization of the structural image to a standard template (Montreal Neurological Institute, MNI); (iv) regression of nuisance variables from the data, in order to reduce the influence of motion and unspecific physiological effects (nuisance variables included white matter and ventricular signals, using the Friston 24‐parameter model (Friston, Williams, Howard, Frackowiak, & Turner, 1996); (v) spatial normalization of the functional images using the DARTEL (Diffeomorphic Anatomical Registration Through Exponentiated Lie) method and resampling to 2.5‐mm isotropic voxels; (vi) spatial smoothing with a 6‐mm full‐width at half‐maximum Gaussian kernel. (vii) Before the FC and DC analyses (but strictly after the fALFF analysis) a temporal bandpass filter was applied to all voxel time series retaining only the low frequency spectrum (0.01–0.1 Hz).
2.5. Seed‐based functional connectivity
Seed‐based connectivity (FC) analysis was performed to investigate the functional connectivity of a brain region of interest (ROI) to all the other voxel in the brain (Biswal, Yetkin, Haughton, & Hyde, 1995; Vincent et al., 2006). We predefined 13 ROIs as seeds in brain areas that are known to be involved in the processing of vestibular signals from a large meta‐analysis (zu Eulenburg et al., 2012): central and posterior insula, parietal operculum (OP1,2,4) and inferior parietal lobules (for MNI‐coordinates see Table S1). The time courses of all voxels within a sphere of 6 mm radius around the center coordinate of a particular ROI (resulting in a ROI volume of ~900 mm3 each) were averaged and connectivity maps were calculated by correlating the mean time course to all voxel time courses. The ROI coordinates are given in the MNI space.
2.6. Degree centrality
Voxel degree maps were calculated by correlating the temporal BOLD signal fluctuation of each voxel with all other voxels in the brain and counting the number of connections above a certain threshold. As a measure for the temporal correlation, we computed the zero‐lag Pearson's linear correlation coefficient r. The individual correlation coefficients were entered into an N × N adjacency matrix where N is the number of voxels. The voxel network matrix was thresholded by r > .25 suppressing random correlations and was subsequently z‐transformed (Gottlich et al., 2014).
2.7. Fractional amplitude of low frequency fluctuations analysis
For the fALFF analysis (Zou et al., 2008), the preprocessed time series in each voxel was first transformed to the frequency domain applying a fast Fourier transformation. Then the power spectrum was square root transformed and the ratio of the power in the low‐frequency band (0.01–0.1 Hz) to the integrate power of the entire frequency range was calculated. This resulted in one fALFF value for each voxel. Finally, the fALFF maps over all voxels in the brain were standardized into z‐score maps by subtracting mean and dividing SD within a whole brain mask for each participant, in order to improve statistical analyses (Yan et al., 2013; Zuo et al., 2010).
2.8. Statistical analysis
Statistical images were assessed for cluster‐wise significance using a cluster defining threshold of p < .05 with family wise error (FWE) and false discovery rate (FDR) correction for multiple testing unless otherwise stated. Brain regions were anatomically localized with the automated anatomical labeling (AAL; Tzourio‐Mazoyer et al., 2002) and cytoarchitectonic probability maps (Eickhoff et al., 2007, 2005). Regions of interest (ROI taken from both sides) were defined by using SPM Anatomy Toolbox (Version 2.2b; Eickhoff et al., 2005).
Statistical analyses were performed with SPSS (22.0.0.2; IBM Corp., Somer, NY), with analysis of variables (ANOVAs) for comparison of groups and condition (stimulation contrasts), post hoc t‐tests and Spearman–Rho nonparametric correlation analyses with behavioral and disease parameters. In some ANOVAs, sphericity requirement was violated. Therefore, we report p‐values with Greenhouse–Geisser correction but report degrees of freedom (df) uncorrected in order to show the factorial analysis design. Statistical comparisons were performed parametric unless stated otherwise.
Multifactorial ANOVA with the above mentioned factors was performed. Significance levels of post hoc t‐tests were Bonferroni corrected for multiple testing (Chumbley, Worsley, Flandin, & Friston, 2010; Chumbley & Friston, 2009). Statistical differences were regarded as significant for probabilities p < .05. Error bars indicate mean values (M) and standard error of mean (SE) unless otherwise stated. A Fisher z‐transform was applied to all correlation maps prior to the statistical analysis. A two‐sample t test was carried out to identify regions of altered connectivity.
3. RESULTS
3.1. Clinical characteristics of the BV group
Subjective disease‐related impairment for the DHI revealed on average 38.6 ± 12.8, and 23.4 ± 14.6 for the VSS (Yardley, Masson, Verschuur, Haacke, & Luxon, 1992). Mean disease duration was 7.9 ± 6.8 (range 1–32.3 years). There was no correlation of any of these scores with disease duration (always p > .2) or the VOR gain.
3.2. Perception threshold
The perception threshold of GVS was higher in BV patients (0.81 ± 0.31 mA) compared to controls (0.48 ± 0.13 mA) (t[41] = −4.45, p < .001). Rating of perceived motion (scale 0–100) was significantly different between the high and low intensity vestibular stimuli (high, low). Patients rated high‐GVS higher (89.5 ± 2.4) than healthy controls (79.4 ± 2.3; p = .004) while low‐GVS was not different (patients: 50.3 ± 4.1; healthy controls: 42.0 ± 4.0; p = .155). Participants reported no pain during GVS. Overall, ratings of the perceived intensities of the different galvanic stimuli were not related to the perceived threshold (correlation coefficients always p > .147), that is, individual thresholds did not allow to predict ratings of individual perceived GVS.
3.3. Vestibulo‐ocular reflex
The mean gain of the patients' horizontal VOR, tested by quantitative head impulse test, was severely reduced (right: 0.26 ± 0.20; left: 0.24 ± 0.16), compared with healthy controls (right: 0.99 ± 0.16; left: 1.02 ± 0.10). Mean of subjective visual vertical did not show pathological tilts (>2.5°) and did not differ between patients and controls, neither for the dynamic nor the static SVV. Dynamic subjective visual vertical (SVV) was obtained by a rotating spherical half‐dome covered with a random pattern of dots. The patients sat in an upright position with the head fixed while the half‐dome in front of them was moving in either cyclorotatory direction (around the line of sight) after which the subjects had to adjust the target rod at the center of the dome from a random offset position to the vertical by means of a potentiometer.
4. IMAGING RESULTS
4.1. Degree centrality
Using whole brain analysis of z‐values of degree centrality (DC), we performed an ANOVA using the factors Stimulation (pre/post) and Group (HC/patients). There was a main effect for Group (FWE and FDR corrected p < .05; Figure 2): Healthy control subjects showed significantly higher DC values predominantly in the right superior and inferior temporal and insular gyrus (Figure 2a and Table 1). Patients showed significantly higher DC values in multiple frontal, parietal and occipital regions and STG predominantly in the left hemisphere (Figure 1b and Table 1). There was also a main effect for Stimulation (GVS) with higher DC‐values in the right Rolandic operculum (F(1,41) = 6.492; p = .015), and the paracentral lobule (F(1,41) = 11.72; p = .001) after GVS in both groups (FWE p < .001 uncorrected at cluster level, peak level: p < .05 corr.; Figure 3a). According to the cytoarchitectonic probability maps (SPM toolbox) the paracentral lobule cluster was found in Area 4A with a 38% probability. This increase in degree centrality values in the right Rolandic operculum after GVS correlated only with the gain of the VOR in BV patients (r = 0.489; p = .024; Figure 3a). There was one region with a significant interaction (F(1,41) = 14.730; p = .001) for Group × Stimulation (p < .001 unc. at cluster level): DC values in right cerebellar Crus 1 increased in patients but decreased in healthy control subjects (Figure 3b). The difference in degree centrality in Crus 1 after GVS significantly increased with longer disease duration (r = 0.486; p = .026), the perceived motion intensity (r = 0.539; p = .012) and with lower VOR gain (r = −0.515; p = .017), that is, the severer the vestibular hypofunction the greater was the increase of DC values in Crus 1 after GVS. There was no correlation with dizziness related scores of disability in daily life (VSS, DHI), SVV, age, or perceptional thresholds (always p > .05). VOR gain was not correlated with perceptional thresholds (GVS; r = 0.25; p = .275).
Figure 2.

Resting state activity using degree centrality analysis (DC). Main effect of group displays significant (FDR and FWE < .05 corrected, k = 10 voxel, whole brain analysis) differences for the contrasts healthy controls > patients in (a) and patients > healthy controls (b). While healthy controls display larger values in right superior temporal/insular regions patients reveal larger DC values in left frontal, parietal, and occipital regions (see Table 1)
Table 1.
Main effect of group: Using whole brain analysis significant group‐related differences (FDR and FWE < .05 corrected for multiple comparisons [cor.]) of degree centrality (DC) are shown for the contrasts healthy controls > patients (upper panel) and patients > healthy controls (lower panel)
| Cluster | Brain region | Cluster size | x | y | z | t value |
|---|---|---|---|---|---|---|
| Degree centrality for the contrast healthy control > patient (FDR and FWE p < .05 corrected) | ||||||
| Cluster 1 | Superior temporal pole (right) | 12 | 57 | 15 | −12 | 8.81 |
| Cluster 2 | Inferior temporal gyrus (right) | 17 | 57 | −60 | −21 | 8.09 |
| Cluster 3 | Heschl gyrus/insula (right) | 10 | 42 | −18 | 12 | 7.78 |
| Degree centrality for the contrast patient > healthy control (FDR and FWE p < .05 corrected) | ||||||
| Cluster 1 | Superior parietal lobule (left) | 72 | −30 | −66 | 63 | 12.02 |
| Superior parietal lobule (left) | −15 | −63 | 69 | 8.65 | ||
| Inferior parietal lobule (left) | −42 | −60 | 57 | 8.50 | ||
| Cluster 2 | Middle frontal gyrus (left) | 13 | −30 | 12 | 66 | 10.80 |
| Middle frontal gyrus (left) | −42 | 12 | 57 | 6.19 | ||
| Cluster 3 | Superior temporal pole (left) | 20 | −42 | 3 | −18 | 9.16 |
| Cluster 4 | Precentral gyrus (right) | 15 | 63 | 12 | 30 | 8.68 |
| Precentral gyrus (right) | 57 | 12 | 42 | 7.41 | ||
| Cluster 5 | Middle frontal gyrus (left) | 32 | −45 | 42 | 30 | 8.60 |
| Inferior frontal gyrus (left) | −51 | 39 | 15 | 8.34 | ||
| Cluster 6 | Cuneus (left) | 10 | −3 | −93 | 33 | 8.12 |
| Cuneus (left) | 0 | −96 | 21 | 6.55 | ||
| Cluster 7 | Lingual gyrus (left) | 27 | 15 | −96 | −18 | 7.89 |
| Cluster 8 | Precentral gyrus (left) | 11 | −42 | −15 | 66 | 7.73 |
| Precentral gyrus (left) | −36 | −9 | 66 | 7.24 | ||
| Cluster 9 | Calcarine gyrus (left) | 9 | 0 | −96 | 9 | 7.49 |
| Cluster 10 | Precuneus (left) | 13 | 0 | −78 | 45 | 7.18 |
| Precuneus (left) | 0 | −69 | 57 | 6.14 | ||
| Cluster 11 | Cuneus (left) | 12 | −3 | −84 | 33 | 6.93 |
| Cluster 12 | Hippocampus (right) | 12 | 18 | −27 | −6 | 6.77 |
| Cluster 13 | Parahippocampal gyrus (left) | 7 | −15 | −18 | −18 | 6.68 |
Figure 3.

Resting state activity using degree centrality analysis (DC). Main effect of stimulation [before (gray columns) vs. after GVS (dark columns)] displays larger DC after GVS in the right Rolandic operculum and paracentral lobule (a, FDR and FWE p < .001 unc., k = 10 voxel; see Table 2). The difference (increase) between DC in the right Rolandic operculum (but not the paracentral lobule) before and after GVS correlates with the gain of the VOR. (b) The significant interaction of DC in the right cerebellum (Crus 1) between groups and stimulation (before and after GVS), that is, the DC difference in Crus 1 before (baseline) and after GVS increases with smaller vestibulo‐ocular reflex (VOR) gain (larger vestibular hypofunction)
Table 2.
Main effect of stimulation (GVS; upper panel) and the interaction group × stimulation (before vs. after GVS, lower panel) are shown for degree centrality (DC) analysis (whole brain, p = .001 unc.)
| Cluster | Brain region | Cluster size | x | y | z | t value |
|---|---|---|---|---|---|---|
| Main effect (degree centrality) for stimulation (GVS) | ||||||
| Cluster 1 | Rolandic operculum (right) | 11 | 48 | −12 | 21 | 4.50 |
| Cluster 2 | Paracentral lobule (left) | 15 | −6 | −24 | 66 | 3.75 |
| Interaction group × stimulation (before vs. after GVS) | ||||||
| Cluster 1 | Cerebellum crus 1 (right) | 19 | 48 | −75 | −27 | 5.30 |
| Cerebellum crus 1 (right) | 51 | −66 | −24 | 3.54 | ||
| Cluster 2 | Cerebellum (right) | 19 | 3 | −24 | −60 | 4.89 |
4.2. Fractional amplitude of low frequency fluctuations
Using whole brain analysis on z‐transformed values of the fALFF, there was a main effect for Group (FWE and FDR corrected p < .05; Figure 4) (F(1, 41) = 9.356; p = .004): Healthy control subjects showed significantly higher fALFF values predominantly in the right Rolandic operculum, SMG, and supplemental motor area (SMA; Figure 4 and Table 3, upper panel). Patients showed significantly larger fALFF values in the right superior and left medial occipital gyrus of the occipital lobe (Figure 4b and Table 3, lower panel). Interestingly, the change of fALFF values after GVS in this region was negatively correlated with the VSS (left: r = −0.692; p = .001; right: r = −0.473 p = .030), that is, the more the fALFF increased after GVS the less patients experienced dizziness‐related limitations in daily life (Figure 4b). Although BV patients do not exhibit increased levels of anxiety (Brandt & Dieterich, 2020) we tried to investigate whether anxiety may have influenced this relation. We correlated the anxiety items of the VSS score (VSS‐A) with the extracted fALFF values of all ROIs with significant group or stimulation effects and used VSS‐A as a covariate. Except for one ROI (left middle occipital gyrus), all group differences and correlations sustained this additional analysis indicating that anxiety, at least anxiety items of the VSS, have no crucial impact on our group differences. In this left middle occipital gyrus [−27–80 15], the ANOVA without covariate VSS‐A revealed a significant main effect of group (F(1,41) = 5.614, p = .023), but no main effect of stimulation (GVS) and no interaction group × stimulation. fALFF values in this ROI were significantly correlated with the VSS (r = −0.692; p = .001).
Figure 4.

Resting state activity using fALFF analysis. Main effect of group (whole brain analysis) shows larger fALFF in the right Rolandic operculum (OP2), the right supramarginal gyrus (SMG), and the paracentral lobule (SMA) for healthy controls (a) and larger fALFF in the visual cortex bilaterally, that is, superior and middle gyrus of the patients‘occipital lobe (b) (p < .001 unc., k = 10 voxel; see Table 3). The fALFF increases after GVS with smaller functional impairment (VSS)
Table 3.
Main effect of group: significant (FWE = 0.05 cor.) group‐related differences of fALFF (whole brain analysis) are shown for the contrasts healthy controls > patients (upper panel) and patients > healthy controls (lower panel)
| Cluster | Brain region | Cluster size | x | y | z | t value |
|---|---|---|---|---|---|---|
| Main effect group (fALFF) for the contrast healthy control > patient (FDR and FWE p < .05 corrected) | ||||||
| Cluster 1 | Rolandic operculum (right) | 21 | 42 | −18 | 15 | 6.56 |
| Cluster 2 | Supplemental motor area (right) | 33 | 12 | −3 | 69 | 5.17 |
| Superior frontal (right) | 18 | −12 | 72 | 4.79 | ||
| Cluster 3 | Supramarginal gyrus (right) | 56 | 63 | −30 | 27 | 4.78 |
| Supramarginal gyrus (right) | 60 | −21 | 27 | 4.51 | ||
| Supramarginal gyrus (right) | 66 | −24 | 21 | 4.48 | ||
| Main effect group (fALFF) for the contrast patient > healthy control (FDR and FWE p < .05 corrected) | ||||||
| Cluster 1 | Superior gyrus, occipital lobe (right) | 41 | 24 | −90 | 21 | 4.71 |
| Cluster 2 | Middle gyrus, occipital lobe (right) | 24 | −27 | −90 | 15 | 4.56 |
Using VSS‐A as a covariate, there was no main effect of group any longer (F(1,36) = 1.619, p = .211), no main effect of VSS‐A (F(1, 36) = 0.111, p = .741) and no main effect of stimulation (pre–post‐GVS) (F(1,36) = 1.290, p = .263) but a significant interaction of stimulation × group (F(1,36) = 8.318, p = .007) and an interaction of stimulation × VSS‐A (F(1,36) = 6.427, p = .016]. Accordingly, fALFF‐values in this left medial occipital ROI were also correlated with the VSS‐A (r = 0.535; p = .015). In contrast, the group effect in the ROI in the right superior occipital gyrus survived significant (F(1,36) = 7.300, p = .010) and fALFF‐values continued to correlate with the VSS (r = −0.473; p = .030) but not the VSS‐A (r = −0.154; p = .518). Thus, only in this single ROI of the left early visual cortex, anxiety items of the VSS showed an impact on the 2 × 2 factorial model of the analyses.
Otherwise, the change of fALFF values in the occipital lobe after GVS was not correlated with VOR gain, SVV, DHI, disease duration, age, or perceptional thresholds (p always >.1).
There was a main effect for Stimulation with larger fALFF values in two regions of the right STG after GVS in both groups (FWE p < .001 uncorrected at cluster level, peak level: FWE p < .05; Figure 5a and Table 4) (F(1,42) = 10.352, p < .003). According to the cytoarchitectonic probability maps (SPM Anatomy toolbox), the clusters were found in the STG, one (66–39 15) in the inferior parietal lobule with a 57% probability. This increase in fALFF values after GVS was not correlated with VOR gain, disease duration, age, threshold or perceived dizziness intensity (p always >0.1).
Figure 5.

Main effect (fALFF) of stimulation [baseline (gray columns) vs. after GVS (dark columns)] displays larger fALFF after GVS in the right superior temporal gyrus (a, p < .001 uncor., k = 10 voxel; see Table 4). (b) The significant interaction of fALFF between groups and stimulation (before and after GVS) in the right calcarine gyrus: while fALFF increases in patients it decreases in healthy control subjects after GVS
Table 4.
Main effect of stimulation (GVS; upper panel) and the interaction group × stimulation (before vs. after GVS, lower panel) are shown for the fALFF (p = .001 unc.)
| Cluster | Brain region | Cluster size | x | y | z | t value |
|---|---|---|---|---|---|---|
| Main effect (fALFF) for stimulation (GVS) patient > control | ||||||
| Cluster 1 | Superior temporal gyrus (right) | 10 | 69 | −18 | 0 | 4.48 |
| Cluster 2 | Superior temporal gyrus (right) | 15 | 66 | −39 | 15 | 4.23 |
| Superior temporal gyrus (right) | 63 | −33 | 9 | 4.14 | ||
| Main effect (fALFF) for stimulation (GVS) control > patient | ||||||
| None | ||||||
| fALFF: Interaction group × stimulation (baseline vs. after GVS) | ||||||
| Cluster 1 | Calcarine sulcus (right) | 7 | 27 | −93 | 0 | 4.12 |
| Calcarine sulcus (right) | 6 | 12 | −78 | 3 | 4.06 | |
There was a significant interaction for Group × Stimulation in two regions of the right calcarine sulcus (Table 4; p < .001 unc. at cluster level): fALFF values increased after GVS in patients but decreased in healthy control subjects (Figure 5b) (F(1,41) = 4.725; p = .03) and (F(1,41) = 4.250; p = .04), respectively. The difference in fALFF in right calcarine sulcus after GVS was not correlated with the VOR gain, SVV, VSS, DHI, disease duration, age, threshold or perceived motion by GVS(p always >0.1).
4.3. Seed‐based functional connectivity
There was no main effect of Group on seed‐based functional connectivity for the different seeds (Table 5). However, there was a main effect for Group × Stimulation (GVS), that is, patients did not show increases of FC in several regions (Figure 6 and Table 5) following GVS as HC subjects did, particularly in neighboring multisensory structures involved in vestibular and spatial processing (STG and inferior parietal lobule), higher visual processing areas engaged in visual cognition (lingual, fusiform gyrus and precuneus) and the cerebellum. There were no GVS‐induced FC increases in patients as compared to healthy control subjects. Interestingly, the significant visual–vestibular FCs were largely identified on the left brain side (Table 5). The group‐related FC differences (post > pre‐GVS) were not correlated with the VOR gain, SVV, VSS, DHI, disease duration, age, threshold or perceived motion by GVS (p always > .1).
Table 5.
Functional connectivity (FC) for the group contrasts (control > patient; patient > control) and their interaction with galvanic vestibular stimulation (post > pre‐GVS, pre > post‐GVS) is shown, using p < .05 FWE and p < .05 FDR corrected for multiple comparisons): FC[Control(post > pre‐GVS)] > FC[Patient(post > pre‐GVS)]
| Functional connectivity (FC; all FDR and FWE p < .05 corrected) | |||||||||
|---|---|---|---|---|---|---|---|---|---|
| Seed | x | y | z | Brain region | Cluster size | x | y | z | t value |
| Healthy control > patient | |||||||||
| None | |||||||||
| Healthy control > patient and post‐GVS > pre‐GVS | |||||||||
| Central insula | −36 | 0 | −4 | Superior medial frontal gyrus | 95 | −9 | 63 | 30 | 5.04 |
| Precuneus | 65 | −12 | 54 | −15 | 4.48 | ||||
| Cerebellar crus 1 | 77 | −24 | −72 | −30 | 4.44 | ||||
| Superior frontal gyrus | 62 | 18 | 66 | 24 | 4.42 | ||||
| Precuneus | 113 | 0 | −63 | 21 | 4.42 | ||||
| Central insula | 42 | 4 | −8 | Middle frontal gyrus | 78 | −27 | 21 | 36 | 6.73 |
| Parietal operculum (OP1) | −46 | −14 | 12 | Inferior temporal gyrus | 382 | −45 | −42 | −18 | 5.70 |
| Inferior frontal tri. | 187 | −45 | 15 | 30 | 5.51 | ||||
| Lingual gyrus | 637 | 6 | −78 | −6 | 5.43 | ||||
| Anterior orbitofrontal cortex | 72 | −21 | 33 | −18 | 5.29 | ||||
| Postcentral gyrus | 89 | 63 | −6 | 33 | 4.91 | ||||
| Inferior parietal lobule | 250 | −39 | −51 | 60 | 4.73 | ||||
| Middle occipital gyrus | 162 | 30 | −81 | 15 | 4.62 | ||||
| Superior medial frontal gyrus | 49 | −9 | 63 | 33 | 4.52 | ||||
| Fusiform gyrus | 54 | 24 | −54 | −15 | 4.39 | ||||
| Parietal operculum (OP2) | −38 | −20 | 16 | Postcentral gyrus | 72 | 63 | −6 | 30 | 4.93 |
| Middle temporal gyrus | 109 | −57 | −60 | 6 | 4.90 | ||||
| SMA | 107 | 6 | −15 | 60 | 4.84 | ||||
| Cerebellum (VI) | 78 | 24 | −69 | −33 | 4.74 | ||||
| Precentral gyrus | 55 | −51 | −3 | 42 | 4.72 | ||||
| Hippocampus | 52 | −33 | −12 | −12 | 4.42 | ||||
| Parietal operculum (OP4) | −52 | 2 | 2 | Cuneus | 67 | −9 | −90 | 27 | 4.86 |
| Postcentral | 78 | −45 | −15 | 48 | 4.59 | ||||
| Postcentral | 91 | 57 | −6 | 33 | 4.49 | ||||
| Fusiform gyrus | 121 | −21 | −78 | −12 | 4.32 | ||||
| Inferior frontal operculum | 56 | −33 | 12 | 30 | 4.28 | ||||
| Inferior parietal lobule | −46 | −32 | 22 | Lingual gyrus | 73 | −21 | −63 | −9 | 4.48 |
| Posterior insula (lg2) | 38 | −18 | 6 | Precuneus | 140 | 0 | −42 | 57 | 5.17 |
| Cuneus | 179 | −3 | −78 | 33 | 4.70 | ||||
| Lingual gyrus | 73 | 0 | −78 | −3 | 4.45 | ||||
| Superior frontal gyrus | 71 | −24 | 33 | 45 | 4.37 | ||||
| Posterior insula (lg2) | −40 | −16 | 14 | Putamen | 55 | −33 | −21 | −3 | 5.62 |
| Middle temporal gyrus | 97 | −54 | −60 | 6 | 5.56 | ||||
| Fusiform gyrus | 109 | 21 | −54 | −15 | 4.88 | ||||
| Cerebellum (VI, Crus I) | 78 | 24 | −69 | −33 | 4.76 | ||||
| Cerebellum (VI, Crus I) | 107 | −9 | −75 | −12 | 4.56 | ||||
| Premotor cortex (BA6) | 48 | 4 | 50 | Supramarginal gyrus | 115 | −51 | −48 | 24 | 4.22 |
| FC for patient > healthy control | |||||||||
| None | |||||||||
| FC for healthy patient > healthy control and post‐GVS > pre‐GVS | |||||||||
| None | |||||||||
Note: Coordinates of all analyzed seeds (ROIs of core vestibular processing) have been derived from the SPM Anatomy Toolbox (Version 2.2b, Eickhoff et al., 2005) and the literature (Eickhoff, Weiss, Amunts, Fink, & Zilles, 2006; zu Eulenburg et al., 2012), as listed in Table S1. Seeds in the OP1/2 and OP4, inferior parietal lobule and medial prefrontal cortex of the right hemisphere did not reveal significant FC values to any brain region and were therefore displayed in the table. Only seeds with significant FC‐values (bold in Table S1) are displayed in Figure 5). Negative x‐coordinate indicates left hemisphere.
Figure 6.

Main effect of functional connectivity for group (Healthy control>patient) × stimulation (GVS; post > pre) is shown (using the threshold of p < .05 FWE and p < .05 FDR cor.): FC[Control(post > pre‐GVS)] > FC[Patient(post > pre‐GVS)]. The other comparisons did not reveal significant differences (Table 5). Seeds are displayed color‐coded at the bottom on axial slices. The regions to which a particular seed reveals significant FC values are displayed in the same color of that particular seed. There was a significant FC increase from seeds in left inferior parietal lobule (IPL) (a) to left lingual gyrus; in the left central insula (b) to orbitofrontal cortex, cerebellum and precuneus; in the left posterior insula (c) to putamen, fusiform gyrus and cerebellum; and right (d) posterior insula (lg2) to precuneus and lingual gyrus; that is, areas engaged in visual cognition and memory and cerebellum
5. DISCUSSION
We tested the hypothesis that an appropriate vestibular stimulation (GVS) of the deficient vestibular system in BV patients is able to modulate the patients' abnormal resting state brain activity and that a change is related to disease parameters (functional and perceptional impairment). We investigated rs‐fMRI changes in BV patients and healthy controls before and after GVS by using different methods of analysis (DC, fALFF, FC) and subsequently performed rs‐fMRI‐behavior correlations in order to get insight into the functional meaning of the changes.
5.1. Main findings
Compared to healthy control subjects, resting state brain activity of BV patients was (i) smaller in vestibular core regions, including the right Rolandic operculum (OP2, STG, SMG, IPL; Eickhoff et al., 2006; zu Eulenburg et al., 2012), the parietoinsular vestibular cortex (PIVC) and posterior insula cortex (PIC; Frank & Greenlee, 2018) but (ii) larger in several fronto‐parietal and occipital (visual) brain areas. (iii) GVS increased resting state brain activity in the STG and the Rolandic operculum (SMG, OP2) in both groups. In BV patients this increase became stronger with more severe vestibular hypofunction (VOR gain), which is in accord with our first hypothesis (see Introduction). (iv) There were group‐specific changes in resting state brain activity after GVS: in cerebellar Crus 1 of the BV patients the DC increased with stronger vestibular hypofunction and in the patients' visual cortex the fALFF correlated with the degree of their subjective dizziness‐related impairment (VSS), which is in contrast to our second hypothesis. (v) Compared to healthy controls, patients did not show a GVS‐induced increase of functional connectivity (FC) between parietoinsular cortex and (higher) visual areas (precuneus, lingual, fusiform gyrus).
5.2. Methodical considerations on the different rs‐fMRI analyses
In contrast to seed‐based FC looking for a particular region, degree centrality (DC) measures the total number of connections a brain region has, irrespective of its importance and the position of this region within the functional network (Zuo et al., 2012). It can be calculated by voxel degree maps correlating the temporal BOLD signal fluctuation of each voxel with all other voxels in the brain and counting the number of connections above a certain threshold (Gottlich et al., 2014; Zuo et al., 2012). Nodes with a high number of connections (“hub”) have been shown to be related to disease parameters, for example, in Parkinson's disease in which the higher connectedness within the sensorimotor modules compensated for the deficient striato‐cortical motor loops (Gottlich et al., 2013). While BV patients showed DC increase in nonvestibular network nodes (i.e., visual, somatosensory network) compared to healthy controls, they had a smaller number of connections in the right Rolandic operculum and cerebellar Crus 1.
Another technique of assessing regional alteration within a functional network is given by the amplitude of low frequency fluctuations (ALFF) as it detects regional changes in the magnitude of spontaneous neuronal activity (Yang et al., 2007; Zang et al., 2007). Due to ALFF susceptibility for physiological noise artifacts we preferred to use the fractional ALFF (fALFF) as a more robust analysis for regional spontaneous brain activity (Zou et al., 2008). In fact, fALFF analysis has been identified as the most sensitive measure in a recent multimethod analyzing approach using rs‐fMRI (Al‐Zubaidi, Heldmann, Mertins, Jauch‐Chara, & Munte, 2018). Moreover, the fALFF may even allow predictions with regard to task‐related fMRI activations (Novitskiy et al., 2011). The clinical meaning of fALFF has been shown by several groups in various brain diseases (Al‐Zubaidi et al., 2018; Kublbock et al., 2014; Wang et al., 2018; Zuo et al., 2010). A reduced LFF measured at a specific cortical region may be related to a deficient performance in a task that functionally involves this region. Similar to DC, there was a consistently reduced fALFF measured in the right Rolandic operculum (including OP2) of our BV patients and in addition in their visual cortex. The latter may reflect a local disruption from long‐range neuronal network activity which is clinically meaningful as dizziness severity in patients increase the larger this disruption (i.e., the lower the fALFF) becomes.
We used classical seed‐based functional connectivity (FC) analysis of coherent spontaneous low‐frequency fluctuations (LFF) of the blood‐oxygen‐level‐dependent (BOLD) fMRI signal (Biswal et al., 1995; Fox & Raichle, 2007) to identify altered connectivities from core regions of vestibular processing, specifically the Rolandic operculum (Frank & Greenlee, 2018; Lopez, Blanke, & Mast, 2012; zu Eulenburg et al., 2012). By extracting the time course of the LFF from the seed region in the Rolandic operculum, there was a significant temporal coherence (synchronicity) with the LFF of other voxels in the brain [as a hint of a “functional network” (Cordes et al., 2000; Lowe, Mock, & Sorenson, 1998)] only when the effect of GVS on FC was included in the group comparison (significant interaction). In contrast to healthy subjects, GVS was not able to induce an increase of FC between parietoinsular cortex and visual cognition areas (lingual, fusiform gyrus) in BV patients.
5.3. Brain responsivity to sensory stimulation in BV
It is well known that sensory deprivation may change resting state brain activity leading to new clinical symptoms, for example, tinnitus in hearing loss (Elgoyhen, Langguth, De Ridder, & Vanneste, 2015; Vanneste & De Ridder, 2016) or visual hallucination in Charles Bonnet syndrome (Martial et al., 2019). This may reflect structural and/or functional cortical reorganization after deafferentation. Therapeutic trials to relieve subjects from the consequences of sensory deafferentation aim to bypass the impaired sensory system by strengthening other intact sensory systems (“substitution”; Cutfield et al., 2014) or to stimulate the affected organ with different techniques, that is, artificial (vestibular) implants or nerve stimulation at sites remote from the affected organ. While multisensory stimulation is the common therapeutic principle in vestibular rehabilitation, electrical stimulation is a new promising approach in clinical vestibular research. GVS is a well‐known technique to stimulate the vestibular afferents in the attempt to examine vestibular processing in brain regions (Bense et al., 2001; Cyran et al., 2016; Helmchen et al., 2019; Lobel et al., 1998; Lopez et al., 2012; Stephan et al., 2005). Vestibular implants are developed to substitute the vestibular afferents activity during natural head movements (Fornos et al., 2017; van de Berg et al., 2017). As a prerequisite for a therapeutic stimulation, however, it is crucial to know whether abnormal brain responsivity to artificial vestibular stimulation (GVS, vestibular implant) in BV is maladaptive or potentially beneficial and how it is related to (altered) resting state brain activity.
Using GVS, we recently showed pronounced neural activity with steep stimulus–response functions in core cortical regions of vestibular processing in BV, nearly indistinguishable from healthy controls, and significantly stronger in the STG and early visual cortex (Helmchen et al., 2019). As GVS‐induced neural activity in both regions increased with dizziness‐related disability, this neural plasticity was suggested to be maladaptive. Functional plasticity in the visual cortex has been demonstrated in BV, with increases of cortical excitability during visual (optokinetic) stimulation (Dieterich et al., 2007) but reduced responsivity (excitability by transcranial magnetic stimulation) in a visual motion adaptation paradigm (Ahmad et al., 2017) which may be related to clinically meaningful attempts to suppress oscillopsia, for example, by reducing visual motion processing (Grunbauer, Dieterich, & Brandt, 1998) or raising motion coherence thresholds (Kalla et al., 2011). Unfortunately, we did not record subjective or behavioral parameters (e.g., rod and disk task) of visual motion sensitivity that could potentially have influenced our results and should be considered in future studies. On the behavioral level, for example, increased excitability of the visual cortex is associated with the development of visual vertigo (Cousins et al., 2017). Furthermore, greater visual dependence turned out to be a predictor for poorer recovery in patients with vestibular diseases (Cousins et al., 2014). Adaptive mechanisms in the early visual cortex were revealed by reduced BOLD signal changes after combined visual–vestibular stimulation, that is, they were negatively correlated with the functional status of vestibulopathy as assessed by clinical questionnaires (Roberts et al., 2018). As this adaptation was confined to conditions where the visual and vestibular stimuli were co‐directional (congruent condition, signaling self‐motion in the same direction), abnormal visual–vestibular interaction may account for increased GVS‐evoked activity in the early visual cortex of BV patients (Helmchen et al., 2019).
Reciprocal inhibitory visual–vestibular interaction is physiological (Brandt et al., 1998) to disentangle the ambiguity when visual and vestibular stimulation is contradictory (Roberts et al., 2017): congruent visual and vestibular information results in preferential visual cortex activation while contradictory cues for self‐motion assessment activates vestibular processing areas. Thereby, visual–vestibular interaction crucially contributes to the perception of self‐motion and spatial orientation. The suppression of PIVC is strongly influenced by attention to visual stimuli and thereby dissociates PIVC from the posterior insular cortex (PIC) being activated by visual stimuli related to self‐motion (Frank & Greenlee, 2018).
In BV patients, conventional vestibular caloric stimulation has been shown to reduce neural activity in the parietoinsular vestibular cortex, as revealed by PET brain imaging (H2O15; Bense et al., 2004). In the latter study, physiological reciprocal visuo‐vestibular interaction was shown to be reduced in BV patients, since deactivation of the visual cortex was smaller compared to healthy controls. Caloric vestibular stimulation has been shown to directly modulate the cortical excitability in motion sensitive areas V5/MT but not in early visual cortices of healthy subjects as assessed by lowering thresholds of phosphene detection via TMS pulses (Seemungal et al., 2013). The authors suggest that this unique vestibular contribution to visual cortex areas involved in visual motion may optimize visual form perception and suppresses visual evoked activity when it is incompatible with the vestibular stimulus.
Exciting the vestibular nerve by GVS in BV patients, however, elicited stronger activity in the STG and the early visual cortex (but not V5/MT) of BV patients (Helmchen et al., 2019) which is in line with abnormal (though functionally compensatory) visual–vestibular interaction in BV patients. Larger GVS induced activation of vestibular cortex regions should normally be associated with a greater deactivation of the visual cortex. In the current resting state activity study, we could not identify significant group‐related differences in FC between the Rolandic operculum as a vestibular core region and the visual cortex, noticeably in the absence of GVS.
5.4. GVS‐induced changes of resting state brain activity in BV
In the absence of sensory stimulation we previously investigated resting‐state brain activity in BV and found lower bilateral functional connectivity in the posterior insula and parietal operculum but higher connectivity in the posterior cerebellum compared to controls, which indicated a beneficial mechanism of adaptation as it increased with the adaptive capacity to modulate the VOR during active head movements (Gottlich et al., 2014). In line with our previous study, both analytic approaches (DC and fALFF) in the current study revealed reduced activity in the patients' right Rolandic operculum [DC: posterior insula, STG; fALFF: OP2, SMG). The right‐dominance is in accordance with the cortical vestibular representation in the nondominant hemisphere of our right‐handed participants (Dieterich et al., 2003; Dieterich, Kirsch, & Brandt, 2017; Lopez et al., 2012). Specifically, the right STG, the SMG, the lower rim of the inferior parietal lobule and the OP2 constitute core regions of the cortical network processing vestibular signals (Cyran et al., 2016; Eickhoff et al., 2006; Frank & Greenlee, 2018; Gottlich et al., 2014; Kirsch et al., 2018). We regard the decreased activity in the right parietal operculum as clinically meaningful because it was larger in patients with higher dizziness scores (VSS) and longer disease duration.
Interestingly, both techniques of analysis (DC, fALFF) revealed two consistent findings in the right Rolandic operculum: (i) there was larger resting state brain activity in healthy control subjects than in BV patients, but (ii) it increased in both groups after GVS without a significant group difference. In analogy, despite the reduced baseline level of brain activity and the chronically missing vestibular input in BV patients, the right Rolandic operculum responded to vestibular stimulation (GVS) in an event‐related fMRI design equally to healthy control subjects (Helmchen et al., 2019). Noticeably, the increase of resting state brain activity (DC) in our patients' right Rolandic operculum after GVS was related to the peripheral vestibular function: it was larger with less impaired vestibular function (higher VOR gain). This could simply indicate that weaker vestibular input leads to smaller changes of resting brain state activity or a better utilization of cortical vestibular signals for resting state brain activity with less impaired VOR in BV. From a clinical perspective, this could be one argument in favor for an early vestibular implant surgery in progressive BV once the deficient input during natural head movements in BV patients is considered to be substituted. However, as this GVS‐induced increase of resting state was not related to behavioral /perceptional parameters, the clinical meaning awaits further studies. It may simply reflect a non‐vestibular bottom‐up signal.
In addition, resting state brain activity was lower in the patients' anterior part of the paracentral lobule (DC) and adjacent SMA (fALFF), unrelated to perceptional or behavioral parameters. It has been suggested that preSMA could be involved in switching between perceptual states of real world and self‐motion (Roberts et al., 2017). Hypofunction of SMA may impair the ability to switch between different response plans resulting in unsteadiness (Roberts & Husain, 2015; Rushworth, Passingham, & Nobre, 2002). The paracentral lobule (parietal BA5) is related to the initiation of body movements in space and eye movements. As we controlled fixation during MRI scans a relation to (involuntary) eye movements is unlikely. It is unknown yet whether BV patients have difficulties in the initiation of body movements. In turn, BV patients showed increased resting state activity (DC) in various parts of the fronto‐parietal network that may serve for substituting deficient vestibular input.
Including the GVS‐related changes of into the group comparison (interaction analysis), resting state brain activity differed in two regions: in the cerebellum (DC analysis) and the visual cortex (fALFF analysis). Cerebellar Crus I is functionally related to the judgment of spatial cognition (Stoodley, 2012) and orientation (Lee et al., 2005), probably based on its strong projections to the posterior cingulate cortex, lateral temporal cortex, inferior parietal lobule, and medial prefrontal cortex (Bernard et al., 2012; Buckner, Krienen, Castellanos, Diaz, & Yeo, 2011), particularly the angular gyrus in the inferior parietal cortex which represents awareness that an intended action is consistent with the movement consequences and the awareness of the authorship of the action (Farrer et al., 2008). The angular gyrus and contiguous temporoparietal junction was found to be the crucial lesion site in an acute lesion study in which vestibular‐guided whole‐body spatial orientation was impaired (Kaski et al., 2016).
We previously showed that increase in resting state activity in Crus 1 of BV patients correlated with the degree by VOR modulation by active (self‐guided) head movements as a potential compensatory mechanism to improve the awareness of self‐initiated movements (Gottlich et al., 2014). BV patients showed increased cerebellar Crus I BOLD activity during virtual spatial navigation within the conceivable attempt to counteract subclinical navigational deficits, which have been found in some but not other studies of BV patients (Jandl et al., 2015; Kremmyda et al., 2016). In contrast to healthy controls, GVS induced an increase in resting state activity (DC) in our patients' cerebellar Crus I which became stronger with the severity of vestibular hypofunction (VOR gain). Thus, not the Rolandic operculum but rather the cerebellum seems to increase its resting state activity after GVS stronger than HC subjects possibly to initiate compensatory, clinically beneficial adaptation processes in BV. Due to the impaired vestibular input, the patients‘cerebellar Crus I could be more engaged in monitoring the sensory information for updating mental representation of space by filtering predictable from unpredictable components of sensory signals to provide a novelty stimulus input to cortical navigation circuits (Rondi‐Reig, Paradis, Lefort, Babayan, & Tobin, 2014). Alternatively, increased resting state activity in Crus I might be another attempt to counteract the absent increase of functional connectivity from the parietal operculum (OP1, Op4) and posterior insula to the cerebellum (FC analysis).
The visual cortex showed two remarkable group differences. First, BV patients showed significantly larger fALFF‐values than healthy controls in bilateral occipital regions. After GVS, resting state activity in the calcarine cortex increased in patients but decreased in healthy subjects. Second, these changes after GVS were correlated with clinical scores: the increase after GVS was stronger the less the patients were handicapped (VSS). It is tempting to speculate that the higher responsitivity in the visual cortex to GVS (Helmchen et al., 2019) is related to this increased resting state activity (fALFF). However, the behavioral consequences differ: The increase of the higher responsitivity of the visual cortex during GVS with higher dizziness‐related handicap scores of BV patients (Helmchen et al., 2019) seems to be maladaptive. Oscillopsia in BV patients results from impaired gaze stabilization (i.e., impaired VOR) during locomotion. Increased responsitivity in the visual cortex to visual cues would therefore worsen this problem. Accordingly, downregulation of visual cortex responsivity to visual cues plays an important adaptive role in the suppression of visuo‐vestibular symptoms (Brandt et al., 1998; Roberts et al., 2017). Elevating perception threshold to visual motion and the increase of tolerance to retinal slip are known mechanisms of adaptation (Shallo‐Hoffmann & Bronstein, 2003) which has been shown in patients with BV (Kalla et al., 2011). This, however, would be expected to be rather reflected by reduced responsitivity to visual cues. Vestibular stimuli also activate the visual cortex, specifically the visual motion sensitive V5/MT region (Seemungal et al., 2013). Its function has been related to visual form perception which has not been tested in BV yet. The altered excitability (attenuated phosphene detection threshold) to caloric vestibular stimulation was found in V5/MT but not in the early visual areas (Helmchen et al., 2019) consistent with GVS‐related increases of resting state activity in our current study. Functionally, the increase in resting state activity (fALFF) was negatively correlated with the severity of dizziness (VSS) which might indicate another compensatory process of visual substitution (Dieterich et al., 2007) as responsitivity after GVS increased the less patients felt dizzy. It may therefore be beneficial in the case of continuous vestibular stimulation by vestibular implants during natural head movements. Resting state brain activity should be considered when abnormal visual–vestibular interaction is evaluated and symptoms of visual vertigo and anxiety (Bednarczuk et al., 2020) should be assessed and related to changes of resting state activity, potential cofactors which we did not explicitly studied here.
Using the core vestibular regions (posterior and central insula, OP2, STG, IPL; Frank & Greenlee, 2018; zu Eulenburg et al., 2012) as seeds, we did not find a reduction of FC to the early visual cortices in BV as a potential explanation for the pathologically concomitant GVS‐evoked activity in the vestibular and visual cortex. This contradicts our initial hypothesis. However, FC from vestibular network seeds to associate visual cortex areas (precuneus, lingual and fusiform gyrus) was increased in HC subjects after GVS. The precuneus on the medial surface of the superior parietal lobule is engaged in visuospatial processing, attention, episodic memory retrieval, working memory and conscious perception (Oshio et al., 2010). It connects with visual areas in the cuneus and primary visual cortex and it is engaged in the encoding of visuospatial representations into the long‐term memory (Schott et al., 2019). The reduced capacity to increase FC to these regions after GVS in BV patients might contribute to their mild spatial memory deficits (C. Lopez, oral communication). Moreover, FC from the healthy subjects‘Rolandic operculum to the medial occipitotemporal gyrus (lingual gyrus) and fusiform gyrus was higher than in patients but only after GVS. These structures are engaged in visual memory (Machielsen, Rombouts, Barkhof, Scheltens, & Witter, 2000) and selective visual spatial attention (Mangun, Buonocore, Girelli, & Jha, 1998). It will be of interest in future studies if this lacking increase in FC after GVS contributes to visually induced dizziness in BV patients and whether it can be reversed by artificial vestibular stimulation (GVS, vestibular implant) as the group difference was not found when the GVS effect was not taken into consideration.
Supporting information
Table S1 Functional connectivity (FC; seeds).
Helmchen C, Machner B, Rother M, Spliethoff P, Göttlich M, Sprenger A. Effects of galvanic vestibular stimulation on resting state brain activity in patients with bilateral vestibulopathy. Hum Brain Mapp. 2020;41:2527–2547. 10.1002/hbm.24963
DATA AVAILABILITY STATEMENT
Data can be made available on request.
REFERENCES
- Ahmad, H. , Roberts, R. E. , Patel, M. , Lobo, R. , Seemungal, B. , Arshad, Q. , & Bronstein, A. (2017). Downregulation of early visual cortex excitability mediates oscillopsia suppression. Neurology, 89(11), 1179–1185. 10.1212/WNL.0000000000004360 [DOI] [PMC free article] [PubMed] [Google Scholar]
- Al‐Zubaidi, A. , Heldmann, M. , Mertins, A. , Jauch‐Chara, K. , & Munte, T. F. (2018). Influences of hunger, satiety and Oral glucose on functional brain connectivity: A multimethod resting‐state fMRI study. Neuroscience, 382, 80–92. 10.1016/j.neuroscience.2018.04.029 [DOI] [PubMed] [Google Scholar]
- Bednarczuk, N. F. , Bonsu, A. , Ortega, M. C. , Fluri, A. S. , Chan, J. , Rust, H. , … Arshad, Q. (2019). Abnormal visuo‐vestibular interactions in vestibular migraine: A cross sectional study. Brain, 142(3), 606–616. 10.1093/brain/awy355 [DOI] [PMC free article] [PubMed] [Google Scholar]
- Bednarczuk, N. F. , Bradshaw, J. M. , Mian, S. Y. , Papoutselou, E. , Mahmoud, S. , Ahn, K. , … Arshad, Q. (2020). Pathophysiological dissociation of the interaction between time pressure and trait anxiety during spatial orientation judgments. European Journal of Neuroscience. 10.1111/ejn.14680 [DOI] [PubMed] [Google Scholar]
- Bense, S. , Deutschlander, A. , Stephan, T. , Bartenstein, P. , Schwaiger, M. , Brandt, T. , & Dieterich, M. (2004). Preserved visual–vestibular interaction in patients with bilateral vestibular failure. Neurology, 63(1), 122–128. [DOI] [PubMed] [Google Scholar]
- Bense, S. , Stephan, T. , Yousry, T. A. , Brandt, T. , & Dieterich, M. (2001). Multisensory cortical signal increases and decreases during vestibular galvanic stimulation (fMRI). Journal of Neurophysiology, 85(2), 886–899. [DOI] [PubMed] [Google Scholar]
- Bernard, J. A. , Seidler, R. D. , Hassevoort, K. M. , Benson, B. L. , Welsh, R. C. , Wiggins, J. L. , … Peltier, S. J. (2012). Resting state cortico‐cerebellar functional connectivity networks: A comparison of anatomical and self‐organizing map approaches. Frontiers in Neuroanatomy, 6, 31 10.3389/fnana.2012.00031 [DOI] [PMC free article] [PubMed] [Google Scholar]
- Biswal, B. , Yetkin, F. Z. , Haughton, V. M. , & Hyde, J. S. (1995). Functional connectivity in the motor cortex of resting human brain using echo‐planar MRI. Magnetic Resonance in Medicine: Official Journal of the Society of Magnetic Resonance in Medicine/Society of Magnetic Resonance in Medicine, 34(4), 537–541. [DOI] [PubMed] [Google Scholar]
- Brandt, T. , Bartenstein, P. , Janek, A. , & Dieterich, M. (1998). Reciprocal inhibitory visual–vestibular interaction. Visual motion stimulation deactivates the parieto‐insular vestibular cortex. Brain, 121(Pt 9), 1749–1758. [DOI] [PubMed] [Google Scholar]
- Brandt, T. , & Dieterich, M. (2020). “Excess anxiety” and “less anxiety”: Both depend on vestibular function. Current Opinion in Neurology, 33(1), 136–141. 10.1097/WCO.0000000000000771 [DOI] [PubMed] [Google Scholar]
- Brandt, T. , Schautzer, F. , Hamilton, D. A. , Bruning, R. , Markowitsch, H. J. , Kalla, R. , … Strupp, M. (2005). Vestibular loss causes hippocampal atrophy and impaired spatial memory in humans. Brain: A Journal of Neurology, 128(Pt 11), 2732–2741. 10.1093/brain/awh617 [DOI] [PubMed] [Google Scholar]
- Buckner, R. L. , Krienen, F. M. , Castellanos, A. , Diaz, J. C. , & Yeo, B. T. (2011). The organization of the human cerebellum estimated by intrinsic functional connectivity. Journal of Neurophysiology, 106(5), 2322–2345. 10.1152/jn.00339.2011 [DOI] [PMC free article] [PubMed] [Google Scholar]
- Cai, J. , Lee, S. , Ba, F. , Garg, S. , Kim, L. J. , Liu, A. , … McKeown, M. J. (2018). Galvanic vestibular stimulation (GVS) augments deficient pedunculopontine nucleus (PPN) connectivity in mild Parkinson's disease: fMRI effects of different stimuli. Frontiers in Neuroscience, 12, 101 10.3389/fnins.2018.00101 [DOI] [PMC free article] [PubMed] [Google Scholar]
- Chumbley, J. , Worsley, K. , Flandin, G. , & Friston, K. (2010). Topological FDR for neuroimaging. NeuroImage, 49(4), 3057–3064. 10.1016/j.neuroimage.2009.10.090 [DOI] [PMC free article] [PubMed] [Google Scholar]
- Chumbley, J. R. , & Friston, K. J. (2009). False discovery rate revisited: FDR and topological inference using Gaussian random fields. NeuroImage, 44(1), 62–70. 10.1016/j.neuroimage.2008.05.021 [DOI] [PubMed] [Google Scholar]
- Cordes, D. , Haughton, V. M. , Arfanakis, K. , Wendt, G. J. , Turski, P. A. , Moritz, C. H. , … Meyerand, M. E. (2000). Mapping functionally related regions of brain with functional connectivity MR imaging. AJNR. American Journal of Neuroradiology, 21(9), 1636–1644. [PMC free article] [PubMed] [Google Scholar]
- Cousins, S. , Cutfield, N. J. , Kaski, D. , Palla, A. , Seemungal, B. M. , Golding, J. F. , … Bronstein, A. M. (2014). Visual dependency and dizziness after vestibular neuritis. PLoS One, 9(9), e105426 10.1371/journal.pone.0105426 [DOI] [PMC free article] [PubMed] [Google Scholar]
- Cousins, S. , Kaski, D. , Cutfield, N. , Arshad, Q. , Ahmad, H. , Gresty, M. A. , … Bronstein, A. M. (2017). Predictors of clinical recovery from vestibular neuritis: A prospective study. Annals of Clinical Translational Neurology, 4(5), 340–346. 10.1002/acn3.386 [DOI] [PMC free article] [PubMed] [Google Scholar]
- Cutfield, N. J. , Scott, G. , Waldman, A. D. , Sharp, D. J. , & Bronstein, A. M. (2014). Visual and proprioceptive interaction in patients with bilateral vestibular loss. Neuroimage Clinic, 4, 274–282. 10.1016/j.nicl.2013.12.013 [DOI] [PMC free article] [PubMed] [Google Scholar]
- Cyran, C. A. , Boegle, R. , Stephan, T. , Dieterich, M. , & Glasauer, S. (2016). Age‐related decline in functional connectivity of the vestibular cortical network. Brain Structure & Function, 221(3), 1443–1463. 10.1007/s00429-014-0983-6 [DOI] [PubMed] [Google Scholar]
- Devantier, L. , Hansen, A. K. , Molby‐Henriksen, J. J. , Christensen, C. B. , Pedersen, M. , Hansen, K. V. , … Borghammer, P. (2019). Positron emission tomography visualized stimulation of the vestibular organ is localized in Heschl's gyrus. Human Brain Mapping, 41, 185–193. 10.1002/hbm.24798 [DOI] [PMC free article] [PubMed] [Google Scholar]
- Dieterich, M. , Bauermann, T. , Best, C. , Stoeter, P. , & Schlindwein, P. (2007). Evidence for cortical visual substitution of chronic bilateral vestibular failure (an fMRI study). Brain, 130(Pt 8), 2108–2116. [DOI] [PubMed] [Google Scholar]
- Dieterich, M. , Bense, S. , Lutz, S. , Drzezga, A. , Stephan, T. , Bartenstein, P. , & Brandt, T. (2003). Dominance for vestibular cortical function in the non‐dominant hemisphere. Cerebral Cortex, 13(9), 994–1007. [DOI] [PubMed] [Google Scholar]
- Dieterich, M. , Kirsch, V. , & Brandt, T. (2017). Right‐sided dominance of the bilateral vestibular system in the upper brainstem and thalamus. Journal of Neurology, 264(Suppl 1), 55–62. 10.1007/s00415-017-8453-8 [DOI] [PubMed] [Google Scholar]
- Eickhoff, S. B. , Paus, T. , Caspers, S. , Grosbras, M. H. , Evans, A. C. , Zilles, K. , & Amunts, K. (2007). Assignment of functional activations to probabilistic cytoarchitectonic areas revisited. NeuroImage, 36(3), 511–521. 10.1016/j.neuroimage.2007.03.060 [DOI] [PubMed] [Google Scholar]
- Eickhoff, S. B. , Stephan, K. E. , Mohlberg, H. , Grefkes, C. , Fink, G. R. , Amunts, K. , & Zilles, K. (2005). A new SPM toolbox for combining probabilistic cytoarchitectonic maps and functional imaging data. NeuroImage, 25(4), 1325–1335. 10.1016/j.neuroimage.2004.12.034 [DOI] [PubMed] [Google Scholar]
- Eickhoff, S. B. , Weiss, P. H. , Amunts, K. , Fink, G. R. , & Zilles, K. (2006). Identifying human parieto‐insular vestibular cortex using fMRI and cytoarchitectonic mapping. Human Brain Mapping, 27(7), 611–621. 10.1002/hbm.20205 [DOI] [PMC free article] [PubMed] [Google Scholar]
- Elgoyhen, A. B. , Langguth, B. , De Ridder, D. , & Vanneste, S. (2015). Tinnitus: Perspectives from human neuroimaging. Nature Reviews. Neuroscience, 16(10), 632–642. 10.1038/nrn4003 [DOI] [PubMed] [Google Scholar]
- Farrer, C. , Frey, S. H. , Van Horn, J. D. , Tunik, E. , Turk, D. , Inati, S. , & Grafton, S. T. (2008). The angular gyrus computes action awareness representations. Cerebral Cortex, 18(2), 254–261. 10.1093/cercor/bhm050 [DOI] [PubMed] [Google Scholar]
- Fitzpatrick, R. C. , Marsden, J. , Lord, S. R. , & Day, B. L. (2002). Galvanic vestibular stimulation evokes sensations of body rotation. Neuroreport, 13(18), 2379–2383. 10.1097/01.wnr.0000048002.96487.de [DOI] [PubMed] [Google Scholar]
- Fornos, A. P. , Cavuscens, S. , Ranieri, M. , van de Berg, R. , Stokroos, R. , Kingma, H. , … Guinand, N. (2017). The vestibular implant: A probe in orbit around the human balance system. Journal of Vestibular Research‐Equilibrium & Orientation, 27(1), 51–61. 10.3233/Ves-170604 [DOI] [PubMed] [Google Scholar]
- Fox, M. D. , & Raichle, M. E. (2007). Spontaneous fluctuations in brain activity observed with functional magnetic resonance imaging. Nature Reviews. Neuroscience, 8(9), 700–711. 10.1038/nrn2201 [DOI] [PubMed] [Google Scholar]
- Frank, S. M. , & Greenlee, M. W. (2018). The parieto‐insular vestibular cortex in humans: More than a single area? Journal of Neurophysiology, 120(3), 1438–1450. 10.1152/jn.00907.2017 [DOI] [PubMed] [Google Scholar]
- Friston, K. J. , Williams, S. , Howard, R. , Frackowiak, R. S. , & Turner, R. (1996). Movement‐related effects in fMRI time‐series. Magnetic Resonance in Medicine, 35(3), 346–355. [DOI] [PubMed] [Google Scholar]
- Gottlich, M. , Jandl, N. M. , Sprenger, A. , Wojak, J. F. , Munte, T. F. , Kramer, U. M. , & Helmchen, C. (2016). Hippocampal gray matter volume in bilateral vestibular failure. Human Brain Mapping, 37(5), 1998–2006. 10.1002/hbm.23152 [DOI] [PMC free article] [PubMed] [Google Scholar]
- Gottlich, M. , Jandl, N. M. , Wojak, J. F. , Sprenger, A. , von der Gablentz, J. , Munte, T. F. , … Helmchen, C. (2014). Altered resting‐state functional connectivity in patients with chronic bilateral vestibular failure. Neuroimage Clinic, 4, 488–499. 10.1016/j.nicl.2014.03.003 [DOI] [PMC free article] [PubMed] [Google Scholar]
- Gottlich, M. , Munte, T. F. , Heldmann, M. , Kasten, M. , Hagenah, J. , & Kramer, U. M. (2013). Altered resting state brain networks in Parkinson's disease. PLoS One, 8(10), e77336 10.1371/journal.pone.0077336 [DOI] [PMC free article] [PubMed] [Google Scholar]
- Grunbauer, W. M. , Dieterich, M. , & Brandt, T. (1998). Bilateral vestibular failure impairs visual motion perception even with the head still. Neuroreport, 9(8), 1807–1810. [DOI] [PubMed] [Google Scholar]
- Helmchen, C. , Knauss, J. , Trillenberg, P. , Frendl, A. , & Sprenger, A. (2017). Role of the patient's history of vestibular symptoms in the clinical evaluation of the bedside head‐impulse test. Frontiers in Neurology, 8, 51 10.3389/fneur.2017.00051 [DOI] [PMC free article] [PubMed] [Google Scholar]
- Helmchen, C. , Rother, M. , Spliethoff, P. , & Sprenger, A. (2019). Increased brain responsivity to galvanic vestibular stimulation in bilateral vestibular failure. Neuroimage Clinic, 24, 101942 10.1016/j.nicl.2019.101942 [DOI] [PMC free article] [PubMed] [Google Scholar]
- Helmchen, C. , Ye, Z. , Sprenger, A. , & Munte, T. F. (2014). Changes in resting‐state fMRI in vestibular neuritis. Brain Structure & Function, 219(6), 1889–1900. 10.1007/s00429-013-0608-5 [DOI] [PubMed] [Google Scholar]
- Jandl, N. M. , Sprenger, A. , Wojak, J. F. , Gottlich, M. , Munte, T. F. , Kramer, U. M. , & Helmchen, C. (2015). Dissociable cerebellar activity during spatial navigation and visual memory in bilateral vestibular failure. Neuroscience, 305, 257–267. 10.1016/j.neuroscience.2015.07.089 [DOI] [PubMed] [Google Scholar]
- Jorns‐Haderli, M. , Straumann, D. , & Palla, A. (2007). Accuracy of the bedside head impulse test in detecting vestibular hypofunction. Journal of Neurology, Neurosurgery, and Psychiatry, 78(10), 1113–1118. 10.1136/jnnp.2006.109512 [DOI] [PMC free article] [PubMed] [Google Scholar]
- Kalla, R. , Muggleton, N. , Spiegel, R. , Bueti, D. , Claassen, J. , Walsh, V. , & Bronstein, A. (2011). Adaptive motion processing in bilateral vestibular failure. Journal of Neurology, Neurosurgery, and Psychiatry, 82(11), 1212–1216. 10.1136/jnnp.2010.235960 [DOI] [PubMed] [Google Scholar]
- Kaski, D. , Quadir, S. , Nigmatullina, Y. , Malhotra, P. A. , Bronstein, A. M. , & Seemungal, B. M. (2016). Temporoparietal encoding of space and time during vestibular‐guided orientation. Brain, 139(Pt 2), 392–403. 10.1093/brain/awv370 [DOI] [PMC free article] [PubMed] [Google Scholar]
- Kirsch, V. , Boegle, R. , Keeser, D. , Kierig, E. , Ertl‐Wagner, B. , Brandt, T. , & Dieterich, M. (2018). Handedness‐dependent functional organizational patterns within the bilateral vestibular cortical network revealed by fMRI connectivity based parcellation. NeuroImage, 178, 224–237. 10.1016/j.neuroimage.2018.05.018 [DOI] [PubMed] [Google Scholar]
- Klingner, C. M. , Volk, G. F. , Brodoehl, S. , Witte, O. W. , & Guntinas‐Lichius, O. (2014). Disrupted functional connectivity of the default mode network due to acute vestibular deficit. Neuroimage Clinic, 6, 109–114. 10.1016/j.nicl.2014.08.022 [DOI] [PMC free article] [PubMed] [Google Scholar]
- Kremmyda, O. , Hufner, K. , Flanagin, V. L. , Hamilton, D. A. , Linn, J. , Strupp, M. , … Brandt, T. (2016). Beyond dizziness: Virtual navigation, spatial anxiety and hippocampal volume in bilateral vestibulopathy. Frontiers in Human Neuroscience, 10, 139 10.3389/fnhum.2016.00139 [DOI] [PMC free article] [PubMed] [Google Scholar]
- Kublbock, M. , Woletz, M. , Hoflich, A. , Sladky, R. , Kranz, G. S. , Hoffmann, A. , … Windischberger, C. (2014). Stability of low‐frequency fluctuation amplitudes in prolonged resting‐state fMRI. NeuroImage, 103, 249–257. 10.1016/j.neuroimage.2014.09.038 [DOI] [PubMed] [Google Scholar]
- Lacour, M. , Helmchen, C. , & Vidal, P. P. (2016). Vestibular compensation: The neuro‐otologist's best friend. Journal of Neurology, 263(Suppl 1), S54–S64. 10.1007/s00415-015-7903-4 [DOI] [PMC free article] [PubMed] [Google Scholar]
- Lee, T. M. , Liu, H. L. , Hung, K. N. , Pu, J. , Ng, Y. B. , Mak, A. K. , … Chan, C. C. (2005). The cerebellum's involvement in the judgment of spatial orientation: A functional magnetic resonance imaging study. Neuropsychologia, 43(13), 1870–1877. 10.1016/j.neuropsychologia.2005.03.025 [DOI] [PubMed] [Google Scholar]
- Lobel, E. , Kleine, J. F. , Bihan, D. L. , Leroy‐Willig, A. , & Berthoz, A. (1998). Functional MRI of galvanic vestibular stimulation. Journal of Neurophysiology, 80(5), 2699–2709. [DOI] [PubMed] [Google Scholar]
- Lopez, C. , Blanke, O. , & Mast, F. W. (2012). The human vestibular cortex revealed by coordinate‐based activation likelihood estimation meta‐analysis. Neuroscience, 212, 159–179. 10.1016/j.neuroscience.2012.03.028 [DOI] [PubMed] [Google Scholar]
- Lowe, M. J. , Mock, B. J. , & Sorenson, J. A. (1998). Functional connectivity in single and multislice echoplanar imaging using resting‐state fluctuations. NeuroImage, 7(2), 119–132. 10.1006/nimg.1997.0315 [DOI] [PubMed] [Google Scholar]
- Machielsen, W. C. , Rombouts, S. A. , Barkhof, F. , Scheltens, P. , & Witter, M. P. (2000). FMRI of visual encoding: Reproducibility of activation. Human Brain Mapping, 9(3), 156–164. [DOI] [PMC free article] [PubMed] [Google Scholar]
- Machner, B. , Sprenger, A. , Fullgraf, H. , Trillenberg, P. , & Helmchen, C. (2013). Video‐based head impulse test. Importance for routine diagnostics of patients with vertigo. Der Nervenarzt, 84(8), 975–983. 10.1007/s00115-013-3824-6 [DOI] [PubMed] [Google Scholar]
- Machner, B. , von der Gablentz, J. , Gottlich, M. , Heide, W. , Helmchen, C. , Sprenger, A. , & Munte, T. F. (2020). Behavioral deficits in left hemispatial neglect are related to a reduction of spontaneous neuronal activity in the right superior parietal lobule. Neuropsychologia, 107, 356 10.1016/j.neuropsychologia.2020.107356 [DOI] [PubMed] [Google Scholar]
- Mangun, G. R. , Buonocore, M. H. , Girelli, M. , & Jha, A. P. (1998). ERP and fMRI measures of visual spatial selective attention. Human Brain Mapping, 6(5–6), 383–389. [DOI] [PMC free article] [PubMed] [Google Scholar]
- Martial, C. , Larroque, S. K. , Cavaliere, C. , Wannez, S. , Annen, J. , Kupers, R. , … Di Perri, C. (2019). Resting‐state functional connectivity and cortical thickness characterization of a patient with Charles bonnet syndrome. PLoS One, 14(7), e0219656 10.1371/journal.pone.0219656 [DOI] [PMC free article] [PubMed] [Google Scholar]
- Novitskiy, N. , Ramautar, J. R. , Vanderperren, K. , De Vos, M. , Mennes, M. , Mijovic, B. , … Wagemans, J. (2011). The BOLD correlates of the visual P1 and N1 in single‐trial analysis of simultaneous EEG‐fMRI recordings during a spatial detection task. NeuroImage, 54(2), 824–835. 10.1016/j.neuroimage.2010.09.041 [DOI] [PubMed] [Google Scholar]
- Oshio, R. , Tanaka, S. , Sadato, N. , Sokabe, M. , Hanakawa, T. , & Honda, M. (2010). Differential effect of double‐pulse TMS applied to dorsal premotor cortex and precuneus during internal operation of visuospatial information. NeuroImage, 49(1), 1108–1115. 10.1016/j.neuroimage.2009.07.034 [DOI] [PubMed] [Google Scholar]
- Pechenkova, E. , Nosikova, I. , Rumshiskaya, A. , Litvinova, L. , Rukavishnikov, I. , Mershina, E. , … Kozlovskaya, I. (2019). Alterations of functional brain connectivity after Long‐duration spaceflight as revealed by fMRI. Frontiers in Physiology, 10, 761 10.3389/fphys.2019.00761 [DOI] [PMC free article] [PubMed] [Google Scholar]
- Power, J. D. , Barnes, K. A. , Snyder, A. Z. , Schlaggar, B. L. , & Petersen, S. E. (2012). Spurious but systematic correlations in functional connectivity MRI networks arise from subject motion. NeuroImage, 59(3), 2142–2154. 10.1016/j.neuroimage.2011.10.018 [DOI] [PMC free article] [PubMed] [Google Scholar]
- Roberts, D. C. , Marcelli, V. , Gillen, J. S. , Carey, J. P. , Della Santina, C. C. , & Zee, D. S. (2011). MRI magnetic field stimulates rotational sensors of the brain. Current Biology, 21(19), 1635–1640. 10.1016/j.cub.2011.08.029 [DOI] [PMC free article] [PubMed] [Google Scholar]
- Roberts, R. E. , Ahmad, H. , Arshad, Q. , Patel, M. , Dima, D. , Leech, R. , … Bronstein, A. M. (2017). Functional neuroimaging of visuo‐vestibular interaction. Brain Structure & Function, 222(5), 2329–2343. 10.1007/s00429-016-1344-4 [DOI] [PMC free article] [PubMed] [Google Scholar]
- Roberts, R. E. , Ahmad, H. , Patel, M. , Dima, D. , Ibitoye, R. , Sharif, M. , … Bronstein, A. M. (2018). An fMRI study of visuo‐vestibular interactions following vestibular neuritis. Neuroimage Clinic, 20, 1010–1017. 10.1016/j.nicl.2018.10.007 [DOI] [PMC free article] [PubMed] [Google Scholar]
- Roberts, R. E. , & Husain, M. (2015). A dissociation between stopping and switching actions following a lesion of the pre‐supplementary motor area. Cortex, 63, 184–195. 10.1016/j.cortex.2014.08.004 [DOI] [PMC free article] [PubMed] [Google Scholar]
- Rondi‐Reig, L. , Paradis, A. L. , Lefort, J. M. , Babayan, B. M. , & Tobin, C. (2014). How the cerebellum may monitor sensory information for spatial representation. Frontiers in Systems Neuroscience, 8, 205 10.3389/fnsys.2014.00205 [DOI] [PMC free article] [PubMed] [Google Scholar]
- Rushworth, M. F. , Passingham, R. E. , & Nobre, A. C. (2002). Components of switching intentional set. Journal of Cognitive Neuroscience, 14(8), 1139–1150. 10.1162/089892902760807159 [DOI] [PubMed] [Google Scholar]
- Schott, B. H. , Wustenberg, T. , Lucke, E. , Pohl, I. M. , Richter, A. , Seidenbecher, C. I. , … Richardson‐Klavehn, A. (2019). Gradual acquisition of visuospatial associative memory representations via the dorsal precuneus. Human Brain Mapping, 40(5), 1554–1570. 10.1002/hbm.24467 [DOI] [PMC free article] [PubMed] [Google Scholar]
- Seemungal, B. M. , Guzman‐Lopez, J. , Arshad, Q. , Schultz, S. R. , Walsh, V. , & Yousif, N. (2013). Vestibular activation differentially modulates human early visual cortex and V5/MT excitability and response entropy. Cerebral Cortex, 23(1), 12–19. 10.1093/cercor/bhr366 [DOI] [PMC free article] [PubMed] [Google Scholar]
- Shallo‐Hoffmann, J. , & Bronstein, A. M. (2003). Visual motion detection in patients with absentvestibular function. Vision Research, 43, 1589–1597. [DOI] [PubMed] [Google Scholar]
- Sprenger, A. , Wojak, J. F. , Jandl, N. M. , & Helmchen, C. (2017). Postural control in bilateral vestibular failure: Its relation to visual, proprioceptive, vestibular, and cognitive input. Frontiers in Neurology, 8, 444 10.3389/fneur.2017.00444 [DOI] [PMC free article] [PubMed] [Google Scholar]
- Sprenger, A. , Wojak, J. F. , Jandl, N. M. , Hertel, S. , & Helmchen, C. (2014). Predictive mechanisms improve the vestibulo‐ocular reflex in patients with bilateral vestibular failure. Journal of Neurology, 261(3), 628–631. 10.1007/s00415-014-7276-0 [DOI] [PubMed] [Google Scholar]
- Stephan, T. , Deutschlander, A. , Nolte, A. , Schneider, E. , Wiesmann, M. , Brandt, T. , & Dieterich, M. (2005). Functional MRI of galvanic vestibular stimulation with alternating currents at different frequencies. NeuroImage, 26(3), 721–732. [DOI] [PubMed] [Google Scholar]
- Stoodley, C. J. (2012). The cerebellum and cognition: Evidence from functional imaging studies. Cerebellum, 11(2), 352–365. 10.1007/s12311-011-0260-7 [DOI] [PubMed] [Google Scholar]
- Strupp, M. , Arbusow, V. , Dieterich, M. , Sautier, W. , & Brandt, T. (1998). Perceptual and oculomotor effects of neck muscle vibration in vestibular neuritis. Ipsilateral somatosensory substitution of vestibular function. Brain, 121(Pt 4), 677–685. [DOI] [PubMed] [Google Scholar]
- Strupp, M. , Kim, J. S. , Murofushi, T. , Straumann, D. , Jen, J. C. , Rosengren, S. M. , … Kingma, H. (2017). Bilateral vestibulopathy: Diagnostic criteria consensus document of the classification Committee of the Barany Society. Journal of Vestibular Research, 27(4), 177–189. 10.3233/VES-170619 [DOI] [PMC free article] [PubMed] [Google Scholar]
- Tschan, R. , Wiltink, J. , Best, C. , Bense, S. , Dieterich, M. , Beutel, M. E. , & Eckhardt‐Henn, A. (2008). Validation of the German version of the vertigo symptom scale (VSS) in patients with organic or somatoform dizziness and healthy controls. Journal of Neurology, 255(8), 1168–1175. 10.1007/s00415-008-0863-1 [DOI] [PubMed] [Google Scholar]
- Tzourio‐Mazoyer, N. , Landeau, B. , Papathanassiou, D. , Crivello, F. , Etard, O. , Delcroix, N. , … Joliot, M. (2002). Automated anatomical labeling of activations in SPM using a macroscopic anatomical parcellation of the MNI MRI single‐subject brain. NeuroImage, 15(1), 273–289. 10.1006/nimg.2001.0978 [DOI] [PubMed] [Google Scholar]
- van de Berg, R. , Guinand, N. , Ranieri, M. , Cavuscens, S. , Nguyen, T. A. , Guyot, J. P. , … Perez‐Fornos, A. (2017). The vestibular implant input interacts with residual natural function. Frontiers in Neurology, 8, 644 10.3389/fneur.2017.00644 [DOI] [PMC free article] [PubMed] [Google Scholar]
- Van Dijk, K. R. , Sabuncu, M. R. , & Buckner, R. L. (2012). The influence of head motion on intrinsic functional connectivity MRI. NeuroImage, 59(1), 431–438. 10.1016/j.neuroimage.2011.07.044 [DOI] [PMC free article] [PubMed] [Google Scholar]
- Vanneste, S. , & De Ridder, D. (2016). Deafferentation‐based pathophysiological differences in phantom sound: Tinnitus with and without hearing loss. NeuroImage, 129, 80–94. 10.1016/j.neuroimage.2015.12.002 [DOI] [PubMed] [Google Scholar]
- Vincent, J. L. , Snyder, A. Z. , Fox, M. D. , Shannon, B. J. , Andrews, J. R. , Raichle, M. E. , & Buckner, R. L. (2006). Coherent spontaneous activity identifies a hippocampal‐parietal memory network. Journal of Neurophysiology, 96(6), 3517–3531. 10.1152/jn.00048.2006 [DOI] [PubMed] [Google Scholar]
- Wang, L. , Lei, D. , Suo, X. , Li, N. , Lu, Z. , Li, J. , … Peng, R. (2018). Resting‐state fMRI study on drug‐naive patients of essential tremor with and without head tremor. Scientific Reports, 8(1), 10580 10.1038/s41598-018-28778-z [DOI] [PMC free article] [PubMed] [Google Scholar]
- Ward, B. K. , Roberts, D. C. , Otero‐Millan, J. , & Zee, D. S. (2019). A decade of magnetic vestibular stimulation: From serendipity to physics to the clinic. Journal of Neurophysiology, 121(6), 2013–2019. 10.1152/jn.00873.2018 [DOI] [PubMed] [Google Scholar]
- Woll, J. , Sprenger, A. , & Helmchen, C. (2019). Postural control during galvanic vestibular stimulation in patients with persistent perceptual‐postural dizziness. Journal of Neurology, 266(5), 1236–1249. 10.1007/s00415-019-09255-7 [DOI] [PubMed] [Google Scholar]
- Yan, C. G. , Craddock, R. C. , Zuo, X. N. , Zang, Y. F. , & Milham, M. P. (2013). Standardizing the intrinsic brain: Towards robust measurement of inter‐individual variation in 1000 functional connectomes. NeuroImage, 80, 246–262. 10.1016/j.neuroimage.2013.04.081 [DOI] [PMC free article] [PubMed] [Google Scholar]
- Yang, H. , Long, X. Y. , Yang, Y. , Yan, H. , Zhu, C. Z. , Zhou, X. P. , … Gong, Q. Y. (2007). Amplitude of low frequency fluctuation within visual areas revealed by resting‐state functional MRI. NeuroImage, 36(1), 144–152. 10.1016/j.neuroimage.2007.01.054 [DOI] [PubMed] [Google Scholar]
- Yardley, L. , Masson, E. , Verschuur, C. , Haacke, N. , & Luxon, L. (1992). Symptoms, anxiety and handicap in dizzy patients: Development of the vertigo symptom scale. Journal of Psychosomatic Research, 36(8), 731–741. [DOI] [PubMed] [Google Scholar]
- Yuan, P. , Koppelmans, V. , Reuter‐Lorenz, P. , De Dios, Y. , Gadd, N. , Wood, S. , … Seidler, R. (2018). Vestibular brain changes within 70 days of head down bed rest. Human Brain Mapping, 39(7), 2753–2763. 10.1002/hbm.24037 [DOI] [PMC free article] [PubMed] [Google Scholar]
- Zang, Y. F. , He, Y. , Zhu, C. Z. , Cao, Q. J. , Sui, M. Q. , Liang, M. , … Wang, Y. F. (2007). Altered baseline brain activity in children with ADHD revealed by resting‐state functional MRI. Brain Dev, 29(2), 83–91. 10.1016/j.braindev.2006.07.002 [DOI] [PubMed] [Google Scholar]
- Zingler, V. C. , Cnyrim, C. , Jahn, K. , Weintz, E. , Fernbacher, J. , Frenzel, C. , … Strupp, M. (2007). Causative factors and epidemiology of bilateral vestibulopathy in 255 patients. Annals of Neurology, 61(6), 524–532. 10.1002/ana.21105 [DOI] [PubMed] [Google Scholar]
- Zingler, V. C. , Weintz, E. , Jahn, K. , Mike, A. , Huppert, D. , Rettinger, N. , … Strupp, M. (2008). Follow‐up of vestibular function in bilateral vestibulopathy. Journal of Neurology, Neurosurgery, and Psychiatry, 79(3), 284–288. 10.1136/jnnp.2007.122952 [DOI] [PubMed] [Google Scholar]
- Zou, Q. H. , Zhu, C. Z. , Yang, Y. , Zuo, X. N. , Long, X. Y. , Cao, Q. J. , … Zang, Y. F. (2008). An improved approach to detection of amplitude of low‐frequency fluctuation (ALFF) for resting‐state fMRI: Fractional ALFF. Journal of Neuroscience Methods, 172(1), 137–141. 10.1016/j.jneumeth.2008.04.012 [DOI] [PMC free article] [PubMed] [Google Scholar]
- zu Eulenburg, P. , Caspers, S. , Roski, C. , & Eickhoff, S. B. (2012). Meta‐analytical definition and functional connectivity of the human vestibular cortex. NeuroImage, 60(1), 162–169. 10.1016/j.neuroimage.2011.12.032 [DOI] [PubMed] [Google Scholar]
- Zuo, X. N. , Di Martino, A. , Kelly, C. , Shehzad, Z. E. , Gee, D. G. , Klein, D. F. , … Milham, M. P. (2010). The oscillating brain: Complex and reliable. NeuroImage, 49(2), 1432–1445. 10.1016/j.neuroimage.2009.09.037 [DOI] [PMC free article] [PubMed] [Google Scholar]
- Zuo, X. N. , Ehmke, R. , Mennes, M. , Imperati, D. , Castellanos, F. X. , Sporns, O. , & Milham, M. P. (2012). Network centrality in the human functional connectome. Cerebral Cortex, 22(8), 1862–1875. 10.1093/cercor/bhr269 [DOI] [PubMed] [Google Scholar]
Associated Data
This section collects any data citations, data availability statements, or supplementary materials included in this article.
Supplementary Materials
Table S1 Functional connectivity (FC; seeds).
Data Availability Statement
Data can be made available on request.