

Abstract
Parkinson's disease is characterized by bradykinesia, rigidity, and tremor. These symptoms have been related to an increased gamma‐aminobutyric acid (GABA)ergic inhibitory drive from globus pallidus onto the thalamus. However, in vivo empirical evidence for the role of GABA in Parkinson's disease is limited. Some discrepancies in the literature may be explained by the presence or absence of tremor. Specifically, recent functional magnetic resonance imaging (fMRI) findings suggest that Parkinson's tremor is associated with reduced, dopamine‐dependent thalamic inhibition. Here, we tested the hypothesis that GABA in the thalamocortical motor circuit is increased in Parkinson's disease, and we explored differences between clinical phenotypes. We included 60 Parkinson patients with dopamine‐resistant tremor (n = 17), dopamine‐responsive tremor (n = 23), or no tremor (n = 20), and healthy controls (n = 22). Using magnetic resonance spectroscopy, we measured GABA‐to‐total‐creatine ratio in motor cortex, thalamus, and a control region (visual cortex) on two separate days (ON and OFF dopaminergic medication). GABA levels were unaltered by Parkinson's disease, clinical phenotype, or medication. However, motor cortex GABA levels were inversely correlated with disease severity, particularly rigidity and tremor, both ON and OFF medication. We conclude that cortical GABA plays a beneficial rather than a detrimental role in Parkinson's disease, and that GABA depletion may contribute to increased motor symptom expression.
Keywords: dopamine, gamma‐aminobutyric acid, magnetic resonance spectroscopy, motor cortex, Parkinson disease, thalamus, tremor
1. INTRODUCTION
Parkinson's disease is a progressive neurodegenerative disorder characterized by bradykinesia, rigidity, and resting tremor. It is generally thought that the loss of dopaminergic neurons in the substantia nigra pars compacta, and subsequent striatal dopamine depletion, underlies bradykinesia (Kish, Shannak, & Hornykiewicz, 1988). According to the classical “rate” model of basal ganglia function, striatal dopamine depletion produces an imbalance between the direct (facilitatory) and the indirect (inhibitory) pathways through the basal ganglia (Albin, Young, & Penney, 1989). More specifically, dopamine depletion is thought to elicit a release of indirect pathway activity, resulting in an abnormally increased gamma‐aminobutyric acid (GABA)ergic, inhibitory drive from the internal globus pallidus (GPi) onto the ventral lateral (VL) nucleus of the thalamus. The VL nucleus in turn facilitates motor representations in the motor cortex. According to this model, dopamine depletion in Parkinson's disease should therefore cause both increased concentrations of GABA in the thalamus and a lack of facilitation of the motor cortex. This model has been very influential in explaining the role of dopamine in motor control and it has contributed to important breakthroughs such as the development of stereotactic surgery for treating Parkinson's disease (Hamani, Dostrovsky, & Lozano, 2006).
However, several predictions of this model have yielded opposing results (Ellens & Leventhal, 2013; Nelson & Kreitzer, 2014). Animal and patient studies report only small increases in GPi firing rates in the parkinsonian state (Hutchison et al., 1994; Levy et al., 2001), and no suppression of thalamic firing (Ellens & Leventhal, 2013; Nelson & Kreitzer, 2014). Furthermore, there is limited (and contradictory) experimental evidence for altered GABA levels in the thalamus in Parkinson's disease. For instance, microdialysis in patients with Parkinson's disease with deep brain stimulation (DBS) showed that both levodopa administration and DBS of the subthalamic nucleus decreased GABA levels in the VL nucleus of the thalamus accompanied with motor improvement (Stefani, 2011; Stefani et al., 2011). Using MR spectroscopy, others found increased GABA levels in Parkinson's disease compared with controls in a small voxel contained within the thalamus (Dharmadhikari et al., 2015). However, covering the entire basal ganglia and part of the thalamus, others found a reduction of GABA levels in Parkinson's disease, and even lower GABA levels for tremulous Parkinson's disease compared with nontremor Parkinson's disease (Gong et al., 2017). Finally, a postmortem study found a 36% reduction in thalamic GABA concentrations in patients with Parkinson's disease compared with controls (Gerlach et al., 1996). Accordingly, it has been suggested that not intensity of inhibition, but the pattern and synchrony of neural firing is most affected in Parkinson's disease (Hutchison et al., 2004; Uhlhaas & Singer, 2006). More specifically, these authors suggest that enhanced synchronization, particularly in the beta‐frequency range, is responsible for bradykinesia in Parkinson's disease (Brittain, Sharott, & Brown, 2014).
Adding to the disparity, it is clear that the classic box‐and‐arrow model does not easily explain Parkinson's disease rigidity and tremor, which are both associated with excessive rather than reduced motor activity (Rodriguez‐Oroz et al., 2009). Rigidity has been linked to enhanced excitability of the motor cortex, as evidenced by increased motor evoked potentials and a reduced cortical silent period in patients versus controls (Cantello et al., 1991). Furthermore, higher rigidity scores were associated with increased motor cortex activity during voluntary movements (Yu, Sternad, Corcos, & Vaillancourt, 2007). Resting tremor has been hypothesized to result from increased thalamic inhibition (thalamic hyperpolarization hypothesis (Llinás, 1988)); however, subsequent findings have cast doubt on this idea. The proposed low‐threshold calcium‐dependent spiking behavior was not found in the thalamic region associated with resting tremor, that is, the posterior portion of the ventrolateral thalamus (Magnin, Morel, & Jeanmonod, 2000). Further, a recent functional magnetic resonance imaging (MRI) study using dynamic causal modeling, showed that dopaminergic medication reduced tremor severity by increasing, rather than decreasing, thalamic self‐inhibition (Dirkx et al., 2017). This effect was related to the clinical response of tremor to dopamine, that is, patients with dopamine‐responsive tremor showed enhanced thalamic inhibition. This suggests that tremor, especially dopamine‐resistant tremor, may result from reduced, rather than increased, thalamic inhibition (Helmich, 2018).
Thus, there is evidence for increased as well as reduced GABA concentrations in the thalamus and motor cortex of Parkinson's disease patients, and these discrepancies may depend on differences in clinical phenotype. Using magnetic resonance spectroscopy (MRS), here we aimed to clarify this issue by testing the effect of dopaminergic medication in carefully selected clinical phenotypes in Parkinson's disease, on GABA levels in the primary motor cortex, thalamus, and a control region in the visual cortex. Following the classical basal ganglia model, we expected higher thalamic GABA levels in patients than controls, which should be (partly) remediated by dopaminergic medication, and which should increase with bradykinesia severity. As MRS is sensitive to extracellular, unbound GABA (Dyke et al., 2017; Rae, 2014; Stagg, 2014)—which is involved in tonic rather than phasic inhibition—this method is appropriate to detect the predicted increase in tonic GABAergic tone in the thalamus in Parkinson's disease (Redgrave et al., 2010). The classical model does not offer such clear predictions on changes in the motor cortex: although increased thalamic inhibition may lead to increased inhibition of the motor cortex, other transcortical influences likely also play a role. Furthermore, based on our previous data (Dirkx et al., 2017), we hypothesized an opposite relationship between thalamic GABA and resting tremor. More specifically, we expected reduced GABA concentrations in tremor‐dominant patients compared with nontremor patients, and more so in patients with a dopamine‐responsive tremor than a dopamine‐resistant tremor.
2. METHODS
2.1. Subjects
The study was conducted according to the standards of the 1964 Declaration of Helsinki and was approved by the local ethics committee. Before inclusion, all participants provided their informed written consent.
This project included three groups of patients with Parkinson's disease (patients with dopamine resistant tremor (n = 17, 4 Female [F], 13 Male [M]), patients with dopamine responsive tremor (n = 23, 14F, 9M), nontremor patients (n = 20, 9F, 11M), as well as one group of age matched healthy controls (n = 22, 10F, 12M). Clinical details are presented in Table 1. For patients, inclusion criteria were: idiopathic Parkinson's disease, and one of these three possible clinical phenotypes. Exclusion criteria were cognitive dysfunction defined as Mini‐Mental State Examination (MMSE) < 26 and frontal assessment battery (FAB) < 13 (Lima, Meireles, Fonseca, Castro, & Garrett, 2008), neurological or a severe psychiatric comorbidity (such as personality disorder, clinically defined major depression, psychosis) severe head tremor, known allergy against levodopa–benserazide or domperidone and severe dyskinesia's. Patients with mild psychiatric symptoms were not excluded.
Table 1.
Disease characteristics of participants
| Resist | Respond | Nontremor | Sig. | Patients | Controls | Sig. | ||
|---|---|---|---|---|---|---|---|---|
| Sample size | 17 | 23 | 20 | 60 | 22 | |||
| Gender | F:4 M:13 | F:14 M:9 | F:9 M:11 | p = .064 | F:27 M:33 | F:10 M:12 | p = .971 | |
| Age | 60.9 (9.6) | 61.3 (12.8) | 60.2 (9.2) | p = .886 | 60.8 (10.7) | 63.1 (10.5) | p = .455 | |
| FAB | 17.5 (0.6) | 17.0 (1.1) | 16.5 (4.4) | p = .109 | 17.0 (1.4) | 17.5 (0.7) | p = .166 | |
| MMSE | 29.1 (1.3) | 29.2 (1.4) | 29.2 (7.0) | p = .969 | 29.2 (1.3) | 29.4 (0.9) | p = .503 | |
| LEDD | 381 (329) | 518 (289) | 645 (503) | p = .219 | ||||
| Duration | 2.6 (1.8) | 5.7 (5.4) | 5.1 (2.1) | p = .019 | ||||
| ON | OFF | |||||||
| Sub‐UPDRS | Resist | Respond | Nontremor | Sig. | Resist | Respond | Nontremor | Sig. |
| Axial | 5.2 (4.3) | 5.7 (3.3) | 5.5 (4.3) | p = .947 | 6.4(4.8) | 8.1 (4.3) | 7.0 (4.2) | p = .492 |
| Bradykinesia | 13.1 (9.0) | 13.3 (5.8) | 12.5 (5.9) | p = .906 | 16.4 (9.2) | 18.7 (5.8) | 18.6 (8.7) | p = .619 |
| Rigidity | 4.8 (4.3) | 4.7 (3.2) | 5.3 (3.2) | p = .888 | 5.0 (5.8) | 6.1 (3.8) | 7.5 (3.8) | p = .249 |
| Rest tremor | 10.4 (2.9) | 6.2 (4.5) | 0.0 (0.0) | p < .001 | 10.4 (3.2) | 9.3 (4.3) | 0.0 (0.0) | p < .001 |
| Tremor | 13.9 (5.0) | 8.9 (5.0) | 0.7 (0.7) | p < .001 | 14.4 (5.1) | 13.0 (5.2) | 1.3 (1.2) | p < .001 |
| Brady + rigid | 17.8 (12.5) | 18.0 (7.8) | 17.8 (8.4) | p = .990 | 21.4 (13.9) | 24.8 (8.9) | 26.1 (11.7) | p = .461 |
Note: Disease severity as measured by MDS‐UPDRS Part III (maximum score is 108). Bradykinesia refers to the sum of UPDRS Items 8–17 and 23; rigidity to the sum of UPDRS Items 3–7 and 18; axial to the sum of UPDRS Items 1, 2, and 18–23), and tremor refers to MDS‐UPDRS Items 24–33. The FAB (maximum is 18) and MMSE (maximum is 30) were used as a measure of cognitive function. To compare between controls and patients, we used a series of two‐tailed t tests for our continuous variables, and the χ 2 test for the categorical variable “gender.” The three patient groups were compared using a one‐way MANOVA for the continuous variables. MDS‐UPDRS subscores were checked separately for ON and OFF medication, all resulting significant scores (p values are in bold), were post hoc compared between each of the three groups with two‐sample t test, two‐tailed. If the individual t test comparison is significantly different from both other groups, the mean score with SD is depicted in bold as well.
Abbreviations: ANOVA, analysis of variance; Brady + rigid, combination of bradykinesia and rigidity scores; F, female, FAB, frontal assessment battery, LEDD, levodopa equivalent dose; M, male; MANOVA, multivariate ANOVA; MMSE, Mini‐Mental State Examination; sig., significance level.
Tremor‐dominant Parkinson's disease was defined as a history of tremor and a resting tremor score of 1 point or more in at least one arm on Item 17 of the Movement Disorders Society Unified Parkinson's Disease Rating Scale (MDS‐UPDRS part III) (Dirkx et al., 2017). These tremor patients were divided into dopamine‐responsive and dopamine‐resistant phenotypes. Specifically, in a separate session before MRI examinations, 83 tremor‐dominant Parkinson's disease patients (as defined above) were prescreened to measure their dopamine responsiveness. During this session, patients' MDS‐UDPRS motor scores were measured twice on 1 day, both before (OFF medication) and after a levodopa challenge (200/50 mg levodopa–benserazide plus domperidone 10 mg). Dopamine‐resistant tremor was defined as a clinical dopamine response of ≤20% on tremor UPDRS (Items 15–18), while dopamine‐responsive tremor was defined as a clinical dopamine response of ≥70% on tremor UPDRS. All selected patients had a dopamine response for bradykinesia/rigidity of at least 20%, to exclude trivial causes for dopamine‐resistance (such as gastrointestinal problems). This resulted in 17 Parkinson's disease patients with dopamine resistant tremor and 23 Parkinson's disease patients with dopamine responsive tremor, who were included in this study. Nontremor Parkinson's disease (n = 20) was defined as the absence of resting tremor in all limbs (UPDRS resting tremor score of 0 (Helmich, Janssen, Oyen, Bloem, & Toni, 2011). Action tremor was allowed given that this tremor has a different pathophysiology (Dirkx, Zach, Bloem, Hallett, & Helmich, 2018). In our sample, 52 patients took levodopa, 16 patients took dopamine agonists, four patients took a catechol‐O‐methyltransferase inhibitor and two patients took tricyclic antidepressants.
From all 60 Parkinson's disease patients, four patients dropped out on the second day due to claustrophobia (two in the responsive, one in the resistant, and one in the nontremor group). In the dopamine responsive tremor group, one MRS session could not be completed due to technical problems with the MRI scanner on Day 1. Out of 22 controls, three participants did not return for Session 2. We further excluded patients whose MRS spectra did not pass quality control requirements (see Section 2.4), which resulted in an average of 2–3 rejected spectra per group in the thalamus, 0–1 in the motor cortex, and 0–4 in the visual cortex (see Figure 1, Supporting Information for a precise description of rejected spectra).
2.2. Dopaminergic intervention
Both patients and healthy participants were measured on two separate occasions, always in the morning. Parkinson's disease patients were measured in pseudorandomized order with respect to the dopaminergic intervention. On both sessions, patients came in an OFF state, that is, >12 hr after their last dose of levodopa, >48–72 hr after their last dose of dopamine agonist (greater than three times the drug half‐life). On both sessions, all patients received a dose of domperidone 10 mg 1 hr before drug/placebo intake, to increase gastrointestinal absorption and to reduce side effects. During one session, patients received a standardized dose of 200/50 mg of dispersible levodopa–benserazide (ON state), dispersed in water. Levodopa dose was on average 70% higher than the patients' own morning dose. During the other session, patients received a placebo (cellulose dispersed in water, which matches the dispersible levodopa both visually and in terms of taste). All healthy subjects were measured on two separate sessions to control for repetition effects.
2.3. Measurements
2.3.1. Clinical ratings
Full clinical scores consisted of all 18 items of the MDS‐UPDRS part III; subscores were used to calculate the dopamine response for each of the three motor symptoms separately: resting tremor and re‐emergent tremor (nonkinetic tremor: Items 15 and 17), bradykinesia: (Items 4–8 and 14), and rigidity (Item 3). The clinical rater was blinded to the medication administration of the patients.
2.3.2. Magnetic resonance imaging
All participants underwent a similar counterbalanced MRI scanning protocol using a 3 T MRI Siemens PRISMA system (Siemens Healthcare, Erlangen, Germany), equipped with a 32‐channel head coil. A whole brain high resolution T1‐weighted anatomical scan was acquired using a three‐dimensional magnetization prepared rapid gradient echo acquisition sequence (MP2RAGE [repetition time [TR] = 5,000 ms; echo time [TE] = 2.96 ms, TI1 = 700 ms, TI2 = 2,500 ms; matrix 350 × 263 × 350 mm3, voxels 1.0 mm3 isotropic).
2.3.3. 1H‐magnetic resonance spectroscopy
MRS data were acquired after the T1 acquisition, using a standard Siemens MEGA‐PRESS acquisition protocol for GABA detection (Mescher, Merkle, Kirsch, Garwood, & Gruetter, 1998), with a TR = 1,500 ms; TE = 68 ms; acquisition bandwidth = 1,200 Hz; and water suppression at 4.7 ppm (Mullins et al., 2014), using the CHESS water suppression method (Ogg, Kingsley, & Taylor, 1994). On the odd‐numbered acquisitions, a frequency selective refocusing pulse was applied at 1.9 ppm. Subtracting odd from even acquisitions reveals the GABA resonance at around 3.0 ppm (see supplementary materials for a more extended description of the MRS sequence). We focused on three different brain regions: the thalamus, motor cortex, and visual cortex. Our main hypothesis of altered GABA concentrations in Parkinson's disease concerned the thalamus and motor cortex; the visual cortex was added as a nonmotor control region. In patients, these voxels were placed in the hemisphere contralateral to the body side with most prominent motor symptoms. In the healthy controls, the voxels were placed equally on either the left or right side of the brain, randomized across control participants. Voxel dimensions (18 × 24 × 18 mm3 = 7.78 ml) were optimized for the slightly elongated shape of the thalamus. Number of averages was optimized for signal to noise drop off toward the center of the brain. This resulted in 96 averages in cortical regions (in pairs of scans), and 128 in the thalamus. Voxels were placed manually on the first session, and voxel coordinates relative to the individual anatomical MRI were saved using the vendor‐provided Auto Align function. This guaranteed that the voxel was placed in the same anatomical locations across the two sessions for each individual subject. During Session 2, this automatic voxel placement was always visually checked using a new anatomical T1 scan. The thalamus voxel was placed to avoid neighboring nuclei such as GPi and caudate nucleus, and to minimize inclusion of cerebrospinal fluid. The voxel was oriented along the transversal axis and rotated along the white matter tract posterior and lateral from the thalamus tissue. Its size was restricted from the start of the GPi on the anterior side, to the CSF on posterior and medial side. The motor cortex voxel was placed to cover the motor hand area, or “hand knob,” see also (Caulo et al., 2007), and oriented along the central sulcus, and was aligned with the skull in the coronal plane. The visual cortex voxel was aligned with the calcarine sulcus and rotated with a slight ( ±10°) angle from the anterior–posterior line, to avoid distortion originating from the sagittal sinus and jugular veins. See Figure 1 for a representation of the average location of the three voxels.
Figure 1.
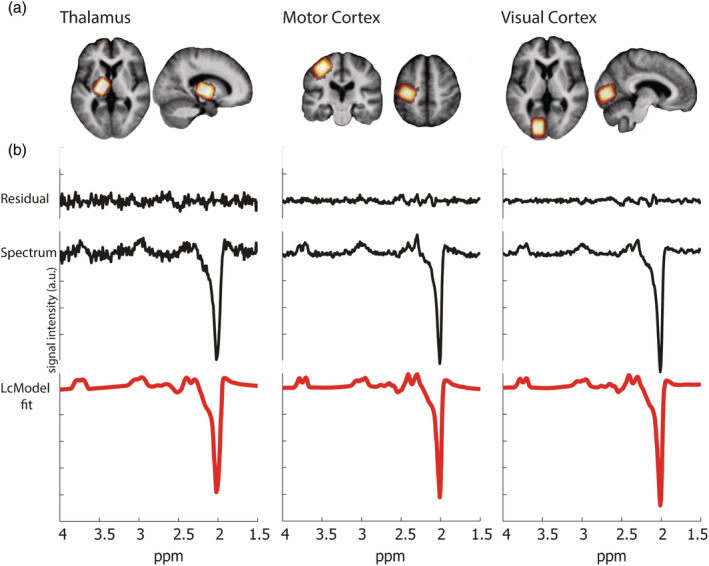
Anatomical location of MRS voxels. Panel (a) shows a heat plot of the MRS voxels in the thalamus, motor cortex, and visual cortex (in red‐yellow), which was created by normalizing all anatomical T1 scans to standard stereotactic space, keeping associated region of interests in line, and calculating the overlap of regions of interest between subjects. They are shown superimposed on the averaged anatomical scan of all patients. Voxels were placed on the side contralateral to the most affected side; this resulted in 30 participants being scanned on the left, and the other 30 on the right side, controls were scanned on the right and left side equally in random order (11 were scanned on the left and 11 on the right). Only the left side is shown as an example. (b) Representative MR spectra as recorded in a Parkinson's disease patient, measured in each of the three voxels, decomposed into the LCModel fit, the original spectrum, and difference between original and fitted spectra (residual) from bottom to top, respectively. a.u., arbitrary units; MRS, magnetic resonance spectroscopy
2.4. 1H‐MRS postprocessing
Metabolite quantification was performed with LCModel software (Provencher, 2001). LCModel performs fitting, frequency alignment, phase adjustment, eddy current correction, and baseline correction. Relative concentrations were estimated by fitting the measured signal with a simulated basis set for both the difference and the original spectrum. Most prominently, spectra of GABA, N‐acetyl aspartate (NAA), N‐acetyl‐aspartyl glutamate, glutamate (Glu), glutamine (Gln), and total (phospho‐) creatine (tCre) were simulated using the MEGA‐PRESS editing and nonediting sequence, including pulse shapes and pulse timings. A full overview of the metabolites included in the simulated basis sets of both spectra can be found in the supplementary materials. Quality control of the spectra was based on the Cramer–Rao lower bounds (given as % SD value by the LCModel program), full width at half maximum (FWHM) and further visual inspection (see Table 2 for the average CRLB and FWHM values per subgroup). Especially, in spectra with resonances with low signal intensity, such as GABA, a low cut‐off Cramer–Rao lower bound as quality control introduces a systematic bias toward higher levels of that particular resonance (Kreis, 2016). Therefore, we chose to use spectra with a %SD value <50 as the threshold for acceptance of the GABA fit (Marjańska et al., 2013), see Table 2 for average %SD values. Our main outcome measure was the region‐specific GABA amount, which was calculated as the ratio between the GABA and the tCre signal, were the GABA signal was taken from the edited experiment and the tCre signal from the nonedited spectrum. This was done to normalize the GABA levels to a stable counterpart without the issues of calculating absolute concentrations.
Table 2.
Comparison of spectral quality between groups
| Thalamus | Motor cortex | Visual cortex | |||||||
|---|---|---|---|---|---|---|---|---|---|
| Patient | Control | Sig. | Patient | Control | Sig. | Patient | Control | Sig. | |
| FWHM | 9.2 (4.4) | 9.6 (4.5) | 0.347 | 7.3 (2.1) | 7.4 (2.8) | 0.188 | 7.4 (3.0) | 7.7 (3.2) | 0.466 |
| CRLB | 24.1 (13.9) | 22.6 (13.4) | 0.154 | 15.3 (5.5) | 14.5 (5.8) | 0.171 | 17.9 (10.0) | 16.8 (11.0) | 0.226 |
Note: The mean (SD) of linewidth (FWHM, based on the NAA peak), and Cramer–Rao lower bounds (%SD) of the quality‐controlled GABA fits for GABA‐edited spectra from thalamus, motor cortex, and visual cortex are shown.
Abbreviations: GABA, gamma‐aminobutyric acid; FWHM, full width at half maximum; NAA, N‐acetyl aspartate; sig., significance level (t test).
2.5. Statistical analysis
Statistical analyses were performed with Statistical Package for Social Science Software (SPSS, Version 2, Chicago, IL) for Windows. A p‐value of <.05 was considered significant. In addition to classical statistics, we supplement these analyses with Bayesian statistics using JASP for Bayesian analysis (JASP Team [2017, Version 0.8.2]). Bayesian statistics are added to provide insight into the validity of a null response. Bayes factors quantify the ratio of accumulated evidence for the null hypothesis and the alternative hypothesis. We report both Bayes factors showing evidence toward the alternative hypothesis (BF10) and Bayes factors showing evidence toward the null hypothesis (BF01). The reported Bayes factors (BF10 or BF01) are interpreted according to the guidelines provided in JASP (Wagenmakers et al., 2018) in which a BF between 1 and 3 was interpreted as anecdotal effect, a BF between 3 and 7 as a moderate effect (BF = 3 can be roughly seen as the “equivalent” denotation of p < .05) and a BF >7 as a strong effect. Our main analyses can be divided into three main parts:
First, we tested whether GABA levels differed between patients and controls, and whether these effects were region‐specific. For this analysis, we combined the three patient groups into one patient group, and we averaged across the two medication sessions. We used a [2 × 3] repeated measures analysis of variance (ANOVA) in SPSS, with group (patients vs. controls) as between‐subject factor and region (thalamus, motor cortex, visual cortex) as a within‐subject factor. We also assessed the direction of these effects using [2 × 3] Bayesian repeated measured ANOVA in JASP, to test for evidence in favor or against the null hypothesis.
Second, in patients, we tested whether GABA levels were influenced by disease phenotype (Parkinson's disease with dopamine‐resistant tremor, dopamine‐responsive tremor, or no tremor) and by dopaminergic medication (OFF vs. ON). We used a [3 × 2] repeated measures ANOVA in SPSS with factors region and medication as within‐subject factors and group as between subject factor. Again, we assessed the direction of effects using the [3 × 2] Bayesian repeated measured ANOVA in JASP.
Third, we tested whether GABA levels were correlated with disease severity (total MDS‐UPDRS motor score). First, to investigate the overall effect of disease severity and to test whether these correlations were significantly different between regions, we used a repeated measure ANOVA in SPSS, with region (thalamus, motor cortex, visual cortex) as a within‐subject factor and mean MDS‐UPDRS scores as a covariate. Next, in accordance with a‐prior expectations, we separately performed multiple linear regression analyses on the GABA/tCre and MDS‐UPDRS values in each of the three regions (averaged over sessions). We also assessed Bayesian scores of each correlation using Bayesian correlation pairs in JASP on the mean values for each participant, to see whether evidence supports the presence or absence of a correlation. These previous results were inspected using an adjusted p‐value of < .007, based on a Bonferroni correction to account for our seven tests of interest: patient versus controls, patient‐group, medication, and correlation with UPDRS including each of the three regions.
We performed several post hoc exploratory analyses to elaborate on our previous results. First, we ran the three multiple linear regression analyses (UPDRS by GABA in the three regions) separately for ON and OFF sessions. In addition, we investigated whether each of the three main symptoms of Parkinson's disease (rigidity, tremor, and bradykinesia) were correlated with GABA levels in the motor cortex, using multiple linear regression analyses both ON and OFF medication and Bayesian correlation pairs over the mean scores. Given that we collected unilateral GABA measurements, we used symptom severity ratings for the contralateral (most‐affected) side. We compared all possible correlations between the three symptoms (separately ON and OFF medication) using the cocor toolbox, developed by Diedenhofen and Musch (2015).
3. RESULTS
3.1. Clinical differences between groups
There were no differences between patient groups and controls in gender balance, age, FAB, and MMSE scores. There were also no differences between Parkinson phenotypes in terms of age, FAB, and MMSE, levodopa equivalent daily dose, and MDS‐UPDRS motor scores of the following subsets: axial symptoms, bradykinesia, rigidity, and the total nontremor score (see Table 1). There was no difference in nontremor MDS‐UPDRS response (difference between OFF and ON). However, there was a trend‐level difference in gender balance between the three Parkinson's disease phenotypes [χ 2(2) = 5.51, p = .064]. Furthermore, the disease duration of the dopamine resistant group was shorter than that of other groups [resistant/responsive: t(39) = −2.78, p = .020, resistant/nontremor: t(36) = −2.43, p = .046]. Tremor scores differed between patient groups, reflecting our inclusion procedure: MDS‐UPDRS scores differed significantly between the two tremor groups ON medication [t(39) = 3.52, p = .002], but not OFF medication [t(39) = 1.00, p = .579]. The nontremor patient group showed significantly different tremor scores from the tremor patients, both ON [resistant/nontremor: t(36) = 8.97, p < .001, responsive/nontremor: t(42) = 6.00, p < .001], and OFF dopamine [resistant/nontremor: t(36) = 9.30, p < .001, responsive/nontremor: t(42) = 8.99, p < .001].
3.2. Effects of Parkinson's disease and brain region on GABA
GABA/tCre ratios differed per brain region, such that the thalamus had the highest GABA/tCre ratio, followed by the motor cortex and visual cortex [factor REGION: F(2,142) = 10.012, η2 = 0.121, p < .001]. There were no significant differences between patients and controls [factor GROUP: F(3,71) = 0.03, η2 < 0.001, p = .859], and no interaction between group and region [F(6,71) = 0.149, η2 = 0.002, p = .858], see also Figure 2. Bayesian analyses comparing GABA levels between controls and patients revealed moderate evidence toward the null hypothesis (BF01 = 4.72). This provides statistical evidence in favor of no effect between groups, suggesting that the lack of a statistical difference in our conventional analysis was not driven by a lack of statistical power.
Figure 2.
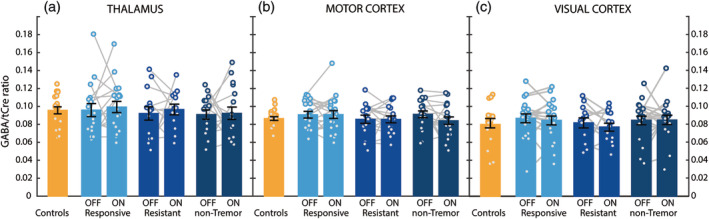
GABAergic changes in Parkinson's disease. GABA‐to‐total‐creatine (GABA/tCre) values measured in controls (n = 22) and in the three Parkinson phenotypes (dopamine‐responsive tremor [n = 23], dopamine‐resistant tremor [n = 17], nontremor [n = 20]), during both ON and OFF medication, are shown for the thalamus (Panel a), the motor cortex (Panel b) and the visual cortex (Panel c). Histograms indicate mean and SE of the mean (in black). Against our expectations, we found no evidence for effects of disease, phenotype, or dopaminergic medication on GABA levels. GABA, gamma‐aminobutyric acid; MDS‐UPDRS, Movement Disorders Society Unified Parkinson's Disease Rating Scale; tCre, total creatine
3.3. Effect of dopaminergic medication and Parkinson phenotype on GABA
There was no effect of medication [F(1,32) = 0.02, η2 < 0.001, BF01 = 6.64, p = .894], or medication by region [F(2,64) = 0.35, η2 = 0.011, p = .708; BF01 = 10.11], on GABA/tCre. In addition, there was no effect of patient phenotype [F(2,32) = 1.13, η2 = 0.066, p = .336, BF01 = 3.96], region by patient phenotype interaction [F(4,64) = 0.87, η2 = 0.052, p = .486; BF01 = 6.77], or medication by patient phenotype interaction [F(2,32) = 0.62, η2 = 0.038; p = .542; BF01 = 3.84]. As outlined above, the Bayesian analyses provided positive though not strong statistical evidence in favor of no effect (BF > 3).
3.4. Correlations between total disease severity and GABA/tCre ratio
There was a significant correlation between overall GABA concentration and total UPDRS motor scores [F(1,38) = 6.33, p = .015, η 2 = 0.108], which was not significantly different between regions [region × UPDRS: F(2,57) = 0.13, η2 = 0.003, p = .876]. In line with our a priori prediction that disease severity as specifically related to GABA concentrations in the thalamus and motor cortex, we inspected the individual correlations between each of the three regions of interest. The effect was strongly significant in the motor cortex, with Bayesian statistics showing very strong evidence toward the H1 [T(57) = −3.55, r 2 = .18, p < .001; BF10 = 40.57], holding up to a strict Bonferroni‐adjusted p‐value of <.007. However, this effect was not significant in the thalamus [T(54) = −3.09, r 2 = .04, p = .084; BF01 = 1.40] or visual cortex [T(57) = −1.53, r 2 = .02, p = .132; BF01 = 2.03], both with anecdotal evidence in favor of the null hypothesis. As a follow up, we looked at consistency over sessions and found that the correlation in the motor cortex was significant in both sessions, see Figure 3; ON [T(55) = −2.54, r 2 = .11, p = .014] and OFF medication [T(52) = −2.56, r 2 = .11, p = .013]. In contrast, there were no significant correlations for the thalamus (ON: [T(48) = −1.43, r 2 = .04, p = .159] and OFF: [T(45) = −0.83, r 2 = .02, p = .412]) or the visual cortex (ON: [T(51) = −1.20, r 2 = .03, p = .236] and OFF: [T(50) = −0.78, r 2 = .01, p = .438]). These effects did not differ substantially when correcting for age gray matter ratio, and gray to white matter ratios (see supplementary materials). Furthermore, we found that there was no relationship between head motion (estimated using functional MRI [fMRI] scans collected in the same session) and variables of interest (e.g., MDS‐UPDRS, GABA/tCre). Additionally, correcting for head motion did not change the results (see supplementary materials). The negative correlation with UPDRS was specific for GABA, and not present for Glx/tCre (Glx is glutamate + glutamine) (see supplementary materials). Tremor‐dominant patients (but not nontremor patients) also showed a significant negative correlation between disease severity and GABA levels in the thalamus (see supplementary materials).
Figure 3.
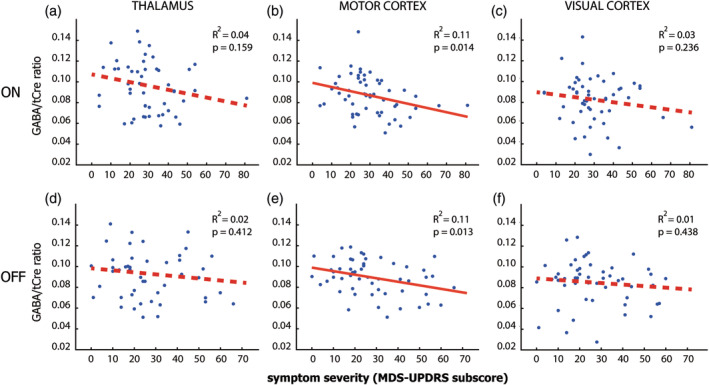
Relationship between GABA and disease severity. Scatterplots of the relation between GABA/tCre and total MDS‐UPDRS scores across the three Parkinson phenotypes, both ON medication (Panels a, c, and e) and OFF medication (Panels b, d, and f) for each of the three regions (first, second, and third columns). Significant correlations are marked with a continuous red line. We find a consistent significant correlation between MDS‐UPDRS scores and GABA levels in the motor cortex, both ON (Panel c) and OFF medication (Panel d), but no significant correlations for the thalamus (Panels a and b) and visual cortex (Panels e and f). GABA, gamma‐aminobutyric acid; MDS‐UPDRS, Movement Disorders Society Unified Parkinson's Disease Rating Scale; tCre, total creatine
3.5. Correlations between motor symptom severity and GABA/tCre ratio
As an exploratory analysis, we tested post hoc whether the correlation between motor cortex GABA and total UPDRS was driven by one of the three motor symptoms (bradykinesia, rigidity, and tremor). We found a significant correlation in the same direction for rigidity, both ON medication, see Figure 4, [T(55) = −2.49, r 2 = .10, p = .016] and OFF medication [T(52) = −2.56, r 2 = .11, p = .013]. In addition, we found a significant correlation for tremor ON medication: [T(36) = −2.14, r 2 = .11, p = .039; BF10 = 3.34] and a trend level correlation OFF medication: [T(33) = −1.18, r 2 = .09, p = .086]. Finally, for bradykinesia, we found a marginal trend‐level correlation ON medication: [T(55) = −1.68, r 2 = .05, p = .099] and no effect OFF medication: [T(52) = −1.131, r 2 = .02, p = .263]. Looking at the overall evidence for each motor symptom, we found that the evidence was strongest for rigidity [BF10 = 7.55], intermediate for tremor [BF10 = 3.62], and weakest for bradykinesia [BF10 = 1.16]. There were no significant differences in the strength of the GABA‐severity correlation between the three motor symptoms (p > .5 for all possible comparisons). Taken together, these findings suggest that the relationship between motor cortex GABA and symptom severity does not differ markedly between symptom type, suggesting that higher motor cortex GABA levels are associated with a more benign symptom expression.
Figure 4.
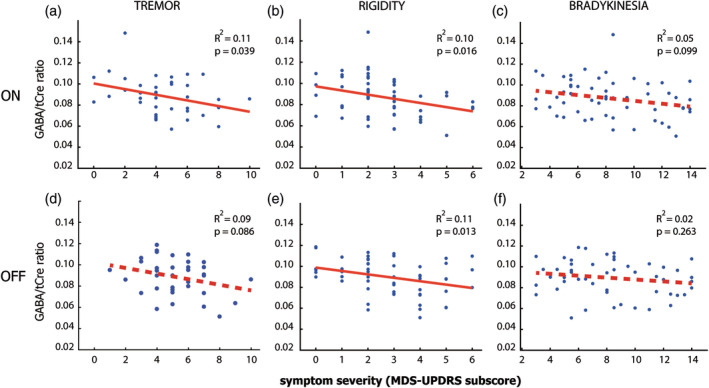
Relationship between motor cortex GABA and motor symptom severity. This figure shows scatterplots of the relationship between GABA/tCre in the motor cortex and MDS‐UPDRS subscores on the most affected side, during ON medication (upper row) and OFF medication (bottom row). The MDS‐UPDRS subscores concern tremor (nonkinetic tremor: Items 15 and 17), (Panels a and b), rigidity (Item 3) (Panels c and d), and bradykinesia (Items 4–8 and 14) (Panels e and f). For definition of subscores, see Table 1. Significant correlations are marked with a continuous red line. We find the most consistent correlation for rigidity both ON and OFF medication, followed by tremor with a significant correlation for tremor ON medication, and at trend level OFF medication. Bradykinesia showed a marginal trend‐level correlation ON medication, but no effect OFF medication, showing that rigidity scores match the results best, but the relationship between motor cortex GABA and symptom severity does not differ markedly between symptom type. GABA, gamma‐aminobutyric acid; MDS‐UPDRS, Movement Disorders Society Unified Parkinson's Disease Rating Scale; tCre, total creatine
4. DISCUSSION
We investigated whether GABA levels in the thalamus and primary motor cortex, as well as a nonmotor control region (visual cortex), differed between Parkinson's disease patients and controls, and whether patient phenotype and dopaminergic medication influenced GABA levels. In line with the classical model of basal ganglia dysfunction (Albin et al., 1989), we expected patients to have higher GABA levels in the thalamus than controls. We further expected GABA levels to positively predict motor symptoms (specifically bradykinesia), and to normalize with dopaminergic medication. In addition, we investigated whether discrepancies between previous findings might be related to patient phenotype. This relationship was explored by including patients with a tremor‐dominant Parkinson's disease phenotype (dopamine‐responsive versus dopamine‐resistant tremor) and patients with a nontremor phenotype. Contrary to our predictions, the present study did not provide positive evidence for effects of disease, phenotype, or dopaminergic medication on GABA levels. In fact, there is a strong and consistent negative relationship between GABA in the motor cortex and symptom severity. This suggests that GABA plays a modulatory role in the pathophysiology of Parkinson's disease, which is independent of dopaminergic medication.
4.1. Parkinson's disease is not associated with increased thalamic GABA
We did not confirm our hypothesis of increased GABA concentrations in the thalamus of Parkinson's disease. Thus, our findings are different from those by Dharmadhikari et al., who showed increased GABA levels in the thalamus of Parkinson's disease patients (Dharmadhikari et al., 2015), or those by Gong et al., who found a reduction of GABA levels in patients in a larger thalamus/basal ganglia voxel (Gong et al., 2017). We considered several possible explanations for this null finding. First, a lack of power due to small sample size is unlikely, since our patient sample (N = 60) was considerably larger than previous samples (n = 22 (Gong et al., 2017), n = 19 (Dharmadhikari et al., 2015). Second, methodological differences may have played a role: previous studies used a GABA‐to‐water ratio, whereas here we used a GABA‐to‐creatine ratio. There is some evidence that in Parkinson's disease, creatine (and NAA) is also reduced in the thalamus and basal ganglia (Gong et al., 2017; Kickler et al., 2007). However, reduced creatine levels in Parkinson's disease would bias us toward confirming, rather than rejecting, our a priori hypothesis of an increased thalamic GABA‐to‐creatine ratio in Parkinson's disease. Also, our findings were unchanged when using the GABA‐to‐Glx ratio. Third, although the voxel we used covers a large portion of the thalamus, by comparing tremor‐dominant and nontremor Parkinson's disease patients, we could partly rule out the possibility that opposing GABAergic changes in different thalamic nuclei may have balanced each other out. More specifically, increased GABA in the anterior ventrolateral nucleus that is involved in bradykinesia and rigidity, and reduced GABA in the posterior ventrolateral nucleus that is involved in tremor (Brodkey et al., 2004; Helmich et al., 2011). If this were the case, then only the nontremor patient group would have shown increased thalamic GABA levels, while in fact there were no differences between clinical phenotypes. Taken together, our findings do not support the idea that increased thalamic GABA levels are associated with Parkinson's disease symptoms, as predicted by the classical basal ganglia model. This is consistent with other pathophysiological models that focus more on abnormal oscillations (Brittain et al., 2014), or that explain Parkinson symptoms by increased thalamic rebound firing rather than enhanced thalamic inhibition (Kim et al., 2017).
4.2. There is an inverse relationship between disease severity and GABA levels in the motor cortex
There are no previous reports of changes in GABA levels in the motor cortex of Parkinson's disease patients. However, our finding that lower GABA levels were associated with higher disease severity is in line with previous work using other modalities: fMRI results showed increased motor cortex BOLD activity in Parkinson's disease during thumb pressing movements, and this effect correlated with higher rigidity scores (Yu et al., 2007). The positive relationship between motor cortex activity (fMRI) and disease severity may reflect the same mechanism as the inverse relationship between motor cortex inhibition (GABA) and disease severity found here: several studies in healthy subjects showed that reduced GABA levels were associated with increased task‐related BOLD responses in the cortex with examples from the motor cortex (Stagg, Bachtiar, & Johansen‐Berg, 2011), the anterior cingulate cortex (Northoff et al., 2007), and visual cortex (Donahue, Near, Blicher, & Jezzard, 2010).
Others have looked at cortical excitability in Parkinson's disease using transcranial magnetic stimulation. Cortical excitability is thought to represent the relative influence of intracortical inhibitory and facilitatory networks (Bunse et al., 2014). Many studies have reported reduced short interval intracortical inhibition (SICI) in Parkinson's disease (Carrillo et al., 2013; MacKinnon, Gilley, Weis‐McNulty, & Simuni, 2005; Rothwell, Day, Thompson, & Kujirai, 2009) and a progressive reduction of SICI with disease progression (Kojovic et al., 2015). Pharmacological studies suggest that SICI is predominantly dependent on (inhibitory) GABAA receptor activity (Ziemann, 2013). As cortical excitability represents the relative influence of intracortical inhibitory and facilitatory networks, it is not clear whether SICI necessarily involves impaired inhibition or is driven by increased intracortical facilitation (MacKinnon et al., 2005). Using MRS, we verified that disease severity was not explained by variations in glutamate: Glx (glutamate + glutamine) concentrations did not correlate with disease severity, while the GABA/Glx ratio followed the same negative correlation as reported for the GABA/tCre ratio (see supplementary materials). This suggests that, within our dataset, it would be a change in cortical inhibition, not facilitation, that explains interindividual variations in disease severity. The functional role of the shifted cortical inhibition/facilitation balance toward enhanced cortical excitation in Parkinson's disease remains unclear. On the one hand, enhanced motor cortex excitability could represent a compensatory downregulation to overcome the excessive inhibitory influence from the basal ganglia (John & Rothwell, 2013). On the other hand, enhanced motor cortex excitability could interfere with processing of inputs from upstream areas, thereby disrupting the encoding of motor parameters—resulting in bradykinesia. The latter interpretation would fit best with our findings.
4.3. Is cerebral GABA beneficial for Parkinson's disease?
The negative correlation between GABA and disease severity we report may relate to converging ideas suggesting that GABA acts as a neuroprotective agent in neurodegenerative disorders. This idea was put forward in the GABA‐collapse hypothesis (Błaszczyk, 2016; Hurley, Brandon, Gentleman, & Dexter, 2013), which proposes that GABAergic input protects neurons from calcium‐based neurotoxicity. This notably affects dopamine neurons, because of high energy requirements and dependence on regular slow calcium‐based pacemaker activity (Hurley et al., 2013). Evidence for the contribution of calcium‐based neurotoxicity in Parkinson's disease comes from postmortem studies showing a brain‐wide imbalance of calcium channels (Hurley et al., 2013). In rats, GABA‐producing transplants increases survival rates of implanted dopaminergic neurons (Winkler, Bentlage, Nikkhah, Samii, & Björklund, 1999). In multiple human intervention studies in late stage Parkinson's disease, upregulating the GABA‐producing glutamic acid decarboxylase protein with gene therapy improved motor symptoms (LeWitt et al., 2011), and less invasive alternatives in the form of GABA receptor modulators, such as benzodiazepines or Zolpidem, have also been reported to help normalize Parkinson's disease related symptoms (Hall et al., 2014; Pourcher, Bonnet, Kefalos, Dubois, & Agid, 1989)—although opinions differ with respect to the use of these drugs (Lavoisy & Marsac, 1997). Outside of the motor system, a study by Firbank et al. showed that visual hallucinations in Parkinson's disease were associated with reduced GABA in the visual cortex, while GABA levels of nonaffected patients showed no difference from control subjects (Firbank et al., 2018). The role of GABA in neurodegeneration is likely not specific to Parkinson's disease, given the role of altered GABA levels in other neurodegenerative diseases such as dystonia (Levy & Hallett, 2002; Marjańska et al., 2013). Taken together, this study provides evidence for an inverse association between motor cortex inhibition (GABA) and disease severity in Parkinson's disease, which may be related to a protective role of GABAergic inhibition. Intervention studies are necessary to test whether a potentiation of GABAergic mechanisms worsens or improves Parkinson's disease symptoms, to establish whether GABA plays a compensatory or pathophysiological role in Parkinson's disease.
4.4. Reliability and limitations
This study consists of a large number of Parkinson's disease subjects (n = 60), with respectable group sizes (n = 23/n = 20/n = 17). Since we measured GABA and MDS‐UPDRS on two independent days (ON and OFF dopaminergic medication), this also provides a measure of replicability. The reported GABA correlations with disease severity were not only strongly significant, but also consistent over sessions: scores on both days yielded similar, significant negative correlations. Furthermore, we were able to rule out that the correlation between GABA and disease severity was driven by age or by gray matter atrophy (see supplementary materials), and GABA/tCre values were comparable to similar studies, especially when considering participants within this age range (Gao et al., 2013; Geramita et al., 2011). We also found that the relative GABA/tCre levels between regions (thalamus > motor cortex > visual cortex) were consistent with other studies (Levy & Hallett, 2002). This study relied on the ratio of GABA to creatine, which may have had mixed consequences; while we do not anticipate problems in our cortical voxels, there are reports of reduced thalamic creatine, which suggest that this may have led to reduced sensitivity for patient GABA reduction in our thalamic region of interest (as discussed above). The sequence in this study was not optimized to eliminate macromolecules from our spectra (which are known to be coedited with the GABA signal at 3 ppm)—thus, a macromolecule estimation was included in the LCModel fit. So far, literature on spectroscopy in PD does not provide evidence for either elevated or reduced macromolecule levels (Emir, Tuite, & Öz, 2012). However, as potential macromolecule signal was not fully eliminated, we cannot exclude the possibility that our results are affected by its presence. Finally, considering the reduced power and sensitivity of MRS in subcortical structures (Bottomley, 1987), it is possible that this approach is not suitable to detect subtle changes in thalamic GABA, or is only sensitive to GABA in specific compartments. According to recent consensus, MRS is most sensitive to extracellular unbound GABA, which is involved in tonic inhibition (Dyke et al., 2017; Rae, 2014; Stagg, 2014). Specifically, extracellular GABA depends on accumulation of GABA spillover from synaptic transmission (Glykys & Mody, 2007), in addition to a small percentage of GABA released by local glia cells (Lee et al., 2010). Intracellularly, GABA is converted from glutamate only when there is a demand in the axon terminal itself, and subsequently contributes only minimally to the MRS signal (Buddhala, Hsu, & Wu, 2009; Martin & Rimvall, 1993). In Parkinson's disease, the predicted increase in tonic inhibition of the thalamus (Redgrave et al., 2010) should therefore lead to increased extracellular GABA, which MRS can measure. Taken together, it is unlikely that our method (MRS) was blind to the thalamic changes predicted by the classical basal ganglia model, and that this explains our negative finding.
5. CONCLUSION
Our findings show that GABA concentrations in the primary motor cortex are inversely correlated with disease severity, independent of dopaminergic medication (i.e., present across OFF and ON dopaminergic medication sessions), and independent of the type of motor symptom. This suggests that GABA may play a modulatory role in the pathophysiology of Parkinson's disease, independent of dopaminergic denervation. We speculate that cerebral GABA might have a protective role, either at the neuronal level (e.g., by preventing calcium‐based neurotoxicity) or at the circuit level (e.g., by preventing dysfunctional motor hyperactivity). If proven to be correct in further studies (using other modalities, e.g., flumazenil PET), a potential neuroprotective role of GABAergic mechanisms could have important implications for the treatment of patients with Parkinson's disease.
CONFLICT OF INTEREST
R.H. serves on the clinical advisory board of Cadent Therapeutics, and received honoraria from AbbVie.
Supporting information
Supplementary Table 1 Total patients and Controls in each group of whom we have datasets available (total) on both days. For each region is depicted which spectra could be estimated reliably with an %SD < 50, and the number of spectra did not meet these requirements; (accepted %SD < 50|rejected).
Supplementary Figure 1: Tremor patients only; correlation of total UPDRS scores (averaged over both scanning days) and GABA/total creatine ratio. A) We find a significant decrease in GABA for higher UPDRS scores in the Thalamus, B) and a strongly significant decrease in the motor cortex. C) We find no correlation in the visual cortex
Supplementary Figure 2: Gray Matter (GM) to White Matter (WM) ratios (GM/WM) measured in all subgroups in the three regions of interest (thalamus, motor cortex, visual cortex). Yellow depicts the Healthy Controls (n = 22) with the three Parkinson Disease (PD) phenotypes in blue (PD resiSTant to dopamine (n = 17), PD respoNDing to dopamine (n = 23) and PD Non‐Tremor (n = 20). Histograms indicate mean and standard error of the mean (in black). There is no significant difference between subgroups for each of the three regions of interest.
ACKNOWLEDGMENTS
The authors would like to acknowledge M. Heijmans for her help in aiding data collection in this study. A.N. was funded by an internal grant of the Donders Institute (Donders TopTalent), M.D was supported by a grant of the Dutch Brain Foundation (grant F2013(1)‐15 to R.H.). R.H was supported by a VENI grant from the Netherlands Organization for Scientific Research. The Parkinson Center of the Radboud university medical center was supported by a center of excellence grant of the Parkinson's Foundation.
van Nuland AJM, den Ouden HEM, Zach H, et al. GABAergic changes in the thalamocortical circuit in Parkinson's disease. Hum Brain Mapp. 2020;41:1017–1029. 10.1002/hbm.24857
Funding information Donders Top Talent, Grant/Award Number: 2014; Hersenstichting, Grant/Award Number: F2013(1)‐15; Parkinson's Foundation; VENI grant from the Netherlands Organization for Scientific Research
DATA AVAILABILITY STATEMENT
The data that support the findings of this study are available from the corresponding author upon reasonable request.
REFERENCES
- Albin, R. L. , Young, A. B. , & Penney, J. B. (1989). The functional anatomy of basal ganglia disorders. Trends in Neurosciences, 12(10), 366–375. 10.1016/0166-2236(89)90074-X [DOI] [PubMed] [Google Scholar]
- Błaszczyk, J. W. (2016). Parkinson's disease and neurodegeneration: GABA‐collapse hypothesis. Frontiers in Neuroscience, 10(503), 76–78. 10.3389/fnins.2016.00269 [DOI] [PMC free article] [PubMed] [Google Scholar]
- Bottomley, P. A. (1987). Spatial localization in NMR spectroscopy in vivo. Annals of the New York Academy of Sciences, 508(1), 333–348. 10.1111/j.1749-6632.1987.tb32915.x [DOI] [PubMed] [Google Scholar]
- Brittain, J. S. , Sharott, A. , & Brown, P. (2014). The highs and lows of beta activity in cortico‐basal ganglia loops. European Journal of Neuroscience, 39(11), 1951–1959. 10.1111/ejn.12574 [DOI] [PMC free article] [PubMed] [Google Scholar]
- Brodkey, J. A. , Tasker, R. R. , Hamani, C. , McAndrews, M. P. , Dostrovsky, J. O. , & Lozano, A. M. (2004). Tremor cells in the human thalamus: Differences among neurological disorders. Journal of Neurosurgery, 101(1), 43–47. 10.3171/jns.2004.101.1.0043 [DOI] [PubMed] [Google Scholar]
- Buddhala, C. , Hsu, C.‐C. , & Wu, J.‐Y. (2009). A novel mechanism for GABA synthesis and packaging into synaptic vesicles. Neurochemistry International, 55(1–3), 9–12. 10.1016/j.neuint.2009.01.020 [DOI] [PubMed] [Google Scholar]
- Bunse, T. , Wobrock, T. , Strube, W. , Padberg, F. , Palm, U. , Falkai, P. , & Hasan, A. (2014). Motor cortical excitability assessed by transcranial magnetic stimulation in psychiatric disorders: A systematic review. Brain Stimulation: Basic, Translational, and Clinical Research in Neuromodulation, 7(2), 158–169. 10.1016/j.brs.2013.08.009 [DOI] [PubMed] [Google Scholar]
- Cantello, R. , Gianelli, M. , Bettucci, D. , Civardi, C. , De Angelis, M. , & Mutani, R. (1991). Parkinson's disease rigidity magnetic motor evoked potentials in a small hand muscle. Neurology, 41(9), 1449–1449, 1456. 10.1212/WNL.41.9.1449 [DOI] [PubMed] [Google Scholar]
- Carrillo, F. , Palomar, F. J. , Conde, V. , Diaz‐Corrales, F. J. , Porcacchia, P. , Fernández‐del‐Olmo, M. , … Mir, P. (2013). Study of cerebello‐thalamocortical pathway by transcranial magnetic stimulation in Parkinson's disease. Brain Stimulation: Basic, Translational, and Clinical Research in Neuromodulation, 6(4), 582–589. 10.1016/j.brs.2012.12.004 [DOI] [PubMed] [Google Scholar]
- Caulo, M. , Briganti, C. , Mattei, P. , Perfetti, B. , Ferretti, A. , Romani, G. , … Colosimo, C. (2007). New morphologic variants of the hand motor cortex as seen with MR imaging in a large study population. American Journal of Neuroradiology, 28(8), 1480–1485. 10.3174/ajnr.A0597 [DOI] [PMC free article] [PubMed] [Google Scholar]
- Dharmadhikari, S. , Ma, R. , Yeh, C.‐L. , Stock, A.‐K. , Snyder, S. , Zauber, S. E. , … Beste, C. (2015). Striatal and thalamic GABA level concentrations play differential roles for the modulation of response selection processes by proprioceptive information. NeuroImage, 120, 36–42. 10.1016/j.neuroimage.2015.06.066 [DOI] [PMC free article] [PubMed] [Google Scholar]
- Diedenhofen, B. , & Musch, J. (2015). Cocor: A comprehensive solution for the statistical comparison of correlations. PLoS One, 10(4), e0121945 10.1371/journal.pone.0121945 [DOI] [PMC free article] [PubMed] [Google Scholar]
- Dirkx, M. F. , den Ouden, H. E. , Aarts, E. , Timmer, M. H. , Bloem, B. R. , Toni, I. , & Helmich, R. C. (2017). Dopamine controls Parkinson's tremor by inhibiting the cerebellar thalamus. Brain, 140(3), 721–734. 10.1093/brain/aww331 [DOI] [PubMed] [Google Scholar]
- Dirkx, M. F. , Zach, H. , Bloem, B. R. , Hallett, M. , & Helmich, R. C. (2018). The nature of postural tremor in Parkinson disease. Neurology, 90(13), e1095–e1103 10.1212/WNL.0000000000005215 [DOI] [PMC free article] [PubMed] [Google Scholar]
- Donahue, M. J. , Near, J. , Blicher, J. U. , & Jezzard, P. (2010). Baseline GABA concentration and fMRI response. NeuroImage, 53(2), 392–398. 10.1016/j.neuroimage.2010.07.017 [DOI] [PubMed] [Google Scholar]
- Dyke, K. , Pépés, S. E. , Chen, C. , Kim, S. , Sigurdsson, H. P. , Draper, A. , … Morris, P. G. (2017). Comparing GABA‐dependent physiological measures of inhibition with proton magnetic resonance spectroscopy measurement of GABA using ultra‐high‐field MRI. NeuroImage, 152, 360–370. 10.1016/j.neuroimage.2017.03.011 [DOI] [PMC free article] [PubMed] [Google Scholar]
- Ellens, D. J. , & Leventhal, D. K. (2013). Electrophysiology of basal ganglia and cortex in models of Parkinson disease. Journal of Parkinson's Disease, 3(3), 241–254. 10.3233/JPD-130204 [DOI] [PMC free article] [PubMed] [Google Scholar]
- Emir, U. E. , Tuite, P. J. , & Öz, G. (2012). Elevated pontine and putamenal GABA levels in mild‐moderate Parkinson disease detected by 7 tesla proton MRS. PLoS One, 7(1), e30918 10.1371/journal.pone.0030918 [DOI] [PMC free article] [PubMed] [Google Scholar]
- Firbank, M. J. , Parikh, J. , Murphy, N. , Killen, A. , Allan, C. L. , Collerton, D. , … Taylor, J.‐P. (2018). Reduced occipital GABA in Parkinson disease with visual hallucinations. Neurology, 91(7), e675–e685. 10.1212/WNL.0000000000006007 [DOI] [PMC free article] [PubMed] [Google Scholar]
- Gao, F. , Edden, R. A. , Li, M. , Puts, N. A. , Wang, G. , Liu, C. , … Zhao, C. (2013). Edited magnetic resonance spectroscopy detects an age‐related decline in brain GABA levels. NeuroImage, 78, 75–82. 10.1016/j.neuroimage.2013.04.012 [DOI] [PMC free article] [PubMed] [Google Scholar]
- Geramita, M. , van der Veen, J. W. , Barnett, A. S. , Savostyanova, A. A. , Shen, J. , Weinberger, D. R. , & Marenco, S. (2011). Reproducibility of prefrontal γ‐aminobutyric acid measurements with J‐edited spectroscopy. NMR in Biomedicine, 24(9), 1089–1098. 10.1002/nbm.1662 [DOI] [PubMed] [Google Scholar]
- Gerlach, M. , Gsell, W. , Kornhuber, J. , Jellinger, K. , Krieger, V. , Pantucek, F. , … Riederer, P. (1996). A post mortem study on neurochemical markers of dopaminergic, GABA‐ergic and glutamatergic neurons in basal ganglia‐thalamocortical circuits in Parkinson syndrome. Brain Research, 741(1), 142–152. 10.1016/S0006-8993(96)00915-8 [DOI] [PubMed] [Google Scholar]
- Glykys, J. , & Mody, I. (2007). The main source of ambient GABA responsible for tonic inhibition in the mouse hippocampus. The Journal of Physiology, 582(3), 1163–1178. 10.1113/jphysiol.2007.134460 [DOI] [PMC free article] [PubMed] [Google Scholar]
- Gong, T. , Xiang, Y. , Saleh, M. G. , Gao, F. , Chen, W. , Edden, R. A. , & Wang, G. (2017). Inhibitory motor dysfunction in Parkinson's disease subtypes. Journal of Magnetic Resonance Imaging, 47(6), 1610–1615. 10.1002/jmri.25865 [DOI] [PMC free article] [PubMed] [Google Scholar]
- Hall, S. , Prokic, E. , McAllister, C. , Ronnqvist, K. , Williams, A. , Yamawaki, N. , … Stanford, I. (2014). GABA‐mediated changes in inter‐hemispheric beta frequency activity in early‐stage Parkinson's disease. Neuroscience, 281, 68–76. 10.1016/j.neuroscience.2014.09.037 [DOI] [PMC free article] [PubMed] [Google Scholar]
- Hamani, C. , Dostrovsky, J. O. , & Lozano, A. M. (2006). The motor thalamus in neurosurgery. Neurosurgery, 58(1), 146–158. 10.1227/01.NEU.0000192166.62017.C1 [DOI] [PubMed] [Google Scholar]
- Helmich, R. C. (2018). The cerebral basis of Parkinsonian tremor: A network perspective. Movement Disorders, 33(2), 219–231. 10.1002/mds.27224 [DOI] [PubMed] [Google Scholar]
- Helmich, R. C. , Janssen, M. J. , Oyen, W. J. , Bloem, B. R. , & Toni, I. (2011). Pallidal dysfunction drives a cerebellothalamic circuit into Parkinson tremor. Annals of Neurology, 69(2), 269–281. 10.1002/ana.22361 [DOI] [PubMed] [Google Scholar]
- Hurley, M. J. , Brandon, B. , Gentleman, S. M. , & Dexter, D. T. (2013). Parkinson's disease is associated with altered expression of CaV1 channels and calcium‐binding proteins. Brain, 136(7), 2077–2097. 10.1093/brain/awt134 [DOI] [PubMed] [Google Scholar]
- Hutchison, W. , Lozano, A. , Davis, K. , Saint‐Cyr, J. , Lang, A. , & Dostrovsky, J. (1994). Differential neuronal activity in segments of globus pallidus in Parkinson's disease patients. Neuroreport, 5(12), 1533–1537. [DOI] [PubMed] [Google Scholar]
- Hutchison, W. D. , Dostrovsky, J. O. , Walters, J. R. , Courtemanche, R. , Boraud, T. , Goldberg, J. , & Brown, P. (2004). Neuronal oscillations in the basal ganglia and movement disorders: Evidence from whole animal and human recordings. Journal of Neuroscience, 24(42), 9240–9243. 10.1523/JNEUROSCI.3366-04.2004 [DOI] [PMC free article] [PubMed] [Google Scholar]
- John, C. , & Rothwell, M. J. E. (2013). Parkinson's disease In Handbook of clinical neurology (Vol. 116, pp. 535–542). Amsterdam: Elsevier. [DOI] [PubMed] [Google Scholar]
- Kickler, N. , Krack, P. , Fraix, V. , Lebas, J. F. , Lamalle, L. , Durif, F. , … Pollak, P. (2007). Glutamate measurement in Parkinson's disease using MRS at 3 T field strength. NMR in Biomedicine, 20(8), 757–762. 10.1002/nbm.1141 [DOI] [PubMed] [Google Scholar]
- Kim, J. , Kim, Y. , Nakajima, R. , Shin, A. , Jeong, M. , Park, A. H. , … Park, H. (2017). Inhibitory basal ganglia inputs induce excitatory motor signals in the thalamus. Neuron, 95(5), 1181–1196. e1188. 10.1016/j.neuron.2017.08.028 [DOI] [PubMed] [Google Scholar]
- Kish, S. J. , Shannak, K. , & Hornykiewicz, O. (1988). Uneven pattern of dopamine loss in the striatum of patients with idiopathic Parkinson's disease. New England Journal of Medicine, 318(14), 876–880. 10.1056/NEJM198804073181402 [DOI] [PubMed] [Google Scholar]
- Kojovic, M. , Kassavetis, P. , Bologna, M. , Pareés, I. , Rubio‐Agusti, I. , Beraredelli, A. , … Bhatia, K. P. (2015). Transcranial magnetic stimulation follow‐up study in early Parkinson's disease: A decline in compensation with disease progression? Movement Disorders, 30(8), 1098–1106. 10.1002/mds.26167 [DOI] [PubMed] [Google Scholar]
- Kreis, R. (2016). The trouble with quality filtering based on relative Cramér‐Rao lower bounds. Magnetic Resonance in Medicine, 75(1), 15–18. 10.1002/mrm.25568 [DOI] [PubMed] [Google Scholar]
- Lavoisy, J. , & Marsac, J. (1997). Zolpidem in Parkinson's disease. The Lancet, 350(9070), 74 10.1016/S0140-6736(05)66285-X [DOI] [PubMed] [Google Scholar]
- Lee, S. , Yoon, B.‐E. , Berglund, K. , Oh, S.‐J. , Park, H. , Shin, H.‐S. , … Lee, C. J. (2010). Channel‐mediated tonic GABA release from glia. Science, 330(6005), 790–796. 10.1126/science.1184334 [DOI] [PubMed] [Google Scholar]
- Levy, L. M. , & Hallett, M. (2002). Impaired brain GABA in focal dystonia. Annals of Neurology, 51(1), 93–101. 10.1002/ana.10073 [DOI] [PubMed] [Google Scholar]
- Levy, R. , Dostrovsky, J. , Lang, A. , Sime, E. , Hutchison, W. , & Lozano, A. (2001). Effects of apomorphine on subthalamic nucleus and globus pallidus internus neurons in patients with Parkinson's disease. Journal of Neurophysiology, 86(1), 249–260. 10.1152/jn.2001.86.1.249 [DOI] [PubMed] [Google Scholar]
- LeWitt, P. A. , Rezai, A. R. , Leehey, M. A. , Ojemann, S. G. , Flaherty, A. W. , Eskandar, E. N. , … Siddiqui, M. S. (2011). AAV2‐GAD gene therapy for advanced Parkinson's disease: A double‐blind, sham‐surgery controlled, randomised trial. The Lancet Neurology, 10(4), 309–319. 10.1016/S1474-4422(11)70039-4 [DOI] [PubMed] [Google Scholar]
- Lima, C. F. , Meireles, L. P. , Fonseca, R. , Castro, S. L. , & Garrett, C. (2008). The frontal assessment battery (FAB) in Parkinson's disease and correlations with formal measures of executive functioning. Journal of Neurology, 255(11), 1756–1761. 10.1007/s00415-008-0024-6 [DOI] [PubMed] [Google Scholar]
- Llinás, R. R. (1988). The intrinsic electrophysiological properties of mammalian neurons: Insights into central nervous system function. Science, 242(4886), 1654–1664. 10.1126/science.3059497 [DOI] [PubMed] [Google Scholar]
- MacKinnon, C. D. , Gilley, E. A. , Weis‐McNulty, A. , & Simuni, T. (2005). Pathways mediating abnormal intracortical inhibition in Parkinson's disease. Annals of Neurology, 58(4), 516–524. 10.1002/ana.20599 [DOI] [PubMed] [Google Scholar]
- Magnin, M. , Morel, A. , & Jeanmonod, D. (2000). Single‐unit analysis of the pallidum, thalamus and subthalamic nucleus in parkinsonian patients. Neuroscience, 96(3), 549–564. 10.1016/S0306-4522(99)00583-7 [DOI] [PubMed] [Google Scholar]
- Marjańska, M. , Lehéricy, S. , Valabrègue, R. , Popa, T. , Worbe, Y. , Russo, M. , … Gallea, C. (2013). Brain dynamic neurochemical changes in dystonic patients: A magnetic resonance spectroscopy study. Movement Disorders, 28(2), 201–209. 10.1002/mds.25279 [DOI] [PMC free article] [PubMed] [Google Scholar]
- Martin, D. L. , & Rimvall, K. (1993). Regulation of γ‐aminobutyric acid synthesis in the brain. Journal of Neurochemistry, 60(2), 395–407. 10.1111/j.1471-4159.1993.tb03165.x [DOI] [PubMed] [Google Scholar]
- Mescher, M. , Merkle, H. , Kirsch, J. , Garwood, M. , & Gruetter, R. (1998). Simultaneous in vivo spectral editing and water suppression. NMR in Biomedicine, 11(6), 266–272. [DOI] [PubMed] [Google Scholar]
- Mullins, P. G. , McGonigle, D. J. , O'gorman, R. L. , Puts, N. A. , Vidyasagar, R. , Evans, C. J. , & Edden, R. A. (2014). Current practice in the use of MEGA‐PRESS spectroscopy for the detection of GABA. NeuroImage, 86, 43–52. 10.1016/j.neuroimage.2012.12.004 [DOI] [PMC free article] [PubMed] [Google Scholar]
- Nelson, A. B. , & Kreitzer, A. C. (2014). Reassessing models of basal ganglia function and dysfunction. Annual Review of Neuroscience, 37, 117–135. 10.1146/annurev-neuro-071013-013916 [DOI] [PMC free article] [PubMed] [Google Scholar]
- Northoff, G. , Walter, M. , Schulte, R. F. , Beck, J. , Dydak, U. , Henning, A. , … Boesiger, P. (2007). GABA concentrations in the human anterior cingulate cortex predict negative BOLD responses in fMRI. Nature Neuroscience, 10(12), 1515–1517. 10.1038/nn2001 [DOI] [PubMed] [Google Scholar]
- Ogg, R. J. , Kingsley, R. , & Taylor, J. S. (1994). WET, a T1‐and B1‐insensitive water‐suppression method for in vivo localized 1H NMR spectroscopy. Journal of Magnetic Resonance, Series B, 104(1), 1–10. [DOI] [PubMed] [Google Scholar]
- Pourcher, E. , Bonnet, A. M. , Kefalos, J. , Dubois, B. , & Agid, Y. (1989). Effects of etybenzatropine and diazepam on levodopa‐induced diphasic dyskinesias in Parkinson's disease. Movement Disorders, 4(3), 195–201. 10.1002/mds.870040301 [DOI] [PubMed] [Google Scholar]
- Provencher, S. W. (2001). Automatic quantitation of localized in vivo1H spectra with LCModel. NMR in Biomedicine, 14(4), 260–264. 10.1002/nbm.698 [DOI] [PubMed] [Google Scholar]
- Rae, C. D. (2014). A guide to the metabolic pathways and function of metabolites observed in human brain 1 H magnetic resonance spectra. Neurochemical Research, 39(1), 1–36. 10.1007/s11064-013-1199-5 [DOI] [PubMed] [Google Scholar]
- Redgrave, P. , Rodriguez, M. , Smith, Y. , Rodriguez‐Oroz, M. C. , Lehericy, S. , Bergman, H. , … Obeso, J. A. (2010). Goal‐directed and habitual control in the basal ganglia: Implications for Parkinson's disease. Nature Reviews Neuroscience, 11(11), 760–772. 10.1038/nrn2915 [DOI] [PMC free article] [PubMed] [Google Scholar]
- Rodriguez‐Oroz, M. C. , Jahanshahi, M. , Krack, P. , Litvan, I. , Macias, R. , Bezard, E. , & Obeso, J. A. (2009). Initial clinical manifestations of Parkinson's disease: Features and pathophysiological mechanisms. The Lancet Neurology, 8(12), 1128–1139. 10.1016/S1474-4422(09)70293-5 [DOI] [PubMed] [Google Scholar]
- Rothwell, J. , Day, B. , Thompson, P. , & Kujirai, T. (2009). Short latency intracortical inhibition: One of the most popular tools in human motor neurophysiology. The Journal of Physiology, 587(1), 11–12. 10.1113/jphysiol.2008.162461 [DOI] [PMC free article] [PubMed] [Google Scholar]
- Stagg, C. J. (2014). Magnetic resonance spectroscopy as a tool to study the role of GABA in motor‐cortical plasticity. NeuroImage, 86, 19–27. 10.1016/j.neuroimage.2013.01.009 [DOI] [PubMed] [Google Scholar]
- Stagg, C. J. , Bachtiar, V. , & Johansen‐Berg, H. (2011). The role of GABA in human motor learning. Current Biology, 21(6), 480–484. 10.1016/j.cub.2011.01.069 [DOI] [PMC free article] [PubMed] [Google Scholar]
- Stefani, A. (2011). Reduced GABA content in the motor thalamus during effective deep brain stimulation of the subthalamic nucleus. Frontiers in Systems Neuroscience, 5, 17 10.3389/fnsys.2011.00017 [DOI] [PMC free article] [PubMed] [Google Scholar]
- Stefani, A. , Fedele, E. , Vitek, J. , Pierantozzi, M. , Galati, S. , Marzetti, F. , … Stanzione, P. (2011). The clinical efficacy of L‐DOPA and STN‐DBS share a common marker: Reduced GABA content in the motor thalamus. Cell Death & Disease, 2(5), e154 10.1038/cddis.2011.35 [DOI] [PMC free article] [PubMed] [Google Scholar]
- Uhlhaas, P. J. , & Singer, W. (2006). Neural synchrony in brain disorders: Relevance for cognitive dysfunctions and pathophysiology. Neuron, 52(1), 155–168. 10.1016/j.neuron.2006.09.020 [DOI] [PubMed] [Google Scholar]
- Wagenmakers, E.‐J. , Love, J. , Marsman, M. , Jamil, T. , Ly, A. , Verhagen, J. , … Boutin, B. (2018). Bayesian inference for psychology. Part II: Example applications with JASP. Psychonomic Bulletin & Review, 25(1), 58–76. 10.3758/s13423-017-1323-7 [DOI] [PMC free article] [PubMed] [Google Scholar]
- Winkler, C. , Bentlage, C. , Nikkhah, G. , Samii, M. , & Björklund, A. (1999). Intranigral transplants of GABA‐rich striatal tissue induce behavioral recovery in the rat Parkinson model and promote the effects obtained by intrastriatal dopaminergic transplants. Experimental Neurology, 155(2), 165–186. 10.1006/exnr.1998.6916 [DOI] [PubMed] [Google Scholar]
- Yu, H. , Sternad, D. , Corcos, D. M. , & Vaillancourt, D. E. (2007). Role of hyperactive cerebellum and motor cortex in Parkinson's disease. NeuroImage, 35(1), 222–233. 10.1016/j.neuroimage.2006.11.047 [DOI] [PMC free article] [PubMed] [Google Scholar]
- Ziemann, U. (2013). Pharmaco‐transcranial magnetic stimulation studies of motor excitability In Handbook of Clinical Neurology (Vol. 116, pp. 387–397). Amsterdam: Elsevier. [DOI] [PubMed] [Google Scholar]
Associated Data
This section collects any data citations, data availability statements, or supplementary materials included in this article.
Supplementary Materials
Supplementary Table 1 Total patients and Controls in each group of whom we have datasets available (total) on both days. For each region is depicted which spectra could be estimated reliably with an %SD < 50, and the number of spectra did not meet these requirements; (accepted %SD < 50|rejected).
Supplementary Figure 1: Tremor patients only; correlation of total UPDRS scores (averaged over both scanning days) and GABA/total creatine ratio. A) We find a significant decrease in GABA for higher UPDRS scores in the Thalamus, B) and a strongly significant decrease in the motor cortex. C) We find no correlation in the visual cortex
Supplementary Figure 2: Gray Matter (GM) to White Matter (WM) ratios (GM/WM) measured in all subgroups in the three regions of interest (thalamus, motor cortex, visual cortex). Yellow depicts the Healthy Controls (n = 22) with the three Parkinson Disease (PD) phenotypes in blue (PD resiSTant to dopamine (n = 17), PD respoNDing to dopamine (n = 23) and PD Non‐Tremor (n = 20). Histograms indicate mean and standard error of the mean (in black). There is no significant difference between subgroups for each of the three regions of interest.
Data Availability Statement
The data that support the findings of this study are available from the corresponding author upon reasonable request.