Abstract
Resting‐state analyses evaluating large‐scale brain networks have largely focused on static correlations in brain activity over extended time periods, however emerging approaches capture time‐varying or dynamic patterns of transient functional networks. In light of these new approaches, there is a need to classify common transient network states (TNS) in terms of their spatial and dynamic properties. To fill this gap, two independent resting state scans collected in 462 healthy adults from the Human Connectome Project were evaluated using coactivation pattern analysis to identify (eight) TNS that recurred across participants and over time. These TNS spatially overlapped with prototypical resting state networks, but also diverged in notable ways. In particular, analyses revealed three TNS that shared cortical midline overlap with the default mode network (DMN), but these “complex” DMN states also encompassed distinct regions that fall beyond the prototypical DMN, suggesting that the DMN defined using static methods may represent the average of distinct complex‐DMN states. Of note, dwell time was higher in “complex” DMN states, challenging the idea that the prototypical DMN, as a single unit, is the dominant resting‐state network as typically defined by static resting state methods. In comparing the two resting state scans, we also found high reliability in the spatial organization and dynamic activities of network states involving DMN or sensorimotor regions. Future work will determine whether these TNS defined by coactivation patterns are in other samples, and are linked to fundamental cognitive properties.
Keywords: coactivation pattern analysis, dynamics, Human Connectome Project, resting state, transient network states
1. INTRODUCTION
The coordinated activity of spatially distributed brain systems gives rise to large‐scale brain networks that are believed to reflect or contribute to cognitive and behavioral functioning (Biswal et al., 2010; Smith et al., 2009), including functions relevant to health and disease (Buckner, Andrews‐Hanna, & Schacter, 2008; Buckner & Krienen, 2013). Methods for evaluating large‐scale brain networks have focused on resting‐state functional connectivity, that is, correlations in activity of distributed regions during periods of rest, usually focusing on static or overarching temporal correlations over an extended period of time (6 min or longer). Of note, large‐scale networks derived from this approach appear to mirror structural brain connectivity (Greicius, Supekar, Menon, & Dougherty, 2009), supporting their use as a functional proxy for (relatively) stable aspects of network organization. However, these static approaches are not designed to capture time‐varying or dynamic patterns of functional coordination among distributed brain systems, for example, as transient networks form and dissolve, or as transitions occur between networks over time (Hutchison et al., 2013). Such dynamic properties may be critical for understanding essential features of large‐scale network functioning (Bray, Arnold, Levy, & Iaria, 2015; Chang, Liu, Chen, Liu, & Duyn, 2013), and may provide critical insight into the neural properties that underlie or reflect human cognition and health.
In recent years, interest in large‐scale network dynamics has motivated a surge of methods development (related reviews in Cabral, Kringelbach, & Deco, 2014; Hutchison et al., 2013; Liu, Zhang, Chang, & Duyn, 2018; Preti, Bolton, & Van De Ville, 2017). For example, one set of sliding window methods evaluates changes in the magnitude of functional connectivity by truncating the timeseries into a sequence of (often overlapping) windows and computing correlations in activation within each window. Then, estimates of functional connectivity across the brain and over time can be subjected to additional analyses depending on the dynamic property of interest, (e.g., variability in functional connectivity; Kaiser et al., 2016; Pelletier‐Baldelli, Andrews‐Hanna, & Mittal, 2018) or to determine recurring spatial patterns of functional connectivity among regions (or intrinsic connectivity states; Allen et al., 2014). Of note, careful motion correction and confound analysis are especially important when using these methods, as motion may give rise to spurious variability in estimates of functional connectivity across windows (Hindriks et al., 2016; Laumann et al., 2016). A second set of methods does not rely on sliding windows, but instead evaluates synchrony in the magnitude (Chen, Chang, Greicius, & Glover, 2015; Liu, Chang, & Duyn, 2013) or phase (Cabral, Hugues, Sporns, & Deco, 2011; Deco & Kringelbach, 2016) of activation across spatial areas of the brain at a single time‐point (volume of data). For example, coactivation pattern (CAP) analysis is a data‐driven analytic technique that uses the spatial distribution and magnitude of activation at each timepoint of whole‐brain data as input to a clustering analysis to identify recurring states of relative‐coactivation across the brain, thereby identifying transient network states (TNS) of coactivation (Liu et al., 2018). The data‐driven nature of the CAP approach, and its robustness to sources of noise, make this particularly appealing approach for investigating network dynamics.
The application of the above methods has indicated that network dynamics are relevant to psychological processes. For example, research has yielded early evidence that network dynamics are associated with individual differences in development (Faghiri, Stephen, Wang, Wilson, & Calhoun, 2018; Hutchison & Morton, 2015; Marusak et al., 2017; Tian, Li, Wang, & Yu, 2018) and cognitive functioning (Cohen, 2018; Kaiser et al., 2018; Medaglia et al., 2018), and can provide insight into mental health (Damaraju et al., 2014; Kaiser et al., 2016, 2018; Kaiser, Snyder, et al., 2018; Ma, Calhoun, Phlypo, & Adali, 2014; Rashid et al., 2016; Rashid, Damaraju, Pearlson, & Calhoun, 2014). However, more work is needed to evaluate the reliability of the spatial organization of TNS, and to understand the extent to which these properties are common across people or time. This is a necessary first step, to link transient networks to cognitive processes or individual differences in cognition. Moreover, relatively little work has focused on the dynamic activities of transient networks, including the time spent in a network state, or the frequency of transitions from one network state to another. Investigation of such dynamic properties may provide novel information about the dominance or role of particular network states, as well as how states interact. Further, these analyses have the ability to deepen the field's understanding of the prototypical static resting‐state networks. It is plausible that the states defined on a smaller timescale may overlap with the more classically defined resting state networks, while also revealing new insight into the temporal qualities of large‐scale networks. To achieve this goal, a large sample of healthy adults from the Human Connectome Project (HCP) were evaluated using the CAP analytic approach (Liu et al., 2013, 2018). The reliability of state properties was also assessed within‐subject across two resting state acquisitions.
2. METHODS
2.1. Participants
Data used in these analyses include resting state scans from individuals gathered as part of the Human Connectome Project (HCP) 1200 subject release. A detailed description of the recruitment for the HCP is provided by others (Glasser et al., 2016; Van Essen et al., 2013). Briefly, individuals were excluded by the HCP if they reported a history of major psychiatric disorder, neurological disorder, or medical disorder known to influence brain function. Given our objective to characterize the dynamic activities and organization of transient networks in a relatively neurotypical sample, individuals from the HCP database were further excluded if they reported a family history of schizophrenia, met DSM‐IV criteria for alcohol dependence, or reported a lifetime history of repeated substance use (>10 instances of cocaine, hallucinogen, opiate, sedatives, or stimulant use, >20 instances of tobacco use or >100 instances of marijuana use). In addition, participants included in the present analyses provided a breath sample indicating <0.05 blood alcohol content on the day of scan and a urine sample that was negative for any substances of abuse (cocaine, marijuana, opiates, amphetamine, or methamphetamine).
The final data set included 462 individuals (Female = 281) who were an average age of 28.66 years of age (±3.65, range 22–36) and reported completing an average of 15.34 years of education (±1.59, range 11–17). Three hundred and fifty‐one participants self‐identified as White, 64 identified as Black or African American, 35 identified as Asian, Native Hawaiian, or Pacific Islander, six identified as multiracial, and six were unknown or not reported.
2.2. fMRI data acquisition
Neuroimaging data were acquired with a standard 32‐channel head coil on a Siemens 3T Skyra modified to achieve a maximum gradient strength of 100 mT/m (Glasser et al., 2016; Ugurbil et al., 2013; Van Essen et al., 2013). Gradient‐echo EPI images were acquired with the following parameters: TR = 720 ms, TE = 33.1 ms, flip angle = 52°, FOV = 208 × 180 mm (POxPE), Matrix = 104 × 90 (ROxPE), Echo spacing = 0.58 ms, BW = 2,290 Hz/Px. Slice thickness was set to 2.0 mm, 72 slices, 2.0 mm isotropic voxels, with a multiband acceleration factor of 8.
Resting state data were acquired across two sessions on consecutive days (REST1, REST2) with a total of four runs of approximately 14.4 min each. Within each session, one run was acquired with a right‐to‐left phase encoding and the other run was acquired with a left‐to‐right phase encoding. Thus, REST1 and REST2 are each comprised of 28.8 min of data. During each of these runs participants were instructed to lie with their eyes open and fixated on a bright cross‐hair on a dark background.
2.3. Preprocessing
The current study used the “fix extended” resting state data from the HCP 1200 subjects release. Preprocessing steps included gradient unwarping, motion correction, fieldmap‐based EPI distortion correction, brain‐boundary‐based registration of EPI to structural T1‐weighted images, nonlinear FNIRT registration to the MNI152, and grand‐mean intensity normalization using tools from FSL and Freesurfer (Glasser et al., 2013) and noise identification and removal using the FSL program FIX (Griffanti et al., 2014; Salimi‐Khorshidi et al., 2014).
Time courses were extracted from all REST1 and REST2 data using 129 regions of interest (ROIs) consisting of cortical and striatal regions in a large sample of 1,000 adult subjects (drawn from a parcellation: Choi, Yeo & Buckner, 2012: Yeo et al., 2011, http://www.freesurfer.net/fswiki/StriatumParcellation_Choi2012, http://www.freesurfer.net/fswiki/CorticalParcellation_Yeo2011), and the amygdala (from the automated anatomical labeling atlas (http://www.gin.cnrs.fr/en/tools/aal-aal2/)). For REST1 and REST2 data separately, 20 volumes were removed from the start of each timeseries to allow for signal stabilization, and timeseries were concatenated within and across participants.
2.4. Coactivation pattern analysis
A summary of the analytic steps is presented in Figure 1. Within REST1, a k means clustering analysis of coactivation patterns (CAPs) was conducted to identify “states” of resting brain activity after an initial PCA dimensionality reduction step. Silhouette scores were calculated to evaluate the optimal clustering solution, and k means clustering solutions employing between 4 and 18 clusters were explored. The k = 8 was selected, as this solution had the highest mean silhouette score (average silhouette scores shown in Table S1) and the lowest number of individuals for which the solution failed to fit the data (n = 1). To confirm that these CAPs represent reliable states of resting brain activity rather than noise, the CAP analysis for k = 8 was run 100 more times on the REST1 data, and a PCA was run to verify congruence among the states. State data within k = 8 were then normalized (by subtracting the within‐state global average) and projected back into anatomic space for visualization (Figure 2, raw unnormalized representation of each state is shown in Figure 3, see the supplement Table S2 for the tabulated representation of this data). All CAP analyses were performed using the open‐source “capcalc” package (Frederick, B, capcalc [Computer Software] (2017) which was based on a prior version of the CAP pipeline reported in Kaiser et al. (2019) and similar to Chen et al. (2015). Retrieved from https://github.com/bbfrederick/capcalc).
Figure 1.
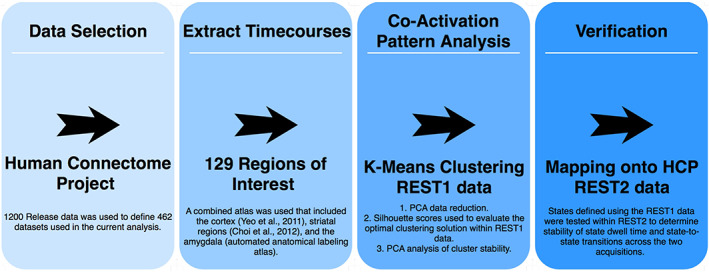
Methods [Color figure can be viewed at http://wileyonlinelibrary.com]
Figure 2.
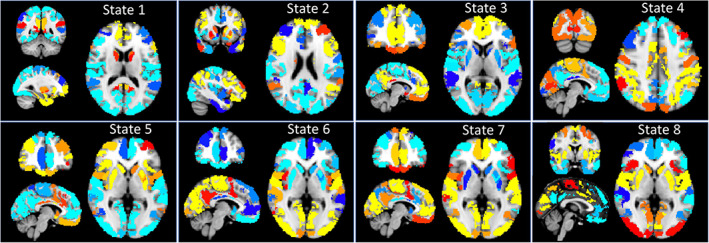
Normalized (by subtracting the within‐state global average) state representation projected back into anatomic space for visualization. Warm colors represent activation (relative to within‐state global average) while cool colors represent deactivation (relative to within‐state global average) within each state. Montreal Neurological Institute (MNI) Coordinates for each TNS are as follows: State 1 (x = −26, y = −48, z = 12), State 2 (−38, 8, 22), State 3 (−6, 44, 6), State 4 (−2, −86, 42), State 5 and 6 (−4, 46, 0), State 7 (−6, 44, 0), State 8 (0, 0, 0) [Color figure can be viewed at http://wileyonlinelibrary.com]
Figure 3.
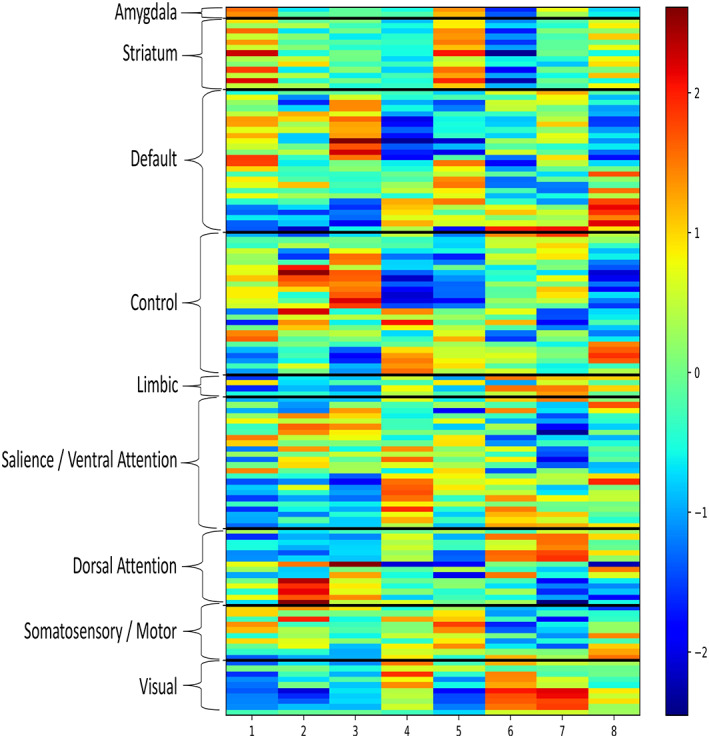
Raw unnormalized representation of each state grouped by prototypical resting state network divisions. The color bar represents the relative activation (warm colors, higher activation relative to raw average) and deactivation (cool colors, lower activation relative to raw average) for each region, within each transient network state. Specific values for each ROI are listed in the supplement. ROIs, regions of interest [Color figure can be viewed at http://wileyonlinelibrary.com]
After the analytic steps above to characterize recurring TNS, four types of dynamic measures were calculated for each state across the ~30 min REST1 period: total dwell time (defined as total time spent in each state over the timeseries), persistence (defined as the average dwell time spent in a state after entering that state, and before transitioning to a new state), frequency of transitioning into states, and frequency of each type of state‐to‐state transition (i.e., from State A to State B, State A to State C, etc.). Collectively, these steps yielded dynamic measures for each of the eight TNS.
2.5. Network state descriptive statistics and reliability
Analyses were performed to describe dynamic measures across the group. Using the REST1‐defined states, dwell time, persistence, transitions into states, and state‐to‐state transitions were calculated for REST1 and REST2 separately. Dynamic measures calculated for REST1 were compared between TNS using paired samples t tests to evaluate differences in total dwell time, persistence, and state‐to‐state transitions. Statistics were Bonferroni corrected to p < .001 and Cohen's d scores were calculated to aid in interpretation.
Next, two types of analysis were performed to evaluate the reliability of TNS. First, the network organization derived from REST1 was applied to REST2 to determine the generalizability of dynamic properties using the eight states defined in REST1. This was accomplished by using the states found in the REST1 analysis to partition the REST2 data. Dwell time, persistence, and state‐to‐state transition statistics were extracted from REST2. Then, these dynamic measures were compared between REST1 and REST2 to evaluate reliability (or changes in) dynamic measures within‐subject over consecutive scans, using repeated measures ANOVAs simultaneously considering each variable of interest and REST1 and REST 2. Second, independent clustering with k = 8 was also performed on REST2 data. The independently defined REST1 and REST2 states were then compared using two methods. Dice similarity coefficients (Dice, 1945) were calculated using MATLAB (MathWorks, Natick MA) to evaluate the extent to which pairs of 3D network images showed relative activation in the same spatial locations. Finally, correlations were performed to test the extent to which variance in activation across ROIs in once state corresponded with variance in activation across ROIs in another state.
3. RESULTS
3.1. Spatial organization of transient network states
The spatial organization of each transient network state is displayed in Figures 2 and 3. Below is a description of the patterns of relative activation and deactivation that characterized each transient network state. Dynamic measures for each transient network state (total dwell time in state, average persistence per state entry, transitions into a state, and state‐to‐state transitions) are shown in Table 1 and Figures 4, 5, 6, 7. A more detailed written description of state dynamics is provided in the supplement. Effect sizes comparing these metrics between each state are displayed in Table 2. In addition to the comprehensive report provided by these Tables and Figures, key findings from REST1 are also summarized below. A visual summarization of TNS interactions is provided in Figure 8. All absolute numbers given are averages for each run.
Table 1.
State characteristics observed during REST1
| Total dwell time in seconds | Frequency of transitions to | Persistence in seconds | |
|---|---|---|---|
| Mean (SD) | Mean (SD) | Mean (SD) | |
| State 1 | 347.59 (72.01) | 106.42 (14.59) | 3.29 (0.65) |
| State 2 | 96.38 (48.50) | 27.92 (12.06) | 3.39 (0.77) |
| State 3 | 154.05 (55.52) | 48.51 (14.50) | 3.14 (0.64) |
| State 4 | 245.54 (47.94) | 81.30 (12.95) | 3.04 (0.50) |
| State 5 | 102.69 (55.47) | 25.64 (12.03) | 3.93 (1.10) |
| State 6 | 223.51 (68.49) | 63.14 (14.34) | 3.58 (0.66) |
| State 7 | 365.68 (77.62) | 115.06 (16.63) | 3.22 (0.74) |
| State 8 | 163.76 (55.76) | 66.52 (18.24) | 2.48 (0.63) |
Figure 4.
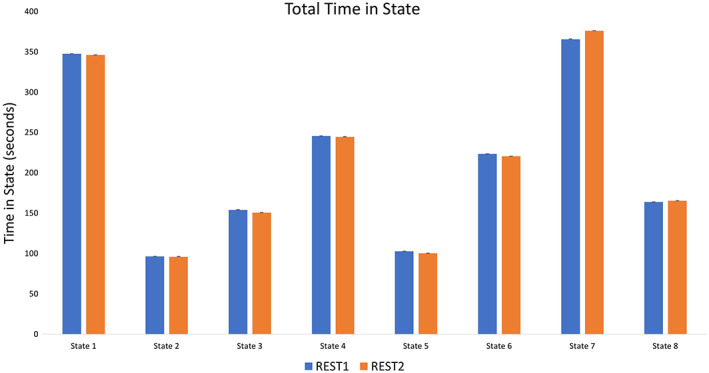
Total time in seconds spent in each state [Color figure can be viewed at http://wileyonlinelibrary.com]
Figure 5.
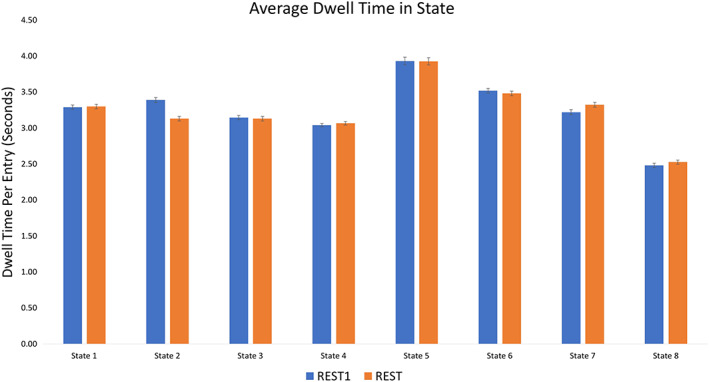
Average dwell time in seconds spent in each state per transition [Color figure can be viewed at http://wileyonlinelibrary.com]
Figure 6.
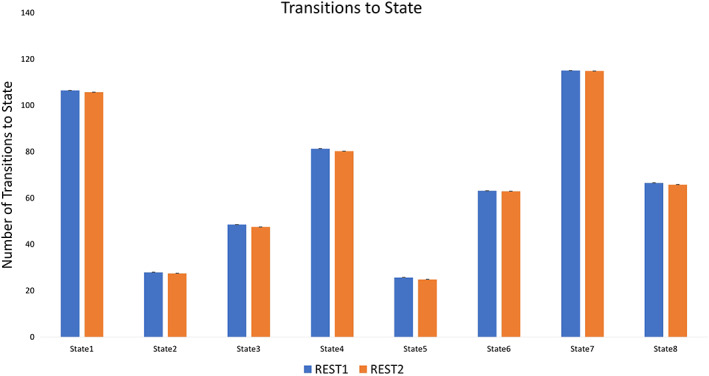
Total number of transitions into each state [Color figure can be viewed at http://wileyonlinelibrary.com]
Figure 7.
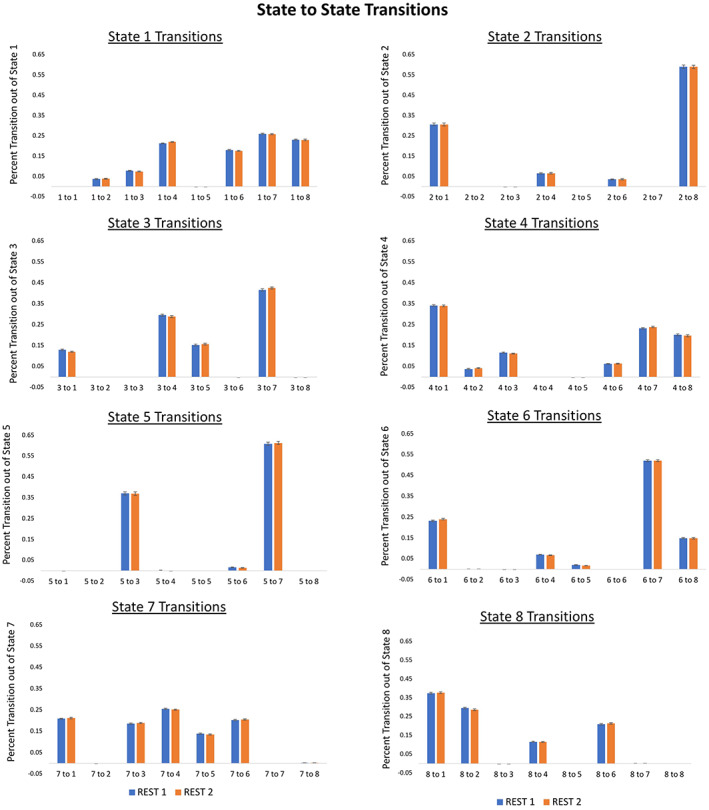
State‐to‐state transitions out of each state and into another state [Color figure can be viewed at http://wileyonlinelibrary.com]
Table 2.
Relative effect size of differences in REST1 state characteristics
| Total dwell time in seconds | Frequency of transitions to | Persistence in seconds | |
|---|---|---|---|
| Cohen's d | Cohen's d | Cohen's d | |
| State 1 compared with: | |||
| State 2 | 4.09 | 5.86 | −0.14 |
| State 3 | 3.01 | 3.98 | 0.23 |
| State 4 | 1.67 | 1.82 | 0.43 |
| State 5 | 3.81 | 6.04 | −0.71 |
| State 6 | 1.77 | 2.99 | −0.35 |
| State 7 | −0.24 | −0.55 | 0.10 |
| State 8 | 2.85 | 2.42 | 1.27 |
| State 2 compared with: | |||
| State 3 | −1.11 | −1.54 | 0.35 |
| State 4 | −3.09 | −4.27 | 0.54 |
| State 5 | −0.12 | 0.19 | −0.57 |
| State 6 | −2.14 | −2.66 | −0.18 |
| State 7 | −4.16 | −6.00 | 0.23 |
| State 8 | −1.29 | −2.50 | 1.30 |
| State 3 compared with: | |||
| State 4 | −1.76 | −2.39 | 0.18 |
| State 5 | 0.93 | 1.72 | −0.87 |
| State 6 | −1.11 | −1.01 | −0.58 |
| State 7 | −3.14 | −4.27 | −0.11 |
| State 8 | −0.17 | −1.09 | 1.05 |
| State 4 compared with: | |||
| State 5 | 2.76 | 4.45 | −1.04 |
| State 6 | 0.37 | 1.33 | −0.82 |
| State 7 | −1.86 | −2.26 | −0.28 |
| State 8 | 1.57 | 0.93 | 0.99 |
| State 5 compared with: | |||
| State 6 | −1.94 | −2.83 | 0.46 |
| State 7 | −3.90 | −6.16 | 0.76 |
| State 8 | −1.10 | −2.65 | 1.62 |
| State 6 compared with: | |||
| State 7 | −1.94 | −3.34 | 0.42 |
| State 8 | 0.96 | −0.21 | 1.62 |
| State 7 compared with: | |||
| State 8 | 2.99 | 2.78 | 1.08 |
Note: Cohen's d values represent the effect size of the differences between states. Effect sizes are shown to aid in interpretation as all p values were significant, despite small differences in values. Cohen's d values are discussed as meaningful if ≥2 and moderate if ≥0.8.
Figure 8.
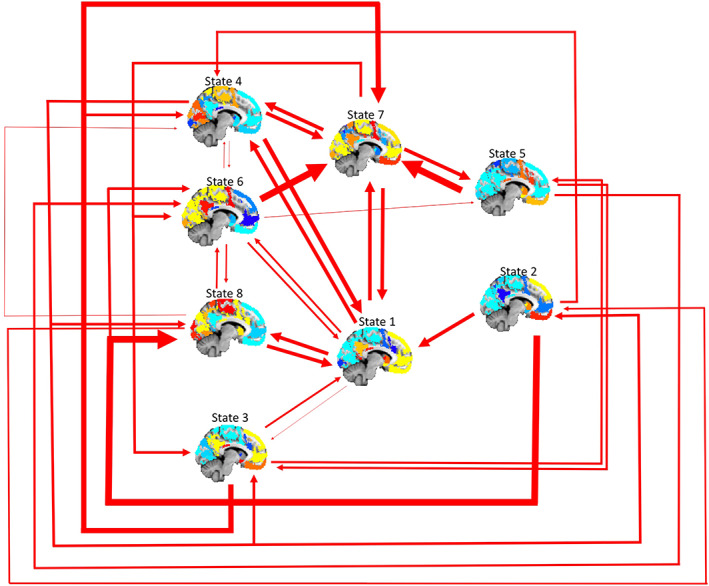
Visual summarization of transitions between transient network states. The middle column of brain states are the two most frequently transitioned‐into states, while the left most and right most columns represent moderate and infrequent transition states respectively. Thicker arrows represent more frequent transitions, while thinner arrows represent relatively few transitions. Specific values and statistics regarding state dynamics can be found in the supplement [Color figure can be viewed at http://wileyonlinelibrary.com]
3.1.1. State 1
Relative Activations: Regions of relative activation overlapped with the canonical default mode network (DMN), and also extended to the insula, striatum, and other areas of prefrontal cortex (PFC). These included primarily midline bilateral areas of the prefrontal cortex (PFC; BA 6, 8, 9, 10) extending into the orbitofrontal cortex (OFC), anterior cingulate cortex (ACC), frontal pole and inferior frontal gyrus (IFG). Coactivation in insular cortex was observed in anterior insula, and a region of posterior ventral insula. Coactivation in temporal areas included temporal pole, fusiform cortex, and middle/inferior temporal gyri. In the parietal lobe, coactivation was evident in posterior cingulate cortex, cuneus, and the angular gyri. Finally, State 1 was also characterized by relative activation of amygdala and striatal regions (nucleus accumbens [NAc], caudate, and putamen).
Relative Deactivations: Areas of relative deactivation included motor and somatosensory regions, areas of mid‐cingulate cortex, and dosolateral prefrontal cortex (DLPFC, BA 8, 9, and 46), superior and rostral portions of temporal lobe, and lateral areas of the parietal cortex.
Network Dynamics: Participants showed relatively high total dwell time in State 1 (approximately 6 min). The frequency of transitioning to State 1 was also relatively high (~106 times), and participants persisted on average ~3 s in State 1 before transitioning away. Participants exhibited a diverse range of transition patterns out of State 1 into other TNS (Figure 7).
3.1.2. State 2
Relative Activation: Regions of relative activation overlapped with the frontoparietal network (FPN) including lateral PFC regions (BA 6, 8, 9, 10, 46) and lateral parietal lobe. In addition, coactivation was evident in dorsomedial PFC (BA 8, 9, 10), left OFC, and left anterior insula. Coactivation in temporal regions included superior/middle temporal gyrus, and temporal pole. State 2 also showed relative striatal activation in areas of caudate and putamen.
Relative Deactivation: Midline regions that generally overlap with the prototypical DMN showed relative deactivation, including in areas of the medial PFC, mid/posterior aspects of the ACC, PCC, and precuneus. In addition, State 2 was characterized by relative deactivation in sensory cortices, and in ventral striatum (bilateral NAc).
Network Dynamics: Out of all TNS, participants showed the lowest total dwell time in State 2 (approximately 1.5 min), and rarely transitioned into this state (~28 times).
3.1.3. State 3
Relative Activation: Regions of relative activation overlapped with, and were largely restricted to, the prototypical DMN. These included dorsal and ventral mPFC extending to OFC and ACC, as well as the PCC and precuneus. Parietal and temporal regions of coactivation included the bilateral angular gyri, the parahippocampal gyrus, temporal pole, and superior/middle temporal gyri. Relative activation was also observed in some prefrontal regions that are beyond the boundaries of the prototypical DMN, including IFG, frontal pole, and dorsolateral portions of BA 8, 9; and in left NAc.
Relative Deactivation: Areas of relative deactivation included dorsal regions of the ACC, DLPFC (BA 9, 10, 46), the insula, dorsal striatum, amygdala, and sensory cortices.
Network Dynamics: Participants showed relatively low to moderate dwell time in State 3 (approximately 2.5 min) and moderate frequency of transitions into State 3 (~49 times).
3.1.4. State 4
Relative Activation: Relative activation was evident in areas of the prototypical dorsal attention network (DAN), including DLPFC, inferior parietal lobule, IFG, lateral frontal pole, supplementary motor cortex, pre/post central gyri, auditory cortex, and occipital cortex. In addition, coactivation was observed in insular regions including right anterior insula, and mid and posterior insula bilaterally.
Relative Deactivation: Relative deactivation was observed in medial frontal cortex and ventrolateral regions (BA 6, 8). Temporal regions showing relative deactivation included temporal pole and superior temporal gyrus; relative deactivation was also observed in distributed regions of striatum, and in the amygdala.
Network Dynamics: Total dwell time in State 4 was moderately high at approximately 4 min, and participants transitioned into this state with moderate frequency (~81 times).
3.1.5. State 5
Relative Activation: Regions of relative activation overlapped with the prototypical salience network, as well as limbic structures. These included coactivation of OFC, striatum, dorsal ACC, bilateral insula, bilateral amygdala, IFG, frontal pole, medial temporal pole, middle/inferior temporal gyrus, and frontal gyrus.
Relative Deactivation: Regions showing relative deactivation included midline areas of mPFC (dorsal to the OFC and anterior of the dACC), PCC, and precuneus. Deactivation was also observed in the occipital lobe, and in sensory and motor cortices.
Network Dynamics: Participants showed relatively low total dwell time in State 5 (approximately 1.7 min) and the lowest frequency of transitioning into this state (~26 times); however, persistence in this state was relatively higher than any other state (average persistence of nearly 4 s).
3.1.6. State 6
Relative Activation: This state was characterized by relative activation in the occipital cortex and sensory‐motor regions. Regions of coactivation included occipital cortex and distributed regions of parietal cortex, and somatosensory and motor regions of precentral and postcentral gyri. Frontal areas showing coactivation included posterior regions of the insula, and a region of lateral middle frontal gyrus.
Relative Deactivation: Areas of relative deactivation included frontal regions spanning OFC, ACC, frontal pole, and anterior insula. In addition, deactivation was observed in striatum, amygdala, and ventral and anterior portions of the temporal lobe.
Network Dynamics: Total dwell time in this state was moderate at approximately 3.7 min, with moderate frequency of transitioning into State 6 (~63 times).
3.1.7. State 7
Relative Activation: State 7 was characterized by relative activation in areas of occipital cortex, sensory, and motor regions. In addition, coactivation was evident in midline structures including the PCC, precuneus, ventral and dorsal mPFC, and OFC. Relative activation was also observed in right NAc.
Relative Deactivation: Relatively deactivated areas overlapped with regions of the prototypical FPN including areas of DLPFC and parietal cortex. In addition, deactivation was observed in striatal regions (with the exception of right NAc, above), and in left anterior insula.
Network Dynamics: Participants showed relatively high total dwell time in State 7 (approximately 6 min), and relatively high frequency of transitioning into this state (~115 times).
3.1.8. State 8
Relative Activation: State 8 was characterized by a pattern of relative activation that overlapped with the prototypical salience network, including the ACC and bilateral insula. In addition, coactivation was evident in regions of striatum, occipital lobe (visual cortex), frontal lobe (BA 9, left lateralized BA4), and areas of parietal lobe.
Relative Deactivation: Relative deactivation included medial and lateral aspects of PFC (mPFC dorsal to the dACC, BA 8) and frontal pole. Deactivation was also observed in parietal areas of PCC and precuneus; and in temporal areas including inferior temporal gyrus, temporal pole.
Network Dynamics: Total dwell time in State 8 was moderate at 2.7 min, as was the frequency of transitions to State 8 (~67 times).
3.2. Reliability of state organization and characteristics
As outlined above, two types of analysis tested the reliability of TNS. First, the transient network organization derived from REST1 was applied to REST2, and dynamic measures (total dwell time, average dwell time and state‐to‐state transition frequency) for each state were compared between REST1 and REST2 using RMANOVAs. Second, the spatial organization of TNS from an independent REST2 CAP analysis were compared to network states from the REST1 CAP analysis, using dice scores (to test spatial overlap in coactivation in independent 3D images) and correlations (to test covariance in level of activation at each ROI between independent 3D images). The results of these tests are outlined below.
3.3. Comparing dynamic measures from a single transient network clustering solution between sequential scans
The spatial organization of TNS derived from CAP analysis on REST1 data was applied to partition REST2 data, and dynamic measures were compared between sequential scans within subjects. This analysis showed that participants showed similar total dwell times, and similar average dwell time (i.e., persistence) in the majority of network states, compared between REST1 and REST2 (no significant differences at the p < .05 level). The exception to this evidence for stability in dynamic measures was State 7, which showed higher total dwell time in REST2 (F(1,461) = 6.661, p = .01), and higher average dwell time in State 7 in REST2 (F(1,461) = 7.433, p = .007). Specifically, participants spent an average of 10.34 more seconds in State 7 during REST2 than REST1, and persisted in State 7 for 0.103s longer in REST2 than REST1, although the effect sizes for these differences are small (Cohen's ds of 0.135, 0.138).
The average number of times that participants entered each transient network state was similar for REST1 and REST2 (all ps > .05). Considering patterns of transition between network states compared between REST1 and REST 2, participants showed similar transition patterns for State 2, State 4, and State 7 (ps > .05). However, differences were observed in the transition patterns for other states (although small effect sizes suggest caution is warranted in interpreting these differences). Compared with REST 1, during REST 2 participants showed more frequent transitions from State 1‐to‐State 4 during REST2 (F(1,461) = 5.675, p = .018, Cohen's d = 0.139), and from State 8‐to‐State 7, F(1,461) = 5.365, p = .021, Cohen's d = 0.0153 (however, base rate of this transition was low). In contrast, compared with REST1, during REST2 participants showed fewer transitions from State 3‐to‐State 1 (F(1,461) = 4.934, p = .027, Cohen's d = 0.128), from State 5‐to‐State 4, F(1,461) = 8.029, p = .005, Cohen's d = 0.186 (however, base rate of this transition was low), and from State 6‐to‐State 5, F(1,461) = 4.427, p = .036, Cohen's d = 0.12.
3.4. Comparing spatial organization of independent transient network clustering solutions between consecutive‐day scans
The TNS derived from independent CAP analyses performed on REST1 and REST2 were compared by calculating Dice Similarity Coefficients (DSC; values closer to 1 indicate higher spatial overlap in regions showing above‐within‐network‐average activation; Dice, 1945) for each pair of 3D network images (8 from REST1, and 8 from REST2; Figure 9). Results showed that the clustering solution independently derived from REST2 yielded several network states that showed relatively high and specific correspondence with states yielded by the clustering solution from REST1. In particular, States 1, 3, and 6 from REST1 were a high and relatively specific match with States 3, 2, and 1 from REST2 (DSC of 0.93, 0.84, and 0.96, respectively). Other states derived from REST1 either showed moderately high but less specific spatial match (States 2, 4, and 8), or relatively lower and nonspecific spatial match (States 5 and 7) with states derived from REST 2 (Figure 9).
Figure 9.
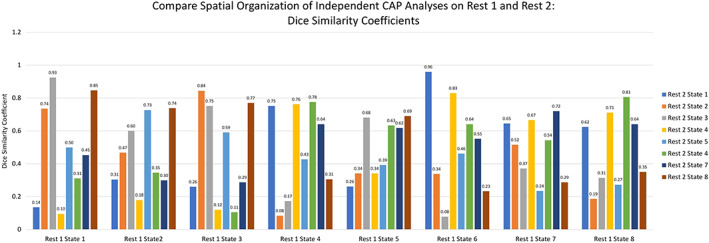
Dice Similarity Coefficients representing correspondence in states between REST1 and REST2. Values closer to 1 indicate higher spatial overlap in regions showing above‐within‐network‐average activation [Color figure can be viewed at http://wileyonlinelibrary.com]
Next, the TNS derived from independent CAP analyses with REST1 and REST2 were compared by calculating covariance in level of activation at each ROI between each pair of 3D images (Figure 10). Consistent with the results of DSC calculations, above, several states from REST1 showed relatively specific and high correlations in activation with states derived from REST2, including REST1 State 1 with REST2 State 3, r = .98; REST1 State 3 with REST2 State 2, r = .92; and REST1 State 6 with REST2 State 1, r = .98. Other states from REST1 (States 2, 4, and 8) showed high but less specific correlations in spatial activation with REST2 states, or (States 5, and 7) showed moderate and nonspecific correlations with REST2 states.
Figure 10.
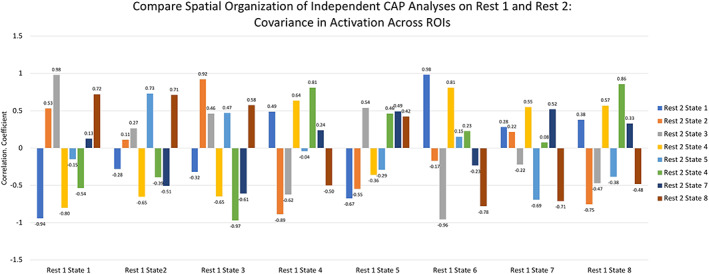
Covariance in the level of activation at each ROI between each pair of REST1 and REST2 3D images. ROIs, regions of interest [Color figure can be viewed at http://wileyonlinelibrary.com]
4. DISCUSSION
The organization and activity of transient networks may help us to understand new dynamic properties of large‐scale brain networks. In a large sample of healthy adults, the present study aims to evaluate spatial organization and dynamic activities (total dwell time, persistence, frequency of transitions into, and patterns of state‐to‐state transition) of transient networks, and to test the reliability of these properties over time. Key results include the finding that, first, although transient networks share some spatial characteristics with prototypical static resting‐state networks, they also diverge from static networks in important ways. Second, transient networks show unique profiles of dynamic activity, that is, specific networks show notably higher dwell time and transition frequency, especially those sharing spatial characteristics with the prototypical default mode network (DMN). Third, results generally support the reliability of transient resting‐state networks within subjects over time (sequential scans), but also highlight potential differences in reliability of different transient networks (see discussion of limitations below).
The spatial organization of transient networks (defined by single‐timepoint coactivation) have both similarities and differences with the spatial organization of prototypical static networks (defined by correlations in activation over extended periods of rest). For example, States 1, 3, and 7 all feature higher coactivation in midline and temporal regions that are often grouped within the DMN. Indeed, State 3 appeared to be a close match with the prototypical DMN, and did not extend beyond DMN boundaries. However (in addition to midline and temporal coactivation), State 1 also showed coactivation of regions of anterior insula, lateral PFC, and frontal pole extended to ventral PFC; and State 7 also showed coactivation in visual and sensorimotor regions (although note that State 7 was one of the lowest in spatial reliability over time). These findings are consistent with early evidence from other, independent samples (Kaiser et al., 2019) and have the interesting implication that, rather than a singular DMN (which can be decomposed into subnetworks [Andrews‐Hanna, Reidler, Sepulcre, Poulin, & Buckner, 2010], but has relatively sharp boundaries), there are several versions of the DMN that reliably extend to nonprototypical regions. But, the spatial variety of transient “complex” DMN states may have been historically obscured because coactivation of midline and inferior temporal regions is more temporally consistent than coactivation of nonprototypical regions, that is, DMN regions usually tend to show coordinated activation with one another at rest, but frontoinsular or sensorimotor regions sometimes coactivate with DMN regions, and also sometimes coactivate with other regions (here, anterior insula was coactive in both State 1 and State 8; lateral PFC was coactive in both State 1 and State 2). Therefore, the classic organization of the DMN is the version that is most commonly detected using standard analytic methods (in which correlated activity is estimated over 5+ min) or many dynamic approaches (e.g., sliding window analyses which average over 30 s or more of data) in which the rapid transitions between states are obscured over longer time scales. While speculative, it is plausible that the shared spatial overlap of DMN‐regions across these TNS means they share a similar overarching function, such as supporting self‐referential thought. However, coactivation of DMN‐regions with either frontoinsular (State 1) or sensorimotor (State 7) areas suggests these TNS may support different types of self‐referential thought that require the integration of either frontoinsular or sensorimotor regions. For example, such self‐referential processes may involve more affective/salience aspects (State 1), such as recalling an emotional event, or sensory processes, such as thinking about a morning run (State 7). Collectively, this suggests that TNS may share broad functional roles, while differing in specifics. This conjecture is based on the coactivation patterns alone, and future work applying the CAPS method to task‐related data is needed to better understand the specific function of each TNS.
In addition to the spatial organization of transient networks, the present study also explores the dynamic activity of those networks over time, focusing on four inter‐related measures. We investigated network dwell time, (the average proportion of the scan spent in a specific coactive network state); network persistence, (the average duration of time spent in a particular network [both used in prior studies using dynamic methods; Cabral et al., 2014; Calhoun, Miller, Pearlson, & Adali, 2014; Ma et al., 2014]); transitions into each network, (the frequency of moving into a specific network); and state‐to‐state transitions, (the frequency of moving from one network state to another [e.g., State A to State B]). Consistent with prior research in an independent sample (Kaiser et al., 2019), on average subjects showed the highest dwell time in networks that shared spatial characteristics with the prototypical DMN: together, dwell time in States 1, 3, and 7 accounted for more than half the total duration of both resting‐state scans. Of note, dwell time in either “complex” DMN state (States 1 or 7) was higher than dwell time in the prototypical DMN state (State 3), challenging the idea that the prototypical DMN is the primary or dominant resting‐state network. The most frequent transitions were transitions into complex DMN states (States 1 or 7), indicating that individuals not only spent the most time in these TNS but more readily transitioned into these states. Furthermore, these states showed the highest diversity of transitions that is, subjects could move into any other network state from States 1 or 7. In turn, there were some states that appeared to preferentially transition into either State 1 or State 7: for example, State 2 transitioned exclusively into State 1, whereas State 5 exclusively transitioned into State 7, suggesting these complex DMN states may preferentially interact with specific states.
Considering other TNS, another frequently recurrent network was State 4, which showed spatial overlap with the prototypical dorsal attention network (DAN); the frequency of transitioning into this network state was third only to complex DMN States 1 and 7. Given the putative role of overlapping DAN regions in top‐down attention selection (Vossel, Geng, & Fink, 2014) the high frequency of entry into this state suggests that individuals may be shifting their attention toward the external environment even when state occupancy across the entire scan is dominated by DMN‐like states. In contrast, the least frequent transitions were into network states exclusive to frontoparietal regions involved in goal‐directed, externally directed attention (e.g., State 2). There were, however, no differences in persistence across network states. Together, these results suggest a pattern of dynamic activity in which subjects move fluidly between transient networks, frequently returning to complex DMN states.
There are several potential interpretations of these dynamic patterns. One interpretation is that dwell time in, and transitions into, transient networks represent the cognitive activities or “modes” in which subjects tend to engage in the absence of task demands. From this perspective, subjects spend more time in, and frequently return to, TNS that encompass regions involved in internally oriented thinking (medial PFC, posterior cingulate cortex, inferior temporal cortex) because introspection is the main cognitive mode during a state of rest. The variety of transient DMN states may therefore reflect diverse forms of introspection, and the high frequency of transitions into complex DMN states may correspond with the process by which we direct the content of introspection according to goals, or how introspection is directed by the salience of emotions or bodily cues, or how we move from introspection to attention to the external world. A second interpretation is that dynamic network activities represent intrinsic features of those networks, for example, that some network states are inherently more flexible, therefore the brain must move through those TNS to reach less‐flexible network states, irrespective of cognitive activities. From this perspective, network states involving midline cortical regions may constitute “neutral gear,” through which the brain must shift to move into other “gears” of coactive network states. A third possibility is that elements of both interpretations have merit, for example, that dwell time and transitions into complex DMN states reflect both the dominance of introspection during resting‐state neuroimaging, and an inherent flexibility of both the network state and the cognitive mode: when engaging in introspection, the mind may flexibly wander to goals, physical sensations, or the environment, and then wander back. Future research may test these various interpretations by applying similar methods to other neuroimaging procedures that evaluate introspection (e.g., resting‐state neuroimaging with thought‐sampling) or manipulate cognitive mode (e.g., task‐based neuroimaging that is designed to enable comparing introspection with other cognitive activities), and by replicating these patterns in new samples.
Because large‐scale network dynamics is a rapidly growing area in neuroscience, and a wide range of methods have been introduced in recent years, another goal of this study was to evaluate the reliability of transient network properties over time using the CAP approach. To test spatial reliability, independent CAP analyses were applied to separate within‐subject datasets. Overall, there were better network state “matches” across scans than within a scan. Comparing between REST 1 and REST 2 the range of maximal scores was 0.7–0.98 while the maximal correlation values within REST 1 was 0.35–0.57. This shows that K means applied to REST 1 is separating out transient networks within the scan and that there is a relatively good match between REST 1 and REST 2 states. As shown in Figure 9, each REST 1 state has both high and low dice similarity coefficients when compared to each REST 2 state, indicating that REST 1 TNS are matching with their REST 2 counterpart with some specificity. However, as discussed above some spatial overlap between states is to be expected as some states may share functional aspects or a more fine‐grained anatomical evaluation is needed to differentiate spatially overlapping states.
These reliability tests specifically revealed similar organization of specific transient networks involving the prototypical DMN (State 3), DMN regions together with frontoinsular and subcortical systems (State 1), or sensorimotor regions (State 6). The spatial reliability of other transient networks was more mixed, for example, a transient network involving coactivation of frontoparietal and striatal regions (State 2) showed moderately high but nonspecific spatial overlap with two different network states derived from independent analysis in a subsequent scan. It may be that specific transient networks are inherently more reliable in their organization over time, or that transient networks that relate to common resting‐state cognitive activities (e.g., introspection; Andrews‐Hanna et al., 2010) are more likely to emerge reliably over time. Along these lines, the reliability of dynamic activities of transient networks was supported by analyses that indicated similar dwell time and transition frequency from REST 1 to REST 2. As above, stability over time in these measures could suggest that these are reliable properties that are intrinsic to network states (e.g., that brains tend to dwell in State 1) or that are related to cognitive activities (e.g., that brains tend to dwell in State 1 during task‐free rest, and similarity in cognitive mode from REST 1 to REST 2 is driving measure stability). There were some differences between REST 1 and REST 2, which should be interpreted with caution as the related effect sizes were small; ranging from 0.12 to 0.186. Thus, while the p‐value was significant, the small effect size calls the meaning of these differences into question. The fact that there was some level of variance between these two scanning sessions was not surprising as it is likely that outside factors influence TNS characteristics. Unfortunately, the current dataset did not allow for a systematic evaluation of potential factors that may have contributed to such minor differences between scanning sessions. Future research aimed at evaluating and replicating the reliability of transient networks, and determining how outside influences impact such networks may address these questions.
There are several limitations to the present study, which suggest directions for future research. First, this study evaluated the organization, dynamic activities, and reliability of transient resting‐state networks in a large sample of healthy adults, focusing on general patterns that characterize the group on average. Therefore, caution is warranted when predicting how these properties generalize to other samples. Also, individual differences in these properties (e.g., how transient network dynamics correspond with individual differences in cognitive ability or cognitive style) were not the focus of this study, but may hold important information about the significance of network dynamics to human health. For example, in a study which applied the CAP method to adolescents, network dwell and transition frequency were related to the trait tendency toward maladaptive introspection and depressive symptom severity (Kaiser et al., 2019). Together, the present study provides a perspective on transient network functioning in a large, healthy adult sample; future research will show whether these effects can be replicated under similar conditions in independent, healthy samples, extended to other samples, and reliably linked to meaningful cognitive and behavioral variables.
Second, we used CAP analysis to define transient functional brain networks, but other methods may provide a complementary perspective. Here, CAP analysis was selected because it is a data‐driven approach that is robust to sources of noise, requires few assumptions, and does not rely on estimates of correlated activation (Chen et al., 2015; Liu et al., 2013, 2018). However, CAP may, in the future, be implemented together with other methods of evaluating network dynamics. For example, in another Human Connectome Project study focused on resting‐state network dynamics, researchers reported a linear relationship between age and increasing variability in the BOLD signal of frontoinsular networks (Nomi, Bolt, Ezie, Uddin, & Heller, 2017). Those findings complement the present finding that the network state showing the highest transition frequency was characterized by coactivation in areas including anterior insula, and lateral and medial PFC. Together, a useful direction for future work will be to apply different methods for evaluating network dynamics to the same dataset, with the goal of evaluating the consistencies (or inconsistencies) of dynamic network properties that are uncovered by different approaches.
In conclusion, the present study investigated the functioning of transient large‐scale resting‐state brain networks in a sample of healthy adults. Key findings included the observation that the spatial organization of transient networks differed in critical ways from prototypical static resting‐state networks, and showed unique profiles of dynamic activity that suggest the dominance (at rest and in healthy adults) of transient networks involving midline cortical regions. These results also support the reliability of transient networks, as defined with the CAP analytic approach. Critical next steps will be replication in similar samples and using complementary methods, and research that investigates transient large‐scale brain networks across the spectrum of psychiatric health and in relation to other dimensions of cognitive and behavioral functioning.
CONFLICT OF INTEREST
The authors have no other conflict of interest.
Supporting information
Appendix S1: Supporting Information 1
Appendix S2: Supporting Information 2
ACKNOWLEDGMENTS
This work was supported by the National Institute on Drug Abuse K02 DA042987, R01 DA029135 (Janes), the National Institute of Neurological Disorders and Stroke R01 NS097512 (Frederick) the National Institute of Mental Health R56 MH11713 and the NARSAD Young Investigator Award 24879 (Kaiser). Data were provided and are made available by the Human Connectome Project 1200 release, WU‐Min Consortium (National Institutes of Health U54MH091657 Principal Investigators: David Van Essen and Kamil Ugurbil; https://www.humanconnectome.org/study/hcp-young-adult/document/1200-subjects-data-release).
Janes AC, Peechatka AL, Frederick BB, Kaiser RH. Dynamic functioning of transient resting‐state coactivation networks in the Human Connectome Project. Hum Brain Mapp. 2020;41:373–387. 10.1002/hbm.24808
Blaise B. Frederick and Roselinde H. Kaiser contributed equally to this study.
Funding information National Alliance for Research on Schizophrenia and Depression, Grant/Award Number: 24879; National Institutes of Health, Grant/Award Number: U54MH091657; National Institute of Mental Health, Grant/Award Numbers: 1U54MH091657, MH117131; National Institute of Neurological Disorders and Stroke, Grant/Award Number: NS097512; National Institute on Drug Abuse, Grant/Award Numbers: DA039135, DA042987
DATA AVAILABILITY STATEMENT
Data were provided and are made available by the Human Connectome Project 1,200 release, WU‐Min Consortium (National Institutes of Health U54MH091657 Principal Investigators: David Van Essen and Kamil Ugurbil; https://www.humanconnectome.org/study/hcp-young-adult/document/1200-subjects-data-release).
REFERENCES
- Allen, E. A. , Damaraju, E. , Plis, S. M. , Erhardt, E. B. , Eichele, T. , & Calhoun, V. D. (2014). Tracking whole‐brain connectivity dynamics in the resting state. Cerebral Cortex, 24(3), 663–676. 10.1093/cercor/bhs352 [DOI] [PMC free article] [PubMed] [Google Scholar]
- Andrews‐Hanna, J. R. , Reidler, J. S. , Sepulcre, J. , Poulin, R. , & Buckner, R. L. (2010). Functional‐anatomic fractionation of the brain's default network. Neuron, 65(4), 550–562. 10.1016/j.neuron.2010.02.005 [DOI] [PMC free article] [PubMed] [Google Scholar]
- Biswal, B. B. , Mennes, M. , Zuo, X. N. , Gohel, S. , Kelly, C. , Smith, S. M. , … Milham, M. P. (2010). Toward discovery science of human brain function. Proceedings of the National Academy of Sciences of the United States of America, 107(10), 4734–4739. 10.1073/pnas.0911855107 [DOI] [PMC free article] [PubMed] [Google Scholar]
- Bray, S. , Arnold, A. , Levy, R. M. , & Iaria, G. (2015). Spatial and temporal functional connectivity changes between resting and attentive states. Human Brain Mapping, 36(2), 549–565. 10.1002/hbm.22646 [DOI] [PMC free article] [PubMed] [Google Scholar]
- Buckner, R. L. , Andrews‐Hanna, J. R. , & Schacter, D. L. (2008). The brain's default network ‐ anatomy, function, and relevance to disease. Year in Cognitive Neuroscience, 1124, 1–38. 10.1196/annals.1440.011 [DOI] [PubMed] [Google Scholar]
- Buckner, R. L. , & Krienen, F. M. (2013). The evolution of distributed association networks in the human brain. Trends in Cognitive Sciences, 7(12), 648–665. 10.1016/j.tics.2013.09.017 [DOI] [PubMed] [Google Scholar]
- Cabral, J. , Hugues, E. , Sporns, O. , & Deco, G. (2011). Role of local network oscillations in resting‐state functional connectivity. NeuroImage, 57(1), 130–139. 10.1016/j.neuroimage.2011.04.010 [DOI] [PubMed] [Google Scholar]
- Cabral, J. , Kringelbach, M. L. , & Deco, G. (2014). Exploring the network dynamics underlying brain activity during rest. Progress in Neurobiology, 114, 102–131. 10.1016/j.pneurobio.2013.12.005 [DOI] [PubMed] [Google Scholar]
- Calhoun, V. D. , Miller, R. , Pearlson, G. , & Adali, T. (2014). The chronnectome: Time‐varying connectivity networks as the next frontier in fMRI data discovery. Neuron, 84(2), 262–274. 10.1016/j.neuron.2014.10.015 [DOI] [PMC free article] [PubMed] [Google Scholar]
- Chang, C. , Liu, Z. M. , Chen, M. C. , Liu, X. , & Duyn, J. H. (2013). EEG correlates of time‐varying BOLD functional connectivity. NeuroImage, 72, 227–236. 10.1016/j.neuroimage.2013.01.049 [DOI] [PMC free article] [PubMed] [Google Scholar]
- Chen, J. E. , Chang, C. , Greicius, M. D. , & Glover, G. H. (2015). Introducing co‐activation pattern metrics to quantify spontaneous brain network dynamics. NeuroImage, 111, 476–488. 10.1016/j.neuroimage.2015.01.057 [DOI] [PMC free article] [PubMed] [Google Scholar]
- Choi, E. Y. , Yeo, B. T. T. , & Buckner, R. L. (2012). The organization of the human striatum estimated by intrinsic functional connectivity. Journal of Neurophysiology, 108(8), 2242–2263. 10.1152/jn.00270.2012 [DOI] [PMC free article] [PubMed] [Google Scholar]
- Cohen, J. R. (2018). The behavioral and cognitive relevance of time‐varying, dynamic changes in functional connectivity. NeuroImage, 180(Pt B), 515–525. 10.1016/j.neuroimage.2017.09.036 [DOI] [PMC free article] [PubMed] [Google Scholar]
- Damaraju, E. , Allen, E. A. , Belger, A. , Ford, J. M. , McEwen, S. , Mathalon, D. H. , … Calhoun, V. D. (2014). Dynamic functional connectivity analysis reveals transient states of dysconnectivity in schizophrenia. Neuroimage: Clinical, 5, 298–308. 10.1016/j.nicl.2014.07.003 [DOI] [PMC free article] [PubMed] [Google Scholar]
- Deco, G. , & Kringelbach, M. L. (2016). Metastability and coherence: Extending the communication through coherence hypothesis using a whole‐brain computational perspective. Trends in Neurosciences, 39(3), 125–135. 10.1016/j.tins.2016.01.001 [DOI] [PubMed] [Google Scholar]
- Dice, L. R. (1945). Measures of the amount of ecologic association between species. Ecology, 26(3), 297–302. 10.2307/1932409 [DOI] [Google Scholar]
- Faghiri, A. , Stephen, J. M. , Wang, Y. P. , Wilson, T. W. , & Calhoun, V. D. (2018). Changing brain connectivity dynamics: From early childhood to adulthood. Human Brain Mapping, 39(3), 1108–1117. 10.1002/hbm.23896 [DOI] [PMC free article] [PubMed] [Google Scholar]
- Glasser, M. F. , Smith, S. M. , Marcus, D. S. , Andersson, J. L. , Auerbach, E. J. , Behrens, T. E. , … Van Essen, D. C. (2016). The human connectome project's neuroimaging approach. Nature Neuroscience, 19(9), 1175–1187. 10.1038/nn.4361 [DOI] [PMC free article] [PubMed] [Google Scholar]
- Glasser, M. F. , Sotiropoulos, S. N. , Wilson, J. A. , Coalson, T. S. , Fischl, B. , Andersson, J. L. , … Jenkinson, M. (2013). The minimal preprocessing pipelines for the Human Connectome Project. NeuroImage, 80, 105–124. 10.1016/j.neuroimage.2013.04.127 [DOI] [PMC free article] [PubMed] [Google Scholar]
- Greicius, M. D. , Supekar, K. , Menon, V. , & Dougherty, R. F. (2009). Resting‐state functional connectivity reflects structural connectivity in the default mode network. Cerebral Cortex, 19(1), 72–78. 10.1093/cercor/bhn059 [DOI] [PMC free article] [PubMed] [Google Scholar]
- Griffanti, L. , Salimi‐Khorshidi, G. , Beckmann, C. F. , Auerbach, E. J. , Douaud, G. , Sexton, C. E. , … Smith, S. M. (2014). ICA‐based artefact removal and accelerated fMRI acquisition for improved resting state network imaging. NeuroImage, 95, 232–247. 10.1016/j.neuroimage.2014.03.034 [DOI] [PMC free article] [PubMed] [Google Scholar]
- Hindriks, R. , Adhikari, M. H. , Murayama, Y. , Ganzetti, M. , Mantini, D. , Logothetis, N. K. , & Deco, G. (2016). Can sliding‐window correlations reveal dynamic functional connectivity in resting‐state fMRI? NeuroImage, 127, 242–256. 10.1016/j.neuroimage.2015.11.055 [DOI] [PMC free article] [PubMed] [Google Scholar]
- Hutchison, R. M. , & Morton, J. B. (2015). Tracking the brain's functional coupling dynamics over development. Journal of Neuroscience, 35(17), 6849–6859. 10.1523/JNEUROSCI.4638-14.2015 [DOI] [PMC free article] [PubMed] [Google Scholar]
- Hutchison, R. M. , Womelsdorf, T. , Allen, E. A. , Bandettini, P. A. , Calhoun, V. D. , Corbetta, M. , … Chang, C. (2013). Dynamic functional connectivity: Promise, issues, and interpretations. NeuroImage, 80, 360–378. 10.1016/j.neuroimage.2013.05.079 [DOI] [PMC free article] [PubMed] [Google Scholar]
- Kaiser, R. , Kang, M. , Lew, Y. , Van Der Feen, J. , Aguirre, B. , Clegg, R. , … Pizzagalli, D. A. (2019). Abnormal frontoinsular‐default network dynamics in adolescent depression and rumination: A resting‐state co‐activation pattern analysis. Neuropsychopharmacology, 44(9), 1604–1612. 10.1038/s41386-019-0399-3 [DOI] [PMC free article] [PubMed] [Google Scholar]
- Kaiser, R. H. , Clegg, R. , Goer, F. , Pechtel, P. , Beltzer, M. , Vitaliano, G. , … Pizzagalli, D. A. (2018). Childhood stress, grown‐up brain networks: Corticolimbic correlates of threat‐related early life stress and adult stress response. Psychological Medicine, 48(7), 1157–1166. 10.1017/S0033291717002628 [DOI] [PMC free article] [PubMed] [Google Scholar]
- Kaiser, R. H. , Snyder, H. R. , Goer, R. , Clegg, R. , Ironside, M. , & Pizzagalli, D. A. (2018). Attention bias in rumination and depression: Cognitive mechanisms and brain networks. Clinical Psychological Science, 6(6), 765–782. 10.1177/2167702618797935 [DOI] [PMC free article] [PubMed] [Google Scholar]
- Kaiser, R. H. , Whitfield‐Gabrieli, S. , Dillon, D. G. , Goer, F. , Beltzer, M. , Minkel, J. , … Pizzagalli, D. A. (2016). Dynamic resting‐state functional connectivity in major depression. Neuropsychopharmacology, 41(7), 1822–1830. 10.1038/npp.2015.352 [DOI] [PMC free article] [PubMed] [Google Scholar]
- Laumann, T. O. , Snyder, A. Z. , Mitra, A. , Gordon, E. M. , Gratton, C. , Adeyemo, B. , … Petersen, S. E. (2016). On the stability of BOLD fMRI correlations. Cerebral Cortex, 27(10), 4719–4732. 10.1093/cercor/bhw265 [DOI] [PMC free article] [PubMed] [Google Scholar]
- Liu, X. , Chang, C. , & Duyn, J. H. (2013). Decomposition of spontaneous brain activity into distinct fMRI co‐activation patterns. Frontiers in Systems Neuroscience, 7, 101 10.3389/fnsys.2013.00101 [DOI] [PMC free article] [PubMed] [Google Scholar]
- Liu, X. , Zhang, N. Y. , Chang, C. T. , & Duyn, J. H. (2018). Co‐activation patterns in resting‐state fMRI signals. NeuroImage, 180, 485–494. 10.1016/j.neuroimage.2018.01.041 [DOI] [PMC free article] [PubMed] [Google Scholar]
- Ma, S. , Calhoun, V. D. , Phlypo, R. , & Adali, T. (2014). Dynamic changes of spatial functional network connectivity in individuals and schizophrenia patients using independent vector analysis. NeuroImage, 90, 196–206. 10.1016/j.neuroimage.2013.12.063 [DOI] [PMC free article] [PubMed] [Google Scholar]
- Marusak, H. A. , Calhoun, V. D. , Brown, S. , Crespo, L. M. , Sala‐Hamrick, K. , Gotlib, I. H. , & Thomason, M. E. (2017). Dynamic functional connectivity of neurocognitive networks in children. Human Brain Mapping, 38(1), 97–108. 10.1002/hbm.23346 [DOI] [PMC free article] [PubMed] [Google Scholar]
- Medaglia, J. D. , Satterthwaite, T. D. , Kelkar, A. , Ciric, R. , Moore, T. M. , Ruparel, K. , … Bassett, D. S. (2018). Brain state expression and transitions are related to complex executive cognition in normative neurodevelopment. NeuroImage, 166, 293–306. 10.1016/j.neuroimage.2017.10.048 [DOI] [PMC free article] [PubMed] [Google Scholar]
- Nomi, J. S. , Bolt, T. S. , Ezie, C. C. , Uddin, L. Q. , & Heller, A. S. (2017). Moment‐to‐moment BOLD signal variability reflects regional changes in neural flexibility across the lifespan. The Journal of Neuroscience, 37(22), 5539–5548. 10.1523/JNEUROSCI.3408-16.2017 [DOI] [PMC free article] [PubMed] [Google Scholar]
- Pelletier‐Baldelli, A. , Andrews‐Hanna, J. R. , & Mittal, V. A. (2018). Resting state connectivity dynamics in individuals at risk for psychosis. Journal of Abnormal Psychology, 127(3), 314–325. 10.1037/abn0000330 [DOI] [PMC free article] [PubMed] [Google Scholar]
- Preti, M. G. , Bolton, T. A. W. , & Van De Ville, D. (2017). The dynamic functional connectome: State‐of‐the‐art and perspectives. NeuroImage, 160, 41–54. 10.1016/j.neuroimage.2016.12.061 [DOI] [PubMed] [Google Scholar]
- Rashid, B. , Arbabshirani, M. R. , Damaraju, E. , Cetin, M. S. , Miller, R. , Pearlson, G. D. , & Calhoun, V. D. (2016). Classification of schizophrenia and bipolar patients using static and dynamic resting‐state fMRI brain connectivity. NeuroImage, 134, 645–657. 10.1016/j.neuroimage.2016.04.051 [DOI] [PMC free article] [PubMed] [Google Scholar]
- Rashid, B. , Damaraju, E. , Pearlson, G. D. , & Calhoun, V. D. (2014). Dynamic connectivity states estimated from resting fMRI identify differences among Schizophrenia, bipolar disorder, and healthy control subjects. Frontiers in Human Neuroscience, 8, 897 10.3389/fnhum.2014.00897 [DOI] [PMC free article] [PubMed] [Google Scholar]
- Salimi‐Khorshidi, G. , Douaud, G. , Beckmann, C. F. , Glasser, M. F. , Griffanti, L. , & Smith, S. M. (2014). Automatic denoising of functional MM data: Combining independent component analysis and hierarchical fusion of classifiers. NeuroImage, 90, 449–468. 10.1016/j.neuroimage.2013.11.046 [DOI] [PMC free article] [PubMed] [Google Scholar]
- Smith, S. M. , Fox, P. T. , Miller, K. L. , Glahn, G. C. , Fox, P. M. , Mackay, C. E. , … Beckmann, C. F. (2009). Correspondence of the brain's functional architecture during activation and rest. Proceedings of the National Academy of Sciences of the United States of America, 106(31), 13040–13045. 10.1073/pnas.0905267106 [DOI] [PMC free article] [PubMed] [Google Scholar]
- Tian, L. X. , Li, Q. Z. , Wang, C. , & Yu, J. (2018). Changes in dynamic functional connections with aging. NeuroImage, 172, 31–39. 10.1016/j.neuroimage.2018.01.040 [DOI] [PubMed] [Google Scholar]
- Ugurbil, K. , Xu, J. Q. , Auerbach, E. J. , Moeller, S. , Vu, A. T. , Duarte‐Carvajalino, J. M. , … Yacoub, E. (2013). Pushing spatial and temporal resolution for functional and diffusion MRI in the Human Connectome Project. NeuroImage, 80(80–104), 80–104. 10.1016/j.neuroimage.2013.05.012 [DOI] [PMC free article] [PubMed] [Google Scholar]
- Van Essen, D. C. , Smith, S. M. , Barch, D. M. , Behrens, T. E. , Yacoub, E. , & Ugurbil, K. (2013). The WU‐Minn Human Connectome Project: An overview. NeuroImage, 80, 62–79. 10.1016/j.neuroimage.2013.05.041 [DOI] [PMC free article] [PubMed] [Google Scholar]
- Vossel, S. , Geng, J. J. , & Fink, G. R. (2014). Dorsal and ventral attention systems: Distinct neural circuits but collaborative roles. The Neuroscientist, 20(2), 150–159. 10.1177/1073858413494269 [DOI] [PMC free article] [PubMed] [Google Scholar]
- Yeo, B. T. T. , Krienen, F. M. , Sepulcre, J. , Sabuncu, M. R. , Lashkari, D. , Hollinshead, M. , … Buckner, R. L. (2011). The organization of the human cerebral cortex estimated by intrinsic functional connectivity. Journal of Neurophysiology, 106(3), 1125–1165. 10.1152/jn.00338.2011 [DOI] [PMC free article] [PubMed] [Google Scholar]
Associated Data
This section collects any data citations, data availability statements, or supplementary materials included in this article.
Supplementary Materials
Appendix S1: Supporting Information 1
Appendix S2: Supporting Information 2
Data Availability Statement
Data were provided and are made available by the Human Connectome Project 1,200 release, WU‐Min Consortium (National Institutes of Health U54MH091657 Principal Investigators: David Van Essen and Kamil Ugurbil; https://www.humanconnectome.org/study/hcp-young-adult/document/1200-subjects-data-release).


