

Abstract
Resting‐state functional magnetic resonance imaging (rsfMRI) is a promising task‐free functional imaging approach, which may complement or replace task‐based fMRI (tfMRI) in patients who have difficulties performing required tasks. However, rsfMRI is highly sensitive to head movement and physiological noise, and validation relative to tfMRI and intraoperative electrocortical mapping is still necessary. In this study, we investigate (a) the feasibility of real‐time rsfMRI for presurgical mapping of eloquent networks with monitoring of data quality in patients with brain tumors and (b) rsfMRI localization of eloquent cortex compared with tfMRI and intraoperative electrocortical stimulation (ECS) in retrospective analysis. Five brain tumor patients were studied with rsfMRI and tfMRI on a clinical 3T scanner using MultiBand(8)‐echo planar imaging (EPI) with repetition time: 400 ms. Moving‐averaged sliding‐window correlation analysis with regression of motion parameters and signals from white matter and cerebrospinal fluid was used to map sensorimotor and language resting‐state networks. Data quality monitoring enabled rapid optimization of scan protocols, early identification of task noncompliance, and head movement‐related false‐positive connectivity to determine scan continuation or repetition. Sensorimotor and language resting‐state networks were identifiable within 1 min of scan time. The Euclidean distance between ECS and rsfMRI connectivity and task‐activation in motor cortex, Broca's, and Wernicke's areas was 5–10 mm, with the exception of discordant rsfMRI and ECS localization of Wernicke's area in one patient due to possible cortical reorganization and/or altered neurovascular coupling. This study demonstrates the potential of real‐time high‐speed rsfMRI for presurgical mapping of eloquent cortex with real‐time data quality control, and clinically acceptable concordance of rsfMRI with tfMRI and ECS localization.
Keywords: electrocortical mapping, functional MRI, high‐speed fMRI, presurgical mapping, real‐time fMRI, resting‐state fMRI, task‐based fMRI
1. INTRODUCTION
Recent advances in functional magnetic resonance imaging (fMRI) have the potential to enhance the clinical utility of presurgical mapping to aid surgical resection of brain neoplasms, balancing long‐term survival by maximizing the extent of resection while preserving the patient's functional status. Preoperative task‐based functional MRI (tfMRI) is often included in the battery of imaging studies for decision‐making and operative panning for such lesions (Lee, Pouratian, Bookheimer, & Martin, 2010; Bizzi et al., 2008; Pillai & Zaca, 2011; Giussani et al., 2010). However, tfMRI suffers significant limitations: (a) patients may have difficulties performing the required tasks, especially those who have developmental brain disorders and brain lesions close to eloquent areas, (b) task‐based mapping of eloquent cortex allows to map a limited number of functional areas due to clinical time constraints, making it difficult to map an entire brain network and limiting parcellation of eloquent cortex. Particularly challenging is the language system due to large number of regions involved (e.g., Benjamin et al., 2017).
Resting‐state fMRI (rsfMRI), a task‐free approach, has emerged as a powerful adjunct to tfMRI, which is currently being evaluated for presurgical mapping of eloquent cortex (Stufflebeam et al., 2011; Mannfolk et al., 2011; Zhang et al., 2009; Mitchell et al., 2013), in particular in patients with functional impairment or limited task compliance (H. Liu et al., 2009). A recent study using a supervised machine learning approach for rsfMRI reported a significantly higher failure rate of tfMRI compared with rsfMRI (Leuthardt et al., 2018). Several studies in patients with neurological diseases reported high overlap between rsfMRI and tfMRI when comparing the motor network (Zhang et al., 2009; Shimony et al., 2009), high concordance with cortical stimulation mapping (Zhang et al., 2009), and reproducibility of rsfMRI‐derived motor maps comparable to that of tfMRI in healthy subjects (Mannfolk et al., 2011; Smith et al., 2009). However, mapping of the language system using rsfMRI is more variable, even in healthy subjects (Tie et al., 2013; Kollndorfer, Fischmeister, Kasprian, Prayer, & Schopf, 2013). A recent study in patients with brain tumors demonstrated only moderate group level rsfMRI versus tfMRI language network concordance with substantial subject‐level variability (Sair et al., 2016). Infiltration and abnormal neurovascular coupling, generally greater with higher tumor grade but also present in low‐grade gliomas (Pak et al., 2017), may compromise blood oxygenation level dependent (BOLD) contrast, both in rsfMRI and tfMRI (Hou et al., 2006; Jiang et al., 2010; Holodny et al., 2000; Agarwal et al., 2016).
Increasingly available high‐speed data acquisition methods (Zahneisen et al., 2011; Lin et al., 2010; Setsompop et al., 2012) have reduced sensitivity to physiological signal fluctuation and increased sensitivity for mapping RSNs (Smith et al., 2012a; Feinberg et al., 2010; Posse et al., 2012). However, high sensitivity to head movement, which obscures networks as well as create false‐positive correlations (Van Dijk, Sabuncu, & Buckner, 2012; Satterthwaite et al., 2012) despite state‐of‐the‐art motion “correction” in postprocessing, and the low frequency range of signal fluctuations and spatial–temporal nonstationarity, which is prominent in the resting‐state (C. Chang & Glover, 2010; Kiviniemi et al., 2011; Allen et al., 2014; X. Liu & Duyn, 2013), can affect the sensitivity and specificity of mapping RSNs (Feinberg et al., 2010; C. Chang & Glover, 2010; Allen et al., 2014; X. Liu & Duyn, 2013; Smith et al., 2012a; Posse et al., 2013). Physiologically related temporal B0 fluctuations, mostly due to respiration and cardiac movements, but also swallowing and speaking, can result in a temporal disturbance of steady‐state‐free precession (Zhao, Bodurka, Jesmanowicz, & Li, 2000). Multiband (MB) EPI sequences with short repetition time (TR) are sensitive to these disturbances, in particular in cerebrospinal fluid (CSF) voxels where TR < T2 and in case the sequence had not been properly spoiled. At short TR, temporal autocorrelation reduces the effective degrees of freedom and several studies have described higher order autoregressive (AR) models to correct statistical inference testing (Sahib et al., 2016; Bollmann, Puckett, Cunnington, & Barth, 2018; Afyouni, Smith, & Nichols, 2019; Marchini & Smith, 2003; Woolrich, Ripley, Brady, & Smith, 2001). For clinical and neuroscience applications, there is thus an urgent need for analysis tools that are robust with respect to confounding signals and that enable monitoring of data quality and detection sensitivity in real‐time to aid scan success. A recent study by Dosenbach et al. (2017) described a real‐time motion analytics tool that allows censoring of data frames affected by head movement and provides statistics to determine the scan time necessary to collect a desired amount of low movement data (Dosenbach et al., 2017).
In the present study, we investigate (a) the feasibility of real‐time rsfMRI for presurgical mapping of eloquent networks with monitoring of data quality in patients with brain tumors and (b) rsfMRI localization of eloquent cortex compared with tfMRI and intraoperative electrocortical stimulation (ECS) in a retrospective analysis. The first objective was validated by real‐time assessment of motion parameters and artifacts described by Dosenbach et al. (2017) and by additionally monitoring quantifiable metrics of resting‐state connectivity and task‐activation to determine overall scan success. In addition, the tool monitors physiological signal pulsation and signal drifts in anatomically defined brain regions. The second objective was validated by measuring the Euclidian distances between (a) the peaks of resting‐state connectivity and task‐activation relative to the ECS coordinates and (b) the nearest edges of resting‐state connectivity and task‐activation clusters (at threshold p < .001) relative to the ECS coordinates. To accomplish these objectives, we developed a seed‐based sliding‐window moving average correlation analysis (Posse et al., 2013) with regression of confounding signals from head movement and physiological noise (Vakamudi, Damaraju, & Posse, 2016; Vakamudi, Trapp, Scantlen, & Posse, 2017) that enables real‐time analytics of resting‐state connectivity. This methodology is compatible with high‐speed multiband EPI with a 400 ms TR.
2. MATERIALS AND METHODS
2.1. Patients
Five patients with primary brain tumors participated in this study. All patients were right‐handed with left‐lateralized language function based on clinical presurgical tfMRI and underwent complete neuropsychological evaluation and awake mapping (for details and time lines see Supporting Information S1). Institutionally reviewed, informed written consent was obtained.
Patient 1—glioblastoma, WHO Grade IV: 55‐year‐old male with new onset seizures and biopsy proven left anterior, frontal high‐grade isocitrate dehydrogenase wild‐type glioma with methyl‐guanyl‐methyl‐transferase (MGMT) promoter hypermethylation.
Patient 2—ganglioglioma, WHO Grade I: 32‐year‐old female with a long‐standing history of medically intractable epilepsy with predominant speech component. She had a contrast‐enhancing lesion in the posterior superior temporal gyrus.
Patient 3—anaplastic astrocytoma, WHO Grade III: 55‐year‐old female with first onset nocturnal seizure was found to have a complex, large tumor involving left frontal operculum extending into corona radiata, insula, temporal operculum, and mesial temporal lobe including amygdala and hippocampus with IDH1 R132H mutation and MGMT promoter hypermethylation.
Patient 4—oligodendroglioma, WHO Grade II: 57‐year‐old male with first onset seizures with a predominant speech component, was found to have a noncontrast enhancing mass in the left frontal lobe extending into frontal operculum inferiorly and sensorimotor area of hand and face posteriorly with 1p, 19q codeletion and IDH1 R132H mutation.
Patient 5—oligodendroglioma, WHO Grade II: 31‐year‐old male with a history of traumatic brain injury, imaging of which also revealed an expansile, noncontrast enhancing mass within the frontal lobe in premotor gyrus with 1p, 19q codeletion and IDH1 R132H mutation.
2.2. Data acquisition
2.2.1. RsfMRI and tfMRI
Data were collected on a 3T Siemens TIM Trio scanner (Siemens Healthcare, Erlangen, Germany) equipped with MAGNETOM Avanto gradient system and 32‐channel head array coil. The presurgical mapping protocol includes high‐resolution MRI, real‐time rsfMRI and tfMRI, diffusion tensor imaging (DTI), and MR spectroscopic imaging (MRSI). Total scan time was less than 1 hr, including possible repetitions of scans affected by movement or limitations in task compliance as determined by real‐time rsfMRI and tfMRI analysis (see Section 2.3.5). Heart rate was recorded using a pulse oximeter and Biopac system (BIOPAC Systems, Inc.). Respiratory movement was recorded using the Siemens respiratory belt. An eye tracker was used to monitor the wakefulness and task compliance.
RsfMRI and tfMRI data were collected using a multiband EPI pulse sequence (https://www.cmrr.umn.edu/multiband/). The acquisition parameters in Patients 1 and 2 were: TR/TE (Echo time)—400/35 ms, flip angle—42°, spatial matrix—64 × 64, number of slices: 32, interslice gap—0 mm, MB factor—8, voxel size—3 mm × 3 mm × 3 mm. A dual‐echo acquisition was used to minimize signal losses in inferior frontal cortex and temporal lobes (Posse et al., 1999) in Patients 3, 4, and 5: TR/TE1/TE2–400/14.4/41.0 ms, flip angle—42°, spatial matrix—64 × 64, number of slices: 32, interslice gap—0 mm, MB factor – 8, voxel size—3 mm × 3 mm × 3 mm. This choice of Ernst angle excitation corresponds to the optimal flip angle for gray matter for the spatial and temporal signal to noise ratio of the acquired data (Gonzalez‐Castillo, Roopchansingh, Bandettini, & Bodurka, 2011). Raw data were preprocessed online (readout Fourier transform, phase correction, etc.) using the scanner reconstruction computer and sent via a local network connection to an external server (Linux workstation) for multiband reconstruction as described in https://www.cmrr.umn.edu/multiband/remote-recon.shtml. Unaliased data were sent back to the scanner reconstruction computer for parallel imaging reconstruction and postprocessing (phase encode Fourier transform, filtering, etc.). Reconstructed raw images bypassed the scanner Digital Imaging and Communications in Medicine database to improve performance and were exported to the scanner host computer using an in‐house developed software module (Image Calculation Environment functor) that was integrated into the scanner image reconstruction pipeline. A server software located on the host computer forwarded the reconstructed images to an external workstation for real‐time fMRI analysis using the TurboFIRE real‐time fMRI analysis software package (Posse et al., 2001). The entire multislice image reconstruction and data transfer took less than a TR.
Resting‐state fMRI scans were acquired after patients were instructed to try not to think anything in particular during the scan, relax, and fixate on a crosshair presented on a computer screen with eyes open. The duration of the resting‐state scan in Patients 2, 3, and 4 was 10 min (Table 1). In Patient 1, two 10 min resting‐state scans were performed to assess reproducibility. In Patient 5, the duration of the resting‐state scan was 5.3 min.
Table 1.
Presurgical resting‐state and task‐based functional magnetic resonance imaging scans with acquisition parameters, seed locations, and task description
| Pulse sequence/parameters | Resting‐state fMRI | Task‐based fMRI | ||||||
|---|---|---|---|---|---|---|---|---|
| Patient | Age/sex | Tumor type | Scan duration (min) | Seed regions motor language | Scan duration per task (min) | Task 1 | Task 2 | |
| P1 | 55/M | Glioblastoma WHO Grade IV | Single echo MBEPI TR/TE: 400/33 ms, voxel: 3 mm3, α: 42°, matrix 64 × 64 × 32 | 10.05 two scan repetitions | BA1‐3L BA44,45L | 3.13 | Motor/visual right fist clenching + eyes open/close | Language word generation |
| P2 | 32/F | Ganglioglioma WHO Grade I | Single echo MBEPI TR/TE: 400/33 ms, voxel: 3 mm3, α: 42°, matrix 64 × 64 × 32 | 10.06 | BA22,39,40L BA44,45L | 3.13 | Auditory syllable discrimination | Language verb generation |
| P3 | 55/F | Anaplastic astrocytoma WHO Grade III | Dual echo MBEPI TR/TE1/TE2: 400/14/41 ms, voxel: 3 mm3, α: 42°, matrix: 64 × 64 × 32 | 10.13 | BA1‐3L BA44,45L | 3.13 | Motor/visual bilateral fist clenching + eyes open/close | Language verb generation |
| P4 | 58/M | Oligodendroglioma WHO Grade II | Dual echo MBEPI TR/TE1/TE2: 400/14/41 ms, voxel: 3 mm3, α: 42°, matrix: 64 × 64 × 32 | 10.13 | BA1‐3L BA44,45L | 3.13 | Motor/visual right index finger tapping + eyes open/close | Language word generation |
| P5 | 31/M | Oligodendroglioma WHO Grade II | Dual echo MBEPI TR/TE1/TE2: 400/14/41 ms, voxel: 3 mm3, α: 42°, matrix: 64 × 64 × 32 | 5.46 | BA1‐3L BA44,45L | 3.13 | Motor/visual right index finger tapping + eyes open/close | Language verb generation |
Two 3‐min tfMRI scans were performed in all patients (Table 1, Supporting Information S1). Tasks were selected based on lesion location and adapted to the patient's ability to execute. Block design motor‐visual task data were acquired in the lit scanner environment with alternating eyes open and closed and simultaneous right index finger tapping with maximum extension of the finger at an average 2 Hz frequency versus rest. In Patient 1, unilateral fist clenching was used and in Patient 3 bilateral fist clenching was used due to patient's difficulties performing finger tapping. Covert word or verb generation tasks were performed in response to presentation of single letter on the computer screen at a frequency of 0.3 Hz. In Patient 2, an auditory syllable discrimination task (Posse et al., 2001) was performed instead of the motor‐visual task. Task blocks consisted of 8 s of task execution interleaved by 12 s of rest using eight repetitions for a total duration of 3 min (450 scans). Patients were instructed to attend each task with a constant effort across the scans. Paradigm presentation was performed using ePrime software (Psychology Software Tools, Inc., Pittsburgh, PA). Pulse waveforms were recorded with 20 ms temporal resolution.
Clinical presurgical tfMRI and DTI data were acquired separately on a 3T Philips Achieva scanner equipped with 15 element multiplexed RF head coil located at Sandoval Regional Medical Center, Rio Rancho, NM. FMRI data were collected using conventional echo‐planar imaging (TR/TE: 2,000/30 ms, no. of slices: 40, voxel size: 3 mm × 3 mm × 3.5 mm, scan time per task: 5.2 min). Data were collected using multiple tasks with a common design of 20 alternating blocks of the active versus control conditions, that is, 10 cycles of active versus control contrasts. Tasks include bilateral fist clenching, bilateral foot clenching, lip movement, word generation, verb generation, and auditory listening.
2.2.2. Intraoperative electrocortical mapping
Clinical presurgical tfMRI and DTI‐based tractography maps were formatted using StealthViz software (Medtronic Navigation, CO), merged with standard anatomic sequences (FLAIR, T1‐precontrast and postcontrast) and imported onto neuronavigation system (Stealth Station S8, Medtronic Navigation, CO). Activation maps from clinical presurgical tfMRI were used to guide intraoperative stimulation. ECS was performed using a 60 Hz bipolar electrocortical stimulator (Nicolet Cortical Stimulator, Natus, WI) with biphasic pulses of 250 μs pulse width, and surgeon‐controlled train duration of 3 s. Stimulus intensity was generally kept between 2 and 12 mA, with motor threshold commonly lower than language threshold. Electrocorticography was performed using an 8‐contact strip electrode (Integra Lifesicences, NJ) for monitoring after discharges. Behavioral testing/monitoring was conducted by the same neuropsychologist who did preoperative testing. The coordinates of intraoperative ECS with a positive behavioral response were recorded in the Stealth workstation in reference to the FLAIR/T1‐precontrast in LAS reference frame as image points. Motor function was not mapped with ECS in Patients 2 and 3 and language function was not mapped with ECS in Patient 5. Further detail is available in Supporting Information S1.
2.3. Data analyses
An overview of the workflow of the current study consisting of real‐time fMRI, offline fMRI analyses, and intraoperative mapping is shown in Figure 1. Real‐time quality control using the processing pipeline described below in Sections 2.3.1–2.3.4 was performed during real‐time fMRI. A trained observer evaluated the quality control metrics described in Section 2.3.5 to determine the scan success that is, either to proceed with the scan, modify the scan protocol, or repeat the scan after making necessary modifications (e.g., instructing the patient to reduce head motion or to improve task compliance). Offline fMRI analyses with optimized processing parameters were performed and consistency with real‐time fMRI maps in terms of magnitude of true‐positive and false‐positive correlations was assessed. If the real‐time and offline fMRI maps were consistent, the real‐time maps were coregistered with clinical MRI to retrospectively measure the Euclidean distances between intraoperative mapping coordinates and the peaks and edges of the corresponding connectivity and activation clusters as described in Section 2.3.6. If the offline maps showed higher correlation coefficients in target areas and lower false‐positive correlation in nontarget areas compared with real‐time maps, offline maps were used to measure the Euclidean distances and real‐time processing parameters (e.g., seed selection) were optimized for the next real‐time fMRI scan.
Figure 1.

Workflow of data acquisition and data analysis for real‐time functional magnetic resonance imaging (fMRI), offline fMRI analyses, and intraoperative mapping. The observer monitored quality control results and determined whether a scan needed to be repeated (with optimized parameters). Real‐time resting‐state and task‐based fMRI maps were compared with the corresponding offline maps in terms of true‐ and false‐positive correlations. The maps with the higher true‐positive and lower false‐positive correlation were used to compute Euclidean distances
The entire preprocessing and postprocessing pipeline was implemented in the TurboFIRE real‐time fMRI analysis software package (Posse et al., 2013) on an Intel Xeon E5‐2697 v4 @ 2.30 GHz, 36 core workstation with 64 GB RAM. Dynamic multithreading was used to take advantage of the multiprocessor architecture of the workstation. The image reconstruction and transfer of each image took less than 1 TR. The latency between image transfer and generation of a fully regressed update of the resting‐state correlation map for two regions of interests (ROIs) was less than 1 TR in steady state. A comparable latency was measured for real‐time task‐based activation mapping using model‐based analysis. Offline processing of four resting‐state networks required an additional 2‐min processing delay for the 10 min scan. The correlation maps were displayed in radiological orientation using a correlation scale ranging from −1 (blue) to 0 (green) to +1 (red).
2.3.1. Preprocessing (real‐time and offline)
The preprocessing steps included: T2*‐weighted echo averaging (in case of dual‐echo data; Posse et al., 1999), six‐parameter rigid body motion correction (Mathiak & Posse, 2001), spatial smoothing of using an isotropic 5 mm Gaussian spatial filter kernel (with the exception of Patient 5 in which a 3 mm kernel was used), spatial normalization using manual selection of the midpoint of the AC/PC line and mapping of the Montreal Neurological Institute (MNI) atlas into subject space using a lookup table approach (Gao & Posse, 2003), and 8 s moving average time domain low pass filter with a 100% Hamming window width (Lin et al., 2012; Kruggel, Pelegrini‐Issac, & Benali, 2002) to reduce signal fluctuations due to cardiac and respiratory pulsations. The lookup table‐related coordinates in object space to MNI space using voxel to voxel mapping. Since several voxels in normalized space may be projected to the same voxel in object space, corresponding source locations in normalized space were spatially averaged. A 10% intensity threshold was applied to the raw images to remove spurious correlations outside of the brain. A maximum of four (for real‐time analyses) and six (for offline analyses) ROI were simultaneously processed in TurboFIRE to generate time courses for correlation analysis (Gao & Posse, 2004; see Section 2.3.3).
2.3.2. Atlas‐based and manual seed selection (real‐time and offline)
Brodmann areas (BAs) were selected as seed regions after transforming the coordinates from the MNI atlas into the Talairach atlas using Matthew Brett's formula (http://www.mrc-cbu.cam.ac.uk/Imaging/mnispace.html) and automatically assigned using the Talairach Daemon (TD) database (Lancaster et al., 1997; Lancaster et al., 2000). The sensorimotor network (SMN) encompassing primary sensory and motor areas was mapped using the atlas‐based left BAs 1–3 (BA1‐3L), except in Patient 2 where seed selection was exclusively within the language network (LAN). The language network was mapped using either left BAs 44 and 45 (BA44,45L) for Broca's area or left BAs 22, 39, and 40 (BA22,39,40L) for Wernicke's area or both (in Patient 2). White matter (WM) and CSF seeds for regression were manually delineated using the freehand ROI selection feature in TurboFIRE. For real‐time analysis, a 10 s prescan was spatially normalized to select atlas‐based seed regions and two major networks (sensorimotor, Broca's or Wernicke's areas depending on lesion location) were mapped simultaneously. Exner's area, which is thought to be involved in graphic representation of language, that is, writing (Roux et al., 2009), was also mapped. It is located close to the superior frontal sulcus just anterior to the hand motor area (BA 6). For offline analyses, all major resting‐state networks using ipsilateral and contralateral seeds to the tumor, artifactual connectivity using WM seeds, and functional connectivity within and adjacent to the tumor using manual seeds were mapped.
2.3.3. Resting‐state seed‐based connectivity analysis (real‐time and offline)
The time courses of selected ROIs were extracted from the preprocessed data using either the atlas‐based or manually delineated seed regions (real‐time and offline) in TurboFIRE. ROIs were designated as seed regions to extract time courses for correlation analysis or as reference regions to extract time courses for regression. The signal time courses within the sliding‐window were used as an input for generating a reference vector model with regressors that was dynamically updated at each TR (Gao & Posse, 2004). In addition to ROI signals from CSF and WM, the time courses from six motion parameters were also regressed. Voxel‐based sliding‐window correlation coefficients between the regressed signal time courses in each pixel and the regressed reference vector were computed by adapting the methodology described in Gembris et al. (2000). A maximum of four seed regions were processed in parallel with detrending of six rigid body motion parameters along with WM and CSF time courses. For performance reasons, only two seed regions were processed during real‐time analysis. A 15 s sliding‐window width was chosen as it provides a balance between confound suppression and loss of sensitivity due to high‐pass filtering of low frequency connectivity (Posse et al., 2013). The resulting sliding‐window correlation maps were averaged using an efficient implementation of a running mean and the standard deviation (SD) of Pearson's correlation coefficients to compute cumulative maps during the scan (Posse et al., 2013). A correlation threshold of 0.5 was used, which corresponds a threshold of p < .0001 (corrected for Family‐wise error rates using an AR[3] model), and a cluster size of three voxels. Offline cluster analyses were performed for each seed region using k‐means clustering among the 24 nearest neighbor voxels to record the spatial extent of each cluster (measured in number of voxels), peak (maximum correlation), mean (correlation of the cluster), SD of the correlation (of the cluster), and the anatomical location of the peak voxel in MNI coordinates within each cluster.
2.3.4. Model‐based analysis of task‐activation (real‐time and offline)
Task‐fMRI analysis consisted of simultaneous cumulative correlation analysis with up to 12 individually modeled reference vectors convolved with a canonical six‐parameter hemodynamic response model (Posse et al., 2001). Three parallel analyses with time shifts of 0, −2 s, +2 s relative to the instructed task onset time were performed in real‐time to account for possible early/delayed execution of the task. A correlation threshold of 0.5 was used (see Section 2.3.3). Offline cluster analyses (see above) were performed for each reference vector.
2.3.5. Real‐time data quality assessment
Primary criteria were (a) spatial localization of connectivity/activation in primary motor and central visual cortices (threshold: ρ mean: 0.4) and in Broca's and Wernicke's areas (threshold: ρ mean: 0.3) after the initial 60 s of the scan and (b) head movement (TR‐by‐TR displacement threshold: translations: 0.5 mm, rotations: 1°, whole scan displacement threshold: translations: 2 mm, rotations: 2°), which were monitored concurrently. Secondary metrics that were monitored included: signal drifts (threshold: 1%), the level of false‐positive correlation/activation in WM and at slice edges (threshold: ρ mean: 0.3), delays in measured signal time courses with respect to modeled task paradigm (threshold: 2 s), and signal amplitude variations between task blocks (threshold: 50%). The anatomical localization of resting‐state networks and task‐activation was assessed in reference to the integrated Talairach Daemon database. If spatial localization of connectivity/activation and movement criteria were not met, scans were repeated depending on the magnitude of deviation. If secondary metrics were not met, scans were flagged for further examination during postprocessing.
2.3.6. Comparison with intraoperative ECS
The connectivity and activation maps generated during real‐time or offline fMRI analyses (see Section 2.3) in TurboFIRE were coregistered to the clinical MRIs (FLAIR, precontrast, and postcontrast T1) using SPM12 (https://www.fil.ion.ucl.ac.uk/spm/). The Euclidian distances between (a) the peak voxel coordinates of resting‐state connectivity and task‐activation relative to the ECS coordinates and (b) the coordinates of the nearest edges of resting‐state connectivity and task‐activation clusters (at threshold p < .001) relative to the ECS coordinates were measured. Since resting‐state maps in most cases showed spatially extensive connectivity, the peak voxels of resting‐state connectivity were searched within a slice offset range of ±1 cm from the slice locations of the peaks of task‐activation. The lateral distance was not constraint.
2.3.7. Clinical presurgical tfMRI analysis
Clinical presurgical tfMRI data were processed using the DynaSuite post processing package (Invivo Corporation) using motion correction, spatial alignment with the T1 structural data and spatial smoothing using an isotropic 6 mm Gaussian kernel. A general linear model was applied and resulting activation maps were displayed with a threshold of p < .001 (Bonferroni corrected), and a cluster size of three voxels.
3. RESULTS
3.1. Real‐time analyses
3.1.1. Real‐time data quality monitoring
Real‐time monitoring of data quality enabled rapid optimization of scan protocols and seed selection, early identification of task noncompliance, and head movement‐related false‐positive connectivity in WM and at slice edges in all patients.
The nodes of major resting‐state networks in primary motor cortex in Patients 1, 3, 4, and 5, and in Broca's area were above detection threshold in all patients within the first 30–60 s of the scans, with the corresponding resting‐state networks stabilizing within 3–4 min and not undergoing significant changes for the remainder of the 10 min scan duration. Four of the five patients had head movement with linear drifts less than 2 mm and rotations less than 2°. Patient 3 with Grade III anaplastic Astrocytoma exceeded the translation and rotation thresholds during the second half of the resting‐state scan. The motion parameters showed a spike starting at 5.8 min and maintained this displacement though 6.3 min into the scan, which resulted in signal amplitude changes in the motor cortex and in Broca's area. The movement resulted in an approximately 20% reduction of the spatial extent of the observed resting‐state connectivity without significantly impacting spatial localization of sensorimotor and language connectivity on the lesion side and without causing false‐positive connectivity (Figure 2). The scan was therefore continued.
Figure 2.

Real‐time data quality monitoring using motion parameters, seed region time courses, and temporal dynamics of the corresponding cumulative correlation maps in Patient 3 with anaplastic astrocytoma. (a) Translational (t x, t y, t z—blue), (b) rotational (r x, r y, r z—red) motion parameters with increased movement starting at 5.8 min into the scan until 6.3 min. The resulting signal amplitude changes in the time courses of (c) sensorimotor network (SMN) and (e) LAN, along with the corresponding correlation maps (d) SMN, and (f) LAN shown at 2, 4, 6, 8, and 10 min demonstrate tolerance to movement (maps at 6 min—middle) as the effect size was minimized due to the averaging across the sliding‐windows (arbitrary units [a.u.])
In Patient 2, the slice angulation was increased to minimize signal loss in frontal cortex, which degraded spatial normalization that could not be corrected in real‐time due to time constraints and resulted in decreased correlations in target areas and increased false‐positive correlation at slice edges. Translations were less than 1 mm, rotations were less than 1° and signal drifts in the seed ROIs were less than 1%. The scan was therefore continued and successfully processed offline using improved spatial normalization (see Section 3.2).
Reproducibility of resting‐state connectivity in primary motor cortex and in Broca's area was tested in two consecutive 10 min resting‐state scans in Patient 1 and showed comparable patterns of connectivity in the sensorimotor and language networks with increased correlation levels in the second scan due to reduced head movement. False‐positive correlation in WM and at slice edges was below threshold in all patients.
Task‐related activation in primary motor and central visual cortices was typically above threshold after the first task block. Task‐activation in Broca's and Wernicke's areas was usually detected after two to three task blocks. Signal onset delays and variability in signal amplitude between task blocks were below threshold in all cases. In one patient, noncompliance during the first task was detected after the first block of the motor‐visual task and prompted scan repetition using modified instructions that resulted in successful mapping of sensorimotor and visual cortices. BOLD signal fluctuation due to cardiac pulsation (heart rate varied between 60 and 80 beats per minute across patients) was suppressed by >35 dB using the moving average low pass filter. The respiratory rate varied between 20 and 30 breaths per minute, which in four out of five patients fell within the range of the moving average low pass filter, resulting in strong suppression of respiratory artifacts.
3.1.2. Real‐time rsfMRI of motor and language areas
The data in Patients 1, 3, 4, and 5 with seed in BA1‐3L showed bilateral connectivity in primary motor areas with correlations ranging from 0.5 to 0.7 and in supplementary motor area (SMA) with correlations ranging from 0.3 to 0.5 (Figure 3a). Additional connectivity encompassing part of auditory cortex was usually observed. Resting‐state language connectivity in Broca's area was detected in all patients, predominantly left‐lateralized and usually weaker than motor connectivity, necessitating a lower threshold of 0.3 (Figure 3b). Connectivity in Wernicke's area was detected in Patients 2, 4, and 5, but not in Patients 1 and 3, which may in part reflect cortical reorganization and/or impaired neurovascular coupling due to the proximity of the tumor. In Patient 3, Wernicke's area was localized neither in rsfMRI nor in tfMRI (see Section 3.1.3), due to proximity of the lesion. However, residual connectivity to Wernicke's area was detected 3 mm posterior to the tumor. Connectivity in the SMA was detected in all patients. Connectivity in Exner's area was detected in Patients 1, 2, and 3. In Patients 4 and 5, Exner's area appeared to be displaced posteriorly due to the tumor.
Figure 3.

Real‐time resting‐state functional magnetic resonance imaging (MRI) of sensorimotor and language networks. (a) Mapping of sensorimotor network overlaid on corresponding T2W MRI: (P1) Two consecutive scans in Patient 1 with glioblastoma, (P3) Patient 3 with anaplastic astrocytoma, (P4) Patient 4 with oligodendroglioma, and (P5) Patient 5 with oligodendroglioma. Motor mapping was not performed in Patient 2 in real‐time. (b) Mapping of language network using seed in Broca's (P1, P3, P4, P5) and Wernicke's (P2) areas overlaid on corresponding T2W MRI. The three selected slices show Broca's (B), Wernicke's (W), Exner's (e), and supplementary motor areas (S). Spatially displaced connectivity possibly due to cortical reorganization or impaired neurovascular coupling is marked with an asterisk (*)
3.1.3. Real‐time tfMRI of motor and language areas
In all patients, task‐activation patterns were spatially focal within a 1 cm radius compared with the resting‐state connectivity that extended along the entire motor strip. Real‐time tfMRI during motor‐visual task in Patients 1, 3, 4, and 5 showed clearly delineated contralateral motor activation in cerebrum and ipsilateral motor activation in cerebellum, along with visual activations in all patients. Language activation in Broca's area was detected in all patients during verb/word generation task. Activation in Wernicke's area was detected in Patients 1, 2, 4, and 5.
3.2. Offline analyses of rsfMRI and tfMRI
Improved positioning of the midpoints of the AC/PC lines in Patients 1 and 2 during offline analysis improved spatial normalization as judged by the overlap of Brodmann area masks with anatomical structures. Correlation values in target regions increased by approximately 30%, and spatial extent of connectivity in major nodes of resting‐state networks increased by approximately 20% compared with the real‐time analysis results. Connectivity in Patients 3, 4, and 5 was consistent with real‐time results. In Patient 2, bilateral connectivity in motor areas and SMA was detected offline using a seed in BA1‐3L. The peaks of resting‐state connectivity were colocalized within 5 mm of the peaks of task‐based activation. The unilateral seed region in Broca's area BA44,45L in three of the five patients connected to the six cortical areas identified in Benjamin et al. (2017). In Patient 3, unexpected additional language connectivity in anterior insula was detected using a seed in BA44,45L (Figure 4), which was retrospectively associated with a postoperative language deficit after resection. The corresponding language activation during verb generation in anterior insula was below a 0.5 correlation threshold. It was however detected in the clinical presurgical tfMRI scan, suggesting variability in task execution. Mean and peak correlation values in motor areas were larger than those in language areas (Table 2).
Figure 4.

Offline language localization in anterior insula (blue circle) in Patient 3 with anaplastic astrocytoma overlaid on T1W magnetic resonance imaging (MRI): (a) T2W MRI showing the left BA44‐45 seed region in green, (b) T2W MRI showing the tumor‐related signal abnormality (c) language resting‐state connectivity in anterior insula using a seed in left BA44‐45, (d) activation in task‐based functional (fMRI) below threshold, and (e) clinical presurgical task‐based fMRI activation in anterior insula (purple), in addition to other task‐based activations color‐coded in red, green, dark gray, and yellow
Table 2.
Mean and peak correlation values of resting‐state connectivity and task‐activation from offline cluster analysis performed at a correlation threshold of 0.5 in all patients
| Rest FMRI | Task FMRI | |||
|---|---|---|---|---|
| Patient | Motor | Language | Motor | Language |
| Mean | ||||
| P1 | 0.43 | 0.55 | 0.60 | 0.59 |
| 0.60a | 0.60a | |||
| P2 | 0.53 | 0.60 | ||
| P3 | 0.61 | 0.55 | 0.60 | 0.60 |
| P4 | 0.61 | 0.53 | 0.61 | 0.60 |
| P5 | 0.60 | 0.56 | 0.65 | 0.60 |
| Peak | ||||
| P1 | 0.50 | 0.74 | 0.80 | 0.79 |
| 0.88a | 0.83a | |||
| P2 | 0.63 | 0.74 | ||
| P3 | 0.82 | 0.66 | 0.76 | 0.77 |
| P4 | 0.86 | 0.60 | 0.83 | 0.76 |
| P5 | 0.87 | 0.65 | 0.90 | 0.30 |
Second resting‐state scan in Patient 1.
Additional analyses using manually placed seeds in the vicinity of the lesions revealed areas that were at possible risk during surgical resection. For example, in Patient 1 significant connectivity to premotor and language regions was detected using a seed medial to the tumor along midline (Figure 5). Connectivity was also detected using seeds anterior and lateral to the tumor close to Exner's area in proximity to the resection margins. Seeds posterior to the tumor mostly in WM and in the necrotic core of the glioblastoma did not show any significant connectivity, as expected.
Figure 5.
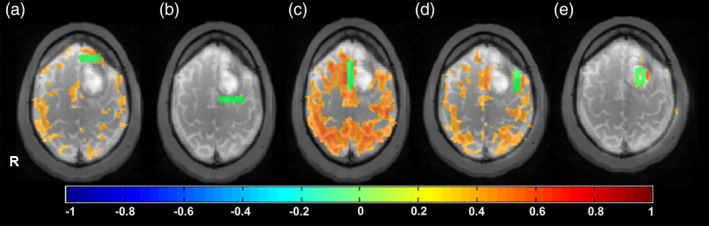
Offline resting‐state analysis in Patient 1 with a glioblastoma using manual seed regions (green) overlaid on T2W magnetic resonance imaging (MRI). Seed locations (a) anterior, (b) posterior, (c) along midline, and (d) lateral to the tumor adjacent to Exner's area display different degrees of connectivity with the sensorimotor and language networks. (e) The seed within the necrotic core of the tumor does not show significant connectivity, as expected
3.3. Electrocortical mapping, and preoperative and postoperative assessments
Awake electrocortical mapping was successful in all patients with appropriate intraoperative behavioral correlates and was continued throughout the surgery to enable maximum, safe surgical resection. All patients, except Patient 3, returned to their preoperative baseline motor and speech exams. Patient 3 continues to have mild deficits in verbal fluency and naming. Details of electrocortical mapping and preoperative and postoperative neuropsychological testing can be found in Supporting Information S1.
3.4. Comparison of rsfMRI and tfMRI with ECS
The data showed a high degree of consistency between resting‐state connectivity and task‐activation and ECS localization of motor cortex and Broca's area (Table 3). The peaks of resting‐state connectivity and task‐based activation in the motor cortex in Patient 1 (Figure 6a–d) were localized within 8 mm of the intraoperative ECS localization of the motor cortex. In Patient 4, sensorimotor resting‐state connectivity and the corresponding task‐activation were colocalized with ECS within 11 mm (Figure 6e–h). In Patient 5, sensorimotor resting‐state connectivity and the corresponding task‐activation were co‐localized with ECS within 9 mm, respectively (Figure 6i–l). The peaks of resting‐state connectivity in the sensorimotor system were in all cases closer to the ECS coordinates compared to the peaks of task‐activation. The corresponding nearest edge distances to the ECS coordinates were slightly shorter than the corresponding peak distances, within a voxel (Table 3).
Table 3.
Euclidian distances between the peaks of resting‐state connectivity and task‐activation relative to the electrocortical stimulation (ECS) coordinates, and the nearest edges of resting‐state connectivity and task‐activation clusters (at threshold p < .001) relative to the ECS coordinates
| Functional systems affected | Euclidean distance: fMRI peak—ECS (mm) | Euclidean distance: fMRI edge—ECS (mm) | |||||||||
|---|---|---|---|---|---|---|---|---|---|---|---|
| Motor | Language | Motor | Language | ||||||||
| Patient | Age/sex | Tumor type | Rest | Task | Rest | Task | Rest | Task | Rest | Task | |
| P1 | 55/M | Glioblastoma WHO Grade IV | Motor and language (Broca's) | 7 | 8 | 13 | 10 | 6 | 5 | 5 | 4 |
| P2 | 32/F | Ganglioglioma WHO Grade I | Language—Wernicke's | 8 | 10 | 5 | 5 | ||||
| P3 | 55/F | Anaplastic astrocytoma WHO Grade III | Language—Broca's | 4 | 6 | 4 | 5 | ||||
| Language—Wernicke's | 25a | b | 25a | b | |||||||
| P4 | 58/M | Oligodendroglioma WHO Grade II | Motor and language (Broca's) | 8 | 11 | 12 | 10 | 8 | 9 | 5 | 6 |
| P5 | 31/M | Oligodendroglioma WHO Grade II | Motor | 5 | 9 | 4 | 6 | ||||
False‐positive fMRI localization, possibly due to cortical reorganization or impaired neurovascular coupling in Patient 3.
False‐negative fMRI localization, possibly due to cortical reorganization or impaired neurovascular coupling in Patient 3.
Figure 6.

Resting‐state and task‐based functional magnetic resonance imaging (MRI) of the motor areas in comparison with electrocortical stimulation (ECS) in Patients 1, 4, and 5. Motor and language mapping with (a, e, i) intraoperative view of tumor and electrocorticography, (b, f, j) ECS localization of motor stimulation (crosshair) overlaid on T2W MRI, (c, g, k) resting‐state localization of sensorimotor network, and (d, h, l) task‐activation in motor area
The peaks of resting‐state language connectivity and task‐activation in Broca's area in Patient 1 were colocalized within 13 mm (Figure 7a–d). The peaks of resting‐state language connectivity and task‐based activation in Wernicke's area in Patient 2 were localized within 10 mm of the intraoperative ECS of speech arrest (Figure 7e–h). The localization of Broca's area in Patient 3 in both rsfMRI and tfMRI was within 6 mm whereas the localization of Wernicke's area in resting‐state fMRI was 25 mm posterior to the ECS determined localization (Figure 7i–o). The peaks of resting‐state connectivity and task‐activation in what appeared to be Exner's area in Patient 4 were located in close proximity, within 12 mm (Figure 7p–s). The corresponding nearest edge distances to the ECS coordinates were shorter than the corresponding peak distances, in some cases as much as 8 mm (Table 3).
Figure 7.

Resting‐state and task‐based functional magnetic resonance imaging (fMRI) of language areas in comparison with electrocortical stimulation (ECS) in Patients 1, 2, 3, and 4: (a, e, i, p) intraoperative view of tumor (T) and functional areas (motor [M], sensory [Sm], face [F], speech arrest [S], Broca's [B], Wernicke's [W]), (b, f, j, m, q) ECS localization of language stimulation (crosshair) overlaid on T2W MRI, (c, k, n, r) resting‐state connectivity using seed in Broca's area, and (g) in Wernicke's area, and (d, h, l, o, s) activation during verb (P1, P2, P3) and word (P4) generation tasks. In Patient 3, resting‐state connectivity was detected in the slice 3 mm superior to Wernicke's area (o) but not in Wernicke's area (n). No task‐activation was found in the vicinity of Wernicke's area. In Patient 4, speech arrest was found posterior to the tumor
4. DISCUSSION
4.1. Methodology
Our study shows that real‐time rsfMRI of the sensorimotor and language networks in patients with brain tumors is feasible in a clinical research setting and enables monitoring of clinical data quality during the ongoing scan. Real‐time monitoring of true‐positive connectivity in target networks and false‐positive connectivity in WM and at slice edges, head movement and signal drifts was predictive of scan success in terms of sensitivity and specificity of mapping major nodes of these networks, which was confirmed in offline analysis. Mapping of resting‐state connectivity is highly sensitive to the seed localization, which is readily observed in the form of loss of sensitivity in the target areas and increased false‐positive connectivity at slice edges. Real‐time monitoring of movement‐related artifacts and consequent sensitivity loss in resting‐state maps during the ongoing scan enabled rapid adaption of the scan protocols (e.g., to either continue or to repeat a scan after instructing the subject to reduce head movement or to minimize motion by addressing possible subject discomfort due to initial positioning). This has also been demonstrated in a recent study using a real‐time motion analytics tool that allows to censor data frames affected by head movement and provides statistics to determine the scan time necessary to collect a desired amount of low movement data (Dosenbach et al., 2017). Our approach extends the real‐time assessment of data quality by additionally providing quantifiable metrics of resting‐state connectivity and task‐activation, which were generally consistent with results in offline analyses. For example, real‐time data quality monitoring in tfMRI resulted in scan repetition in one subject due to initial task noncompliance. The benefit of ascertaining scan success in rsfMRI and tfMRI contributed to an efficient 1‐hr multimodal scan protocol, which included DTI, MRSI, and high‐resolution MRI. Real‐time data quality monitoring is becoming increasingly important in neuroscience studies (Koush, Zvyagintsev, Dyck, Mathiak, & Mathiak, 2012) and in the clinical setting, and real‐time rsfMRI has the potential to increase clinical acceptance and reduce cost.
Our real‐time seed‐based moving average sliding‐window correlation approach (Posse et al., 2013) with regression of confounding signals from head movement and physiological noise in WM and CSF (Vakamudi et al., 2016; Vakamudi et al., 2017) proved tolerant to head movement up to 2 mm of translation and 2° of rotation, and signal transients up to 1% of time points. This confound tolerance is comparable to conventional offline seed‐based connectivity analysis using despiking and regression across the entire time series, as shown in our recent work (Vakamudi et al., 2016; Vakamudi et al., 2017). Our data also suggest that mapping the major nodes in these networks is feasible in 10 min scan time. This high sensitivity was in part due to the high acquisition speed of multiband EPI, which enabled real‐time filtering of cardiac and respiratory signal pulsation. Considerably longer scan times and larger number of seeds will be required to obtain more detailed maps of subnetworks within the sensorimotor and language networks (Laumann et al., 2015).
Resting‐state connectivity was colocalized with tfMRI within 5 mm in the sensorimotor cortex. This finding is in line with studies in healthy subjects (Smith et al., 2009; R. Li et al., 2011; Abou‐Elseoud et al., 2010; Allen et al., 2011) and in patients with neurological diseases that reported high overlap between rsfMRI and tfMRI (Zhang et al., 2009; Shimony et al., 2009; Kokkonen et al., 2009), high concordance with cortical stimulation mapping (Zhang et al., 2009) and reproducibility of rsfMRI‐derived motor maps comparable to that of tfMRI (Mannfolk et al., 2011). The spatial extent of the sensorimotor network in our study was larger than the activation measured in tfMRI and extended inferiorly encompassing additional motor areas, which shows the utility of rsfMRI for mapping entire functional systems, albeit with limited spatial specificity within these systems when scanning single subjects. Localization of Broca's area in rsfMRI and tfMRI was mapped within 4 mm in all patients. However, other nodes of the language system such as Wernicke's and Exner's areas were more variable, which was in part due to the lower correlation values in the language network during resting‐state and impaired neurovascular coupling and/or cortical reorganization. Variability in the language network has been reported in previous studies both in healthy subjects (Tie et al., 2013; Kollndorfer et al., 2013) and in patients with brain tumors (Sair et al., 2016).
The consistency of real‐time resting‐state sensorimotor and Broca's area mapping in this study can be attributed to the fact that the lesions in the patients studied were not associated with major changes in these anatomical areas, which facilitated automated atlas‐based seed placement. However, more robust automated methods for seed placement are desirable to accommodate cortical reorganization. We are currently developing iterative approaches to improve seed selection tailored to the individual patient's neuroanatomy to increase sensitivity and specificity of resting‐state connectivity (Vakamudi, Trapp, & Posse, 2015). This approach has the potential to adapt to limited cortical reorganization within atlas‐based target areas. Mitchell et al. demonstrated in a limited number of patients with epilepsy and brain tumors, that an artificial neural network algorithm with subject‐specific modifications reliably identified motor and language networks even in cases of grossly altered anatomy due to lesion mass effect (Mitchell et al., 2013). A more recent study using this approach showed a significantly lower failure rate of rsfMRI compared with tfMRI (Leuthardt et al., 2018).
4.2. Clinical relevance
The data in patients showed a high degree of consistency between ECS, resting‐state connectivity, and task‐activation in motor and Broca's areas. The edges of resting‐state connectivity and task‐activation clusters were within 5–10 mm of ECS localization. Taking into consideration the focal spatial extent of resting‐state connectivity and task‐based activation within the axial plane (~3–5 mm), the distances between the ECS coordinates and the peaks of resting‐state connectivity and task‐based activation were between 6 and 15 mm. This is comparable to the localization criteria reported in previous tfMRI studies (see for example, Bizzi et al., 2008). The larger spatial extent of resting‐state connectivity along the inferior–superior axis and in the vicinity of the tumors enabled probing of additional areas that were at risk for surgical resection. Language deficits following the resection of regions with resting‐state connectivity in the vicinity of anterior insula and Exner's area in Patients 3 and 4, respectively, are examples that support a possible role of rsfMRI in assessing postsurgical deficits that complements tfMRI. A recent study in patients with epilepsy showed that resection in frontal areas with presurgical task‐based fMRI is not without risk for postsurgical drop of verbal fluency (Labudda, Mertens, Kalbhenn, Schulz, & Woermann, 2017). Further refinement of parcellating resting‐state connectivity in conjunction with task‐based activation is expected to provide more specific predictions regarding surgical risks. Recent efforts of parcellating RSN connectivity in single subjects have sought to overcome the shortcomings of spatial normalization, lesion‐related plasticity, and variability due to structured noise sources, by using multiscale clustering, dictionary‐based learning, template matching, multilayer artificial neural networks, multimodal parcellation, and related approaches, in addition to studying highly sampled individuals (Anderson, Ferguson, Lopez‐Larson, & Yurgelun‐Todd, 2011; Cohen et al., 2008; Blumensath et al., 2013; K. Li, Langley, Li, & Hu, 2014; Cole, Smith, & Beckmann, 2010; Mitchell et al., 2013; Laumann et al., 2015; Anderson et al., 2011; Gordon et al., 2017; Leuthardt et al., 2015; Glasser et al., 2016; H. Li et al., 2017; Dornas & Braun, 2018; Chong et al., 2017).
While delineation of sensorimotor cortex can be performed with a high degree of sensitivity and specificity using tfMRI, its utility in the language mapping is still evolving. Of the three major clinical applications of language tfMRI, that is, lateralization, localization, and prediction of postoperative deficits, it is the localization of individual language nodes that suffers the most from barriers of sensitivity and specificity (Binder et al., 2011). This is largely due to validity being highly dependent on the combined limitations presented by specific lexico‐semantic paradigms used and variable patient cooperation (Benjamin et al., 2017). The use of tfMRI for language localization has also been tested, with clinicians reporting successful mapping of Broca's and Wernicke's areas, 75 and 71% of the time, respectively (Benjamin et al., 2017). In another study, passive listening tfMRI was able to localize language‐specific temporoparietal regions in pediatric epilepsy patients within 9.2 mm of localizations achieved by invasive functional mapping (Suarez et al., 2014). However, delineation of functional boundaries during surgery requires real‐time ECS‐based mapping as fMRI alone is not adequate to guide intraoperative decision‐making (Meier et al., 2013).
Intraoperative awake mapping for eloquent cortical localization has been used in neurosurgery literature for almost 100 years (Penfield & Roberts, 1959). Its value in language localization is unparalleled (Sanai et al., 2008). However, the ability to successfully conduct awake mapping is dependent on patient cooperation, as well as intraoperative factors like seizures and sedation (Nossek et al., 2013). For patients that cannot undergo awake mapping, there is an urgent need to improve current noninvasive mapping techniques.
Advanced functional and metabolic imaging techniques have demonstrated considerable potential for determining prognosis, postoperative deficits, and treatment response in patients with brain tumors (Lambin et al., 2017; Barone et al., 2014; Spena et al., 2010; Bailey et al., 2015; Huang et al., 2016; Pillai, 2010). A particular focus of recent studies has been outcome prediction for high grade gliomas (Q. Li et al., 2017; Boonzaier et al., 2017; L. Liu et al., 2016; Shiroishi et al., 2016; Marcus et al., 2017) and the nonenhancing component of the tumor (Jain et al., 2014). For low‐grade gliomas, prognostic models based on simple preoperative factors have been proposed (E.F. Chang et al., 2008). Several studies investigated prediction of postoperative deficits using tfMRI, DTI, and rCBV (Boonzaier et al., 2017) and have shown that proximity of lesions to eloquent cortex and corresponding fiber tracts or greater degree of eloquent WM (e.g., corticospinal tracts) involvement result in higher likelihood of postoperative functional deficits (Spena et al., 2010; Ulmer et al., 2004). However, another study stated that the prediction of perioperative motor and language deficits based on the enhancing lesion to activation distance and degree of tract involvements may have been confounded by sensitivity limitations due to neurovascular uncoupling and inability to take infiltration into consideration (Bailey et al., 2015).
4.3. Limitations and future work
Limitations of this study include small number of patients, and the heterogeneity of lesion localization and spatial extent. Studies in patients with more strongly altered anatomy due to lesion mass effect that impacts seed selection and in healthy controls to assess the effects of increased levels of head movement are required to assess the robustness of this approach. In the current study, we did not assess abnormalities in neurovascular coupling and/or cortical reorganization in the vicinity of brain tumors that may result in false negative findings. A recent review noted that even low‐grade brain tumors can exhibit abnormal neurovascular coupling (Pak et al., 2017). It has been suggested that breath‐hold cerebrovascular reactivity mapping constitutes an essential component of quality control analysis in clinical tfMRI, particularly when performed for presurgical mapping of eloquent cortex (Pillai & Mikulis, 2015). This approach is readily implemented in patients who can perform the task and may help to determine extended scan times to mitigate reduced BOLD sensitivity.
Several technical enhancements of the TurboFIRE tool are required to improve the utility of this real‐time rsfMRI approach. Seed selection currently requires a separate prescan for spatial normalization, manual delineation of WM and CSF regions, and semiautomated parameter selection of the analysis pipeline, which takes 5–10 min and interrupts workflow. Spatial normalization requires manual selection of the midpoint of the AC/PC line, and nonlinear regularization in the presence of subject‐dependent signal dephasing in inferior brain regions, all of which are time consuming in a real‐time setting and subject to operator error. Automation of these preprocessing steps using improved coregistration and spatial normalization, and tissue segmentation implemented in widely available software packages, such as SPM, to generate WM and CSF masks is expected to improve workflow and reduce operator load. Artificial intelligence‐based classification of resting‐state connectivity is expected to provide automated real‐time assessment of data quality and to improve the consistency between real‐time and offline analyses results. This may ultimately allow to integrate real‐time connectivity maps into neurosurgical guidance to complement tfMRI. We are also developing highly accelerated simultaneous multislab echo‐volumar imaging to further increase temporal resolution and sensitivity of rsfMRI (Vakamudi et al., 2018).
Future developments include parcellation of eloquent cortex based on combining rsfMRI and tfMRI, integration with DTI to assess the integrity of fiber tracts in the vicinity of a tumor (O'Donnell et al., 2017), and high‐speed MRSI to delineate tumor margins and identify infiltration. We anticipate that standardization and validation of advanced imaging techniques and data mining tools in prospective studies will present patients with a risk–benefit assessment and allow neurosurgeons to better understand oncological and functional outcomes of resection.
5. CONCLUSION
This study demonstrates the feasibility of real‐time high‐speed rsfMRI in a clinical research setting. This approach not only allows for real‐time monitoring of data quality, but also has the potential for real‐time presurgical mapping of eloquent cortex in patients with brain tumors with high concordance relative to task‐activation and ECS localization, within the constraints of impaired neurovascular coupling and/or cortical reorganization.
CONFLICT OF INTERESTS
The principal investigator Prof. Stefan Posse is the founder and owner of NeurInsight LLC, a startup company that received STTR grant funding for this study. The coauthors declare no conflicts of interest.
Supporting information
Data S1: Supporting Information
ACKNOWLEDGMENTS
We gratefully acknowledge our patients for their time and effort participating in this study. Howard Yonas (Neurosurgery) graciously supported the initial phase of this project and provided guidance during the implementation of the research protocol. We thank Mona Chaney (Neurology) and Erin Semler (Neurosurgery) for their assistance with patient recruitment and Stacy Steadman (Neurosurgery) for facilitating data collection in the operating room. Kimball Malherbe (Medtronic Navigation, Inc.) provided support for the Stealth workstation. We thank Catherine Smith and Diana South (Mind Research Network) for their expert support of MRI scanner operations. Our sincere gratitude to Steven R. Dager, Mary Jacintha, Giske Opheim, and Olaf B. Paulson for reviewing the manuscript and providing insightful comments. Research reported in this publication was supported the National Institutes of Health grants 1R41NS090691 and 1R21EB018494 (PI: S.P.).
Vakamudi K, Posse S, Jung R, Cushnyr B, Chohan MO. Real‐time presurgical resting‐state fMRI in patients with brain tumors: Quality control and comparison with task‐fMRI and intraoperative mapping. Hum Brain Mapp. 2020;41:797–814. 10.1002/hbm.24840
Kishore Vakamudi and Stefan Posse are considered as joint first authors.
Funding information National Institute of Biomedical Imaging and Bioengineering, Grant/Award Number: 1R21EB018494; National Institute of Neurological Disorders and Stroke, Grant/Award Number: 1R41NS090691
DATA AVAILABILITY STATEMENT
The data that support the findings of this study are available from the corresponding author upon reasonable request as permitted by HRRC regulations.
REFERENCES
- Abou‐Elseoud, A. , Starck, T. , Remes, J. , Nikkinen, J. , Tervonen, O. , & Kiviniemi, V. (2010). The effect of model order selection in group PICA. Human Brain Mapping, 31, 1207–1216. [DOI] [PMC free article] [PubMed] [Google Scholar]
- Afyouni, S. , Smith, S. M. , & Nichols, T. E. (2019). Effective degrees of freedom of the Pearson's correlation coefficient under autocorrelation. NeuroImage, 199, 609–625. [DOI] [PMC free article] [PubMed] [Google Scholar]
- Agarwal, S. , Sair, H. I. , Airan, R. , Hua, J. , Jones, C. K. , Heo, H. Y. , … Pillai, J. J. (2016). Demonstration of brain tumor‐induced neurovascular uncoupling in resting‐state fMRI at ultrahigh field. Brain Connectivity, 6, 267–272. [DOI] [PMC free article] [PubMed] [Google Scholar]
- Allen, E. A. , Damaraju, E. , Plis, S. M. , Erhardt, E. B. , Eichele, T. , & Calhoun, V. D. (2014). Tracking whole‐brain connectivity dynamics in the resting state. Cerebral Cortex, 24, 663–676. [DOI] [PMC free article] [PubMed] [Google Scholar]
- Allen, E. A. , Erhardt, E. B. , Damaraju, E. , Gruner, W. , Segall, J. M. , Silva, R. F. , … Calhoun, V. D. (2011). A baseline for the multivariate comparison of resting‐state networks. Frontiers in Systems Neuroscience, 5, 2. [DOI] [PMC free article] [PubMed] [Google Scholar]
- Anderson, J. S. , Ferguson, M. A. , Lopez‐Larson, M. , & Yurgelun‐Todd, D. (2011). Reproducibility of single‐subject functional connectivity measurements. American Journal of Neuroradiology, 32, 548–555. [DOI] [PMC free article] [PubMed] [Google Scholar]
- Bailey, P. D. , Zaca, D. , Basha, M. M. , Agarwal, S. , Gujar, S. K. , Sair, H. I. , … Pillai, J. J. (2015). Presurgical fMRI and DTI for the prediction of perioperative motor and language deficits in primary or metastatic brain lesions. Journal of Neuroimaging, 25, 776–784. [DOI] [PubMed] [Google Scholar]
- Barone, D. G. , Lawrie, T. A. , & Hart, M. G. (2014). Image guided surgery for the resection of brain tumours. Cochrane Database of Systematic Reviews, 1, CD009685. [DOI] [PMC free article] [PubMed] [Google Scholar]
- Benjamin, C. F. , Walshaw, P. D. , Hale, K. , Gaillard, W. D. , Baxter, L. C. , Berl, M. M. , … Bookheimer, S. Y. (2017). Presurgical language fMRI: Mapping of six critical regions. Human Brain Mapping, 38, 4239–4255. [DOI] [PMC free article] [PubMed] [Google Scholar]
- Binder, J. R. , Gross, W. L. , Allendorfer, J. B. , Bonilha, L. , Chapin, J. , Edwards, J. C. , … Weaver, K. E. (2011). Mapping anterior temporal lobe language areas with fMRI: A multicenter normative study. NeuroImage, 54, 1465–1475. [DOI] [PMC free article] [PubMed] [Google Scholar]
- Bizzi, A. , Blasi, V. , Falini, A. , Ferroli, P. , Cadioli, M. , Danesi, U. , … Broggi, G. (2008). Presurgical functional MR imaging of language and motor functions: Validation with intraoperative electrocortical mapping. Radiology, 248, 579–589. [DOI] [PubMed] [Google Scholar]
- Blumensath, T. , Jbabdi, S. , Glasser, M. F. , Van Essen, D. C. , Ugurbil, K. , Behrens, T. E. , & Smith, S. M. (2013). Spatially constrained hierarchical parcellation of the brain with resting‐state fMRI. NeuroImage, 76, 313–324. [DOI] [PMC free article] [PubMed] [Google Scholar]
- Bollmann, S. , Puckett, A. M. , Cunnington, R. , & Barth, M. (2018). Serial correlations in single‐subject fMRI with sub‐second TR. NeuroImage, 166, 152–166. [DOI] [PubMed] [Google Scholar]
- Boonzaier, N. R. , Larkin, T. J. , Matys, T. , van der Hoorn, A. , Yan, J. L. , & Price, S. J. (2017). Multiparametric MR imaging of diffusion and perfusion in contrast‐enhancing and nonenhancing components in patients with glioblastoma. Radiology, 284, 180–190. [DOI] [PubMed] [Google Scholar]
- Chang, C. , & Glover, G. H. (2010). Time‐frequency dynamics of resting‐state brain connectivity measured with fMRI. NeuroImage, 50, 81–98. [DOI] [PMC free article] [PubMed] [Google Scholar]
- Chang, E. F. , Smith, J. S. , Chang, S. M. , Lamborn, K. R. , Prados, M. D. , Butowski, N. , … McDermott, M. M. (2008). Preoperative prognostic classification system for hemispheric low‐grade gliomas in adults. Journal of Neurosurgery, 109, 817–824. [DOI] [PubMed] [Google Scholar]
- Chong, M. , Bhushan, C. , Joshi, A. A. , Choi, S. , Haldar, J. P. , Shattuck, D. W. , … Leahy, R. M. (2017). Individual parcellation of resting fMRI with a group functional connectivity prior. NeuroImage, 156, 87–100. [DOI] [PMC free article] [PubMed] [Google Scholar]
- Cohen, A. L. , Fair, D. A. , Dosenbach, N. U. , Miezin, F. M. , Dierker, D. , Van Essen, D. C. , … Petersen, S. E. (2008). Defining functional areas in individual human brains using resting functional connectivity MRI. NeuroImage, 41, 45–57. [DOI] [PMC free article] [PubMed] [Google Scholar]
- Cole, D. M. , Smith, S. M. , & Beckmann, C. F. (2010). Advances and pitfalls in the analysis and interpretation of resting‐state FMRI data. Frontiers in Systems Neuroscience, 4, 8. [DOI] [PMC free article] [PubMed] [Google Scholar]
- Dornas, J. V. , & Braun, J. (2018). Finer parcellation reveals detailed correlational structure of resting‐state fMRI signals. Journal of Neuroscience Methods, 294, 15–33. [DOI] [PubMed] [Google Scholar]
- Dosenbach, N. U. F. , Koller, J. M. , Earl, E. A. , Miranda‐Dominguez, O. , Klein, R. L. , Van, A. N. , … Fair, D. A. (2017). Real‐time motion analytics during brain MRI improve data quality and reduce costs. NeuroImage, 161, 80–93. [DOI] [PMC free article] [PubMed] [Google Scholar]
- Feinberg, D. A. , Moeller, S. , Smith, S. M. , Auerbach, E. , Ramanna, S. , Gunther, M. , … Yacoub, E. (2010). Multiplexed echo planar imaging for sub‐second whole brain FMRI and fast diffusion imaging. PLoS One, 5, e15710. [DOI] [PMC free article] [PubMed] [Google Scholar]
- Gao K., Posse, S. (2003). TurboFire: Real‐time fMRI with automated spatial normalization and Talairach daemon database. Proc. 9th Annual Meeting of the Organization of Human Brain Mapping, Budapest, Hungary, 838.
- Gao K., Posse, S. (2004). TurboFIRE: Real‐Time fMRI with Online Generation of Reference Vectors. Proc. 10th Annual Meeting of the Organization of Human Brain Mapping, Budapest, Hungary, WE177.
- Gembris, D. , Taylor, J. G. , Schor, S. , Frings, W. , Suter, D. , & Posse, S. (2000). Functional magnetic resonance imaging in real time (FIRE): Sliding‐window correlation analysis and reference‐vector optimization. Magnetic Resonance in Medicine, 43, 259–268. [DOI] [PubMed] [Google Scholar]
- Giussani, C. , Roux, F. E. , Ojemann, J. , Sganzerla, E. P. , Pirillo, D. , & Papagno, C. (2010). Is preoperative functional magnetic resonance imaging reliable for language areas mapping in brain tumor surgery? Review of language functional magnetic resonance imaging and direct cortical stimulation correlation studies. Neurosurgery, 66, 113–120. [DOI] [PubMed] [Google Scholar]
- Glasser, M. F. , Coalson, T. S. , Robinson, E. C. , Hacker, C. D. , Harwell, J. , Yacoub, E. , … Van Essen, D. C. (2016). A multi‐modal parcellation of human cerebral cortex. Nature, 536, 171–178. [DOI] [PMC free article] [PubMed] [Google Scholar]
- Gonzalez‐Castillo, J. , Roopchansingh, V. , Bandettini, P. A. , & Bodurka, J. (2011). Physiological noise effects on the flip angle selection in BOLD fMRI. NeuroImage, 54, 2764–2778. [DOI] [PMC free article] [PubMed] [Google Scholar]
- Gordon, E. M. , Laumann, T. O. , Adeyemo, B. , Gilmore, A. W. , Nelson, S. M. , Dosenbach, N. U. F. , & Petersen, S. E. (2017). Individual‐specific features of brain systems identified with resting state functional correlations. NeuroImage, 146, 918–939. [DOI] [PMC free article] [PubMed] [Google Scholar]
- Holodny, A. I. , Schulder, M. , Liu, W. C. , Wolko, J. , Maldjian, J. A. , & Kalnin, A. J. (2000). The effect of brain tumors on BOLD functional MR imaging activation in the adjacent motor cortex: Implications for image‐guided neurosurgery. American Journal of Neuroradiology, 21, 1415–1422. [PMC free article] [PubMed] [Google Scholar]
- Hou, B. L. , Bradbury, M. , Peck, K. K. , Petrovich, N. M. , Gutin, P. H. , & Holodny, A. I. (2006). Effect of brain tumor neovasculature defined by rCBV on BOLD fMRI activation volume in the primary motor cortex. NeuroImage, 32, 489–497. [DOI] [PubMed] [Google Scholar]
- Huang, H. , Ding, Z. , Mao, D. , Yuan, J. , Zhu, F. , Chen, S. , … Zang, Y. F. (2016). PreSurgMapp: A MATLAB toolbox for Presurgical mapping of eloquent functional areas based on task‐related and resting‐state functional MRI. Neuroinformatics, 14, 421–438. [DOI] [PubMed] [Google Scholar]
- Jain, R. , Poisson, L. M. , Gutman, D. , Scarpace, L. , Hwang, S. N. , Holder, C. A. , … Flanders, A. (2014). Outcome prediction in patients with glioblastoma by using imaging, clinical, and genomic biomarkers: Focus on the nonenhancing component of the tumor. Radiology, 272, 484–493. [DOI] [PMC free article] [PubMed] [Google Scholar]
- Jiang, Z. , Krainik, A. , David, O. , Salon, C. , Tropres, I. , Hoffmann, D. , … Le Bas, J. F. (2010). Impaired fMRI activation in patients with primary brain tumors. NeuroImage, 52, 538–548. [DOI] [PubMed] [Google Scholar]
- Kiviniemi, V. , Vire, T. , Remes, J. , Abouelseoud, A. , Starck, T. , Tervonen, O. , & Nikkinen, J. (2011). A sliding time‐window ICA reveals spatial variability of the default mode network in time. Brain Connectivity, 1, 339–347. [DOI] [PubMed] [Google Scholar]
- Kokkonen, S. M. , Nikkinen, J. , Remes, J. , Kantola, J. , Starck, T. , Haapea, M. , … Kiviniemi, V. (2009). Preoperative localization of the sensorimotor area using independent component analysis of resting‐state fMRI. Magnetic Resonance Imaging, 27, 733–740. [DOI] [PubMed] [Google Scholar]
- Kollndorfer, K. , Fischmeister, F. P. , Kasprian, G. , Prayer, D. , & Schopf, V. (2013). A systematic investigation of the invariance of resting‐state network patterns: Is resting‐state fMRI ready for pre‐surgical planning? Frontiers in Human Neuroscience, 7, 95. [DOI] [PMC free article] [PubMed] [Google Scholar]
- Koush, Y. , Zvyagintsev, M. , Dyck, M. , Mathiak, K. A. , & Mathiak, K. (2012). Signal quality and Bayesian signal processing in neurofeedback based on real‐time fMRI. NeuroImage, 59, 478–489. [DOI] [PubMed] [Google Scholar]
- Kruggel, F. , Pelegrini‐Issac, M. , & Benali, H. (2002). Estimating the effective degrees of freedom in univariate multiple regression analysis. Medical Image Analysis, 6, 63–75. [DOI] [PubMed] [Google Scholar]
- Labudda, K. , Mertens, M. , Kalbhenn, T. , Schulz, R. , & Woermann, F. G. (2017). Partial resection of presurgical fMRI activation is associated with a postsurgical loss of language function after frontal lobe epilepsy surgery. Neurocase, 23, 239–248. [DOI] [PubMed] [Google Scholar]
- Lambin, P. , Zindler, J. , Vanneste, B. G. , De Voorde, L. V. , Eekers, D. , Compter, I. , … Walsh, S. (2017). Decision support systems for personalized and participative radiation oncology. Advanced Drug Delivery Reviews, 109, 131–153. [DOI] [PubMed] [Google Scholar]
- Lancaster, J. L. , Rainey, L. H. , Summerlin, J. L. , Freitas, C. S. , Fox, P. T. , Evans, A. C. , … Mazziotta, J. C. (1997). Automated labeling of the human brain: A preliminary report on the development and evaluation of a forward‐transform method. Human Brain Mapping, 5, 238–242. [DOI] [PMC free article] [PubMed] [Google Scholar]
- Lancaster, J. L. , Woldorff, M. G. , Parsons, L. M. , Liotti, M. , Freitas, C. S. , Rainey, L. , … Fox, P. T. (2000). Automated Talairach atlas labels for functional brain mapping. Human Brain Mapping, 10, 120–131. [DOI] [PMC free article] [PubMed] [Google Scholar]
- Laumann, T. O. , Gordon, E. M. , Adeyemo, B. , Snyder, A. Z. , Joo, S. J. , Chen, M. Y. , … Petersen, S. E. (2015). Functional system and areal Organization of a Highly Sampled Individual Human Brain. Neuron, 87, 657–670. [DOI] [PMC free article] [PubMed] [Google Scholar]
- Lee, D. J. , Pouratian, N. , Bookheimer, S. Y. , & Martin, N. A. (2010). Factors predicting language lateralization in patients with perisylvian vascular malformations. Clinical article. Journal of Neurosurgery, 113, 723–730. [DOI] [PMC free article] [PubMed] [Google Scholar]
- Leuthardt, E. C. , Allen, M. , Kamran, M. , Hawasli, A. H. , Snyder, A. Z. , Hacker, C. D. , … Shimony, J. S. (2015). Resting‐state blood oxygen level‐dependent functional MRI: A paradigm shift in preoperative brain mapping. Stereotactic and Functional Neurosurgery, 93, 427–439. [DOI] [PubMed] [Google Scholar]
- Leuthardt, E. C. , Guzman, G. , Bandt, S. K. , Hacker, C. , Vellimana, A. K. , Limbrick, D. , … Benzinger, T. L. S. (2018). Integration of resting state functional MRI into clinical practice—A large single institution experience. PLoS One, 13, e0198349. [DOI] [PMC free article] [PubMed] [Google Scholar]
- Li, H. , Satterthwaite, T. D. , & Fan, Y. (2017). Large‐scale sparse functional networks from resting state fMRI. NeuroImage, 156, 1–13. [DOI] [PMC free article] [PubMed] [Google Scholar]
- Li, K. , Langley, J. , Li, Z. , & Hu, X. P. (2014). Connectomic profiles for individualized resting state networks and regions of interest. Brain Connectivity, 5(2), 69–79. [DOI] [PMC free article] [PubMed] [Google Scholar]
- Li, Q. , Bai, H. , Chen, Y. , Sun, Q. , Liu, L. , Zhou, S. , … Li, Z. C. (2017). A fully‐automatic multiparametric Radiomics model: Towards reproducible and prognostic imaging signature for prediction of overall survival in glioblastoma Multiforme. Scientific Reports, 7, 14331. [DOI] [PMC free article] [PubMed] [Google Scholar]
- Li, R. , Chen, K. , Fleisher, A. S. , Reiman, E. M. , Yao, L. , & Wu, X. (2011). Large‐scale directional connections among multi resting‐state neural networks in human brain: A functional MRI and Bayesian network modeling study. NeuroImage, 56, 1035–1042. [DOI] [PMC free article] [PubMed] [Google Scholar]
- Lin, F. H. , Nummenmaa, A. , Witzel, T. , Polimeni, J. R. , Zeffiro, T. A. , Wang, F. N. , & Belliveau, J. W. (2012). Physiological noise reduction using volumetric functional magnetic resonance inverse imaging. Human Brain Mapping, 33, 2815–2830. [DOI] [PMC free article] [PubMed] [Google Scholar]
- Lin, F. H. , Witzel, T. , Chang, W. T. , Wen‐Kai Tsai, K. , Wang, Y. H. , Kuo, W. J. , & Belliveau, J. W. (2010). K‐space reconstruction of magnetic resonance inverse imaging (K‐InI) of human visuomotor systems. NeuroImage, 49, 3086–3098. [DOI] [PMC free article] [PubMed] [Google Scholar]
- Liu, H. , Buckner, R. L. , Talukdar, T. , Tanaka, N. , Madsen, J. R. , & Stufflebeam, S. M. (2009). Task‐free presurgical mapping using functional magnetic resonance imaging intrinsic activity. Journal of Neurosurgery, 111, 746–754. [DOI] [PMC free article] [PubMed] [Google Scholar]
- Liu, L. , Zhang, H. , Rekik, I. , Chen, X. , Wang, Q. , & Shen, D. (2016). Outcome prediction for patient with high‐grade gliomas from brain functional and structural networks. Medical Image Computing and Computer‐Assisted Intervention, 9901, 26–34. [DOI] [PMC free article] [PubMed] [Google Scholar]
- Liu, X. , & Duyn, J. H. (2013). Time‐varying functional network information extracted from brief instances of spontaneous brain activity. Proceedings of the National Academy of Sciences of the United States of America, 110, 4392–4397. [DOI] [PMC free article] [PubMed] [Google Scholar]
- Mannfolk, P. , Nilsson, M. , Hansson, H. , Stahlberg, F. , Fransson, P. , Weibull, A. , … Olsrud, J. (2011). Can resting‐state functional MRI serve as a complement to task‐based mapping of sensorimotor function? A test–retest reliability study in healthy volunteers. Journal of Magnetic Resonance Imaging, 34(3), 511–517. [DOI] [PubMed] [Google Scholar]
- Marchini, J. L. , & Smith, S. M. (2003). On Bias in the estimation of autocorrelations for fMRI voxel time‐series analysis. NeuroImage, 18, 83–90. [DOI] [PubMed] [Google Scholar]
- Marcus, H. J. , Williams, S. , Hughes‐Hallett, A. , Camp, S. J. , Nandi, D. , & Thorne, L. (2017). Predicting surgical outcome in patients with glioblastoma multiforme using pre‐operative magnetic resonance imaging: Development and preliminary validation of a grading system. Neurosurgical Review, 40, 621–631. [DOI] [PMC free article] [PubMed] [Google Scholar]
- Mathiak, K. , & Posse, S. (2001). Evaluation of motion and realignment for functional magnetic resonance imaging in real time. Magnetic Resonance in Medicine, 45, 167–171. [DOI] [PubMed] [Google Scholar]
- Meier, M. P. , Ilmberger, J. , Fesl, G. , & Ruge, M. I. (2013). Validation of functional motor and language MRI with direct cortical stimulation. Acta Neurochirurgica, 155, 675–683. [DOI] [PubMed] [Google Scholar]
- Mitchell, T. J. , Hacker, C. D. , Breshears, J. D. , Szrama, N. P. , Sharma, M. , Bundy, D. T. , … Leuthardt, E. C. (2013). A novel data‐driven approach to preoperative mapping of functional cortex using resting‐state functional magnetic resonance imaging. Neurosurgery, 73, 969–982. [DOI] [PMC free article] [PubMed] [Google Scholar]
- Nossek, E. , Matot, I. , Shahar, T. , Barzilai, O. , Rapoport, Y. , Gonen, T. , … Ram, Z. (2013). Failed awake craniotomy: A retrospective analysis in 424 patients undergoing craniotomy for brain tumor. Journal of Neurosurgery, 118, 243–249. [DOI] [PubMed] [Google Scholar]
- O'Donnell, L. J. , Suter, Y. , Rigolo, L. , Kahali, P. , Zhang, F. , Norton, I. , … Golby, A. J. (2017). Automated white matter fiber tract identification in patients with brain tumors. Neuroimage Clinical, 13, 138–153. [DOI] [PMC free article] [PubMed] [Google Scholar]
- Pak, R. W. , Hadjiabadi, D. H. , Senarathna, J. , Agarwal, S. , Thakor, N. V. , Pillai, J. J. , & Pathak, A. P. (2017). Implications of neurovascular uncoupling in functional magnetic resonance imaging (fMRI) of brain tumors. Journal of Cerebral Blood Flow and Metabolism, 37, 3475–3487. [DOI] [PMC free article] [PubMed] [Google Scholar]
- Penfield, W. , & Roberts, L. (1959). Speech and brain mechanisms. Princeton, NJ: Princeton University Press. [Google Scholar]
- Pillai, J. J. (2010). The evolution of clinical functional imaging during the past 2 decades and its current impact on neurosurgical planning. AJNR. American Journal of Neuroradiology, 31, 219–225. [DOI] [PMC free article] [PubMed] [Google Scholar]
- Pillai, J. J. , & Mikulis, D. J. (2015). Cerebrovascular reactivity mapping: An evolving standard for clinical functional imaging. American Journal of Neuroradiology, 36, 7–13. [DOI] [PMC free article] [PubMed] [Google Scholar]
- Pillai, J. J. , & Zaca, D. (2011). Relative utility for hemispheric lateralization of different clinical fMRI activation tasks within a comprehensive language paradigm battery in brain tumor patients as assessed by both threshold‐dependent and threshold‐independent analysis methods. NeuroImage, 54(Suppl. 1), S136–S145. [DOI] [PubMed] [Google Scholar]
- Posse, S. , Ackley, E. , Mutihac, R. , Rick, J. , Shane, M. , Murray‐Krezan, C. , … Speck, O. (2012). Enhancement of temporal resolution and BOLD sensitivity in real‐time fMRI using multi‐slab echo‐volumar imaging. NeuroImage, 61, 115–130. [DOI] [PMC free article] [PubMed] [Google Scholar]
- Posse, S. , Ackley, E. , Mutihac, R. , Zhang, T. , Hummatov, R. , Akhtari, M. , … Yonas, H. (2013). High‐speed real‐time resting‐state FMRI using multi‐slab echo‐volumar imaging. Frontiers in Human Neuroscience, 7, 479. [DOI] [PMC free article] [PubMed] [Google Scholar]
- Posse, S. , Binkofski, F. , Schneider, F. , Gembris, D. , Frings, W. , Habel, U. , … Eickermann, T. (2001). A new approach to measure single‐event related brain activity using real‐time fMRI: Feasibility of sensory, motor, and higher cognitive tasks. Human Brain Mapping, 12, 25–41. [DOI] [PMC free article] [PubMed] [Google Scholar]
- Posse, S. , Wiese, S. , Gembris, D. , Mathiak, K. , Kessler, C. , Grosse‐Ruyken, M. L. , … Kiselev, V. G. (1999). Enhancement of BOLD‐contrast sensitivity by single‐shot multi‐echo functional MR imaging. Magnetic Resonance in Medicine, 42, 87–97. [DOI] [PubMed] [Google Scholar]
- Roux, F. E. , Dufor, O. , Giussani, C. , Wamain, Y. , Draper, L. , Longcamp, M. , & Demonet, J. F. (2009). The graphemic/motor frontal area Exner's area revisited. Annals of Neurology, 66, 537–545. [DOI] [PubMed] [Google Scholar]
- Sahib, A. K. , Mathiak, K. , Erb, M. , Elshahabi, A. , Klamer, S. , Scheffler, K. , … Ethofer, T. (2016). Effect of temporal resolution and serial autocorrelations in event‐related functional MRI. Magnetic Resonance in Medicine, 76, 1805–1813. [DOI] [PubMed] [Google Scholar]
- Sair, H. I. , Yahyavi‐Firouz‐Abadi, N. , Calhoun, V. D. , Airan, R. D. , Agarwal, S. , Intrapiromkul, J. , … Pillai, J. J. (2016). Presurgical brain mapping of the language network in patients with brain tumors using resting‐state fMRI: Comparison with task fMRI. Human Brain Mapping, 37, 913–923. [DOI] [PMC free article] [PubMed] [Google Scholar]
- Sanai, N. , Mirzadeh, Z. , & Berger, M. S. (2008). Functional outcome after language mapping for glioma resection. The New England Journal of Medicine, 358, 18–27. [DOI] [PubMed] [Google Scholar]
- Satterthwaite, T. D. , Wolf, D. H. , Loughead, J. , Ruparel, K. , Elliott, M. A. , Hakonarson, H. , … Gur, R. E. (2012). Impact of in‐scanner head motion on multiple measures of functional connectivity: Relevance for studies of neurodevelopment in youth. NeuroImage, 60, 623–632. [DOI] [PMC free article] [PubMed] [Google Scholar]
- Setsompop, K. , Gagoski, B. A. , Polimeni, J. R. , Witzel, T. , Wedeen, V. J. , & Wald, L. L. (2012). Blipped‐controlled aliasing in parallel imaging for simultaneous multislice echo planar imaging with reduced g‐factor penalty. Magnetic Resonance in Medicine, 67, 1210–1224. [DOI] [PMC free article] [PubMed] [Google Scholar]
- Shimony, J. S. , Zhang, D. , Johnston, J. M. , Fox, M. D. , Roy, A. , & Leuthardt, E. C. (2009). Resting‐state spontaneous fluctuations in brain activity: A new paradigm for presurgical planning using fMRI. Academic Radiology, 16, 578–583. [DOI] [PMC free article] [PubMed] [Google Scholar]
- Shiroishi, M. S. , Boxerman, J. L. , & Pope, W. B. (2016). Physiologic MRI for assessment of response to therapy and prognosis in glioblastoma. Neuro‐Oncology, 18, 467–478. [DOI] [PMC free article] [PubMed] [Google Scholar]
- Smith, S. M. , Fox, P. T. , Miller, K. L. , Glahn, D. C. , Fox, P. M. , Mackay, C. E. , … Beckmann, C. F. (2009). Correspondence of the brain's functional architecture during activation and rest. Proceedings of the National Academy of Sciences of the United States of America, 106, 13040–13045. [DOI] [PMC free article] [PubMed] [Google Scholar]
- Smith, S. M. , Miller, K. L. , Moeller, S. , Xu, J. , Auerbach, E. J. , Woolrich, M. W. , … Ugurbil, K. (2012a). Temporally‐independent functional modes of spontaneous brain activity. Proceedings of the National Academy of Sciences, 109(8), 3131–3136. [DOI] [PMC free article] [PubMed] [Google Scholar]
- Spena, G. , Nava, A. , Cassini, F. , Pepoli, A. , Bruno, M. , D'Agata, F. , … Versari, P. (2010). Preoperative and intraoperative brain mapping for the resection of eloquent‐area tumors. A prospective analysis of methodology, correlation, and usefulness based on clinical outcomes. Acta Neurochirurgica, 152, 1835–1846. [DOI] [PubMed] [Google Scholar]
- Stufflebeam, S. M. , Liu, H. , Sepulcre, J. , Tanaka, N. , Buckner, R. L. , & Madsen, J. R. (2011). Localization of focal epileptic discharges using functional connectivity magnetic resonance imaging. Journal of Neurosurgery, 114, 1693–1697. [DOI] [PMC free article] [PubMed] [Google Scholar]
- Suarez, R. O. , Taimouri, V. , Boyer, K. , Vega, C. , Rotenberg, A. , Madsen, J. R. , … Warfield, S. K. (2014). Passive fMRI mapping of language function for pediatric epilepsy surgical planning: Validation using Wada, ECS, and FMAER. Epilepsy Research, 108, 1874–1888. [DOI] [PMC free article] [PubMed] [Google Scholar]
- Tie, Y. , Rigolo, L. , Norton, I. H. , Huang, R. Y. , Wu, W. , Orringer, D. , … Golby, A. J. (2013). Defining language networks from resting‐state fMRI for surgical planning—A feasibility study. Human Brain Mapping, 35, 3683367. [DOI] [PMC free article] [PubMed] [Google Scholar]
- Ulmer, J. L. , Salvan, C. V. , Mueller, W. M. , Krouwer, H. G. , Stroe, G. O. , Aralasmak, A. , & Prost, R. W. (2004). The role of diffusion tensor imaging in establishing the proximity of tumor borders to functional brain systems: Implications for preoperative risk assessments and postoperative outcomes. Technology in Cancer Research & Treatment, 3, 567–576. [DOI] [PubMed] [Google Scholar]
- Vakamudi A. E. K, Trapp C, Posse S. (2015). Automated Subject‐Specific Seed Optimization Method improves Detection of rsfMRI Connectivity. Proc. International Society for Magnetic Resonance in Medicine (ISMRM), Toronto, Canada, 2101.
- Vakamudi G. K., Trapp C, Scantlen G, Posse S. (2017). Resting estate network dynamics using sliding‐window Detrending and meta‐statistics: A new approach for real‐time fMRI. Proc. International Society for Magnetic Resonance in medicine (ISMRM), Honolulu, HI, 5378.
- Vakamudi K., Damaraju, E. , and Posse, S. (2016). Enhanced confound tolerance of resting‐state fMRI: Combining regression with sliding‐window meta‐statistics. Proc. 21st Annual Meeting of the Organization of Human Brain Mapping, Geneva, Switzerland, 4453.
- Vakamudi K., Moeller, S. , Ramanna, S , Yoshimoto, A. , Yacoub, E. , Otazo, R. , Syed, A. , Posse, S. (2018). Enhancing Spatial‐Temporal Resolution in Simultaneous Multi‐Slab Echo Volumar Imaging. Proc. International Society for Magnetic Resonance in Medicine (ISMRM), Paris, France, 4133.
- Van Dijk, K. R. , Sabuncu, M. R. , & Buckner, R. L. (2012). The influence of head motion on intrinsic functional connectivity MRI. NeuroImage, 59, 431–438. [DOI] [PMC free article] [PubMed] [Google Scholar]
- Woolrich, M. W. , Ripley, B. D. , Brady, M. , & Smith, S. M. (2001). Temporal autocorrelation in univariate linear modeling of FMRI data. NeuroImage, 14, 1370–1386. [DOI] [PubMed] [Google Scholar]
- Zahneisen, B. , Grotz, T. , Lee, K. J. , Ohlendorf, S. , Reisert, M. , Zaitsev, M. , & Hennig, J. (2011). Three‐dimensional MR‐encephalography: Fast volumetric brain imaging using rosette trajectories. Magnetic Resonance in Medicine, 65, 1260–1268. [DOI] [PubMed] [Google Scholar]
- Zhang, D. , Johnston, J. M. , Fox, M. D. , Leuthardt, E. C. , Grubb, R. L. , Chicoine, M. R. , … Shimony, J. S. (2009). Preoperative sensorimotor mapping in brain tumor patients using spontaneous fluctuations in neuronal activity imaged with functional magnetic resonance imaging: Initial experience. Neurosurgery, 65, 226–236. [DOI] [PMC free article] [PubMed] [Google Scholar]
- Zhao, X. , Bodurka, J. , Jesmanowicz, A. , & Li, S. J. (2000). B(0)‐fluctuation‐induced temporal variation in EPI image series due to the disturbance of steady‐state free precession. Magnetic Resonance in Medicine, 44, 758–765. [DOI] [PubMed] [Google Scholar]
Associated Data
This section collects any data citations, data availability statements, or supplementary materials included in this article.
Supplementary Materials
Data S1: Supporting Information
Data Availability Statement
The data that support the findings of this study are available from the corresponding author upon reasonable request as permitted by HRRC regulations.