

Abstract
Lightcurves for 36 near-Earth asteroids (NEAs) were obtained at the Center for Solar System Studies-Palmer Divide Station (CS3-PDS) from 2013 September-December.
CCD photometric observations of 36 near-Earth asteroids were made at the Center for Solar System Studies-Palmer Divide Station (CS3-PDS) in 2013 September through December. Table I gives a listing of the telescope/CCD camera combinations used for the observations. All the cameras use CCD chips from the KAF blue-enhanced family and so have essentially the same response. The pixel scales for the combinations range from 1.24–1.60 arcsec/pixel.
Table I.
List of CS3-PDS telescope/CCD camera combinations.
| Desig | Telescope | Camera |
|---|---|---|
| PDS-1-12N | 0.30-m f/6.3 Schmidt-Cass | ST-9XE |
| PDS-1-14S | 0.35-m f/9.1 Schmidt-Cass | FLI-1001E |
| PDS-2-14N | 0.35-m f/9.1 Schmidt-Cass | STL-1001E |
| PDS-2-14S | 0.35-m f/9.1 Schmidt-Cass | STL-1001E |
| PDS-20 | 0.50-m f/8.1 Ritchey-Chretien | FLI-1001E |
All lightcurve observations were made with no filter (a clear filter can result in a 0.1–0.3 magnitude loss) and were guided on a field star, resulting in some cases in a trailed image for the asteroid. The exposure varied depending on the asteroid’s brightness and sky motion.
Measurements were done using MPO Canopus. If necessary, an elliptical aperture with the long axis parallel to the asteroid’s path was used. The Comp Star Selector utility in MPO Canopus finds up to five comparison stars of near solar-color to be used in differential photometry. Catalog magnitudes are usually taken from the MPOSC3 catalog, which is based on the 2MASS catalog (http://www.ipac.caltech.edu/2mass) but with magnitudes converted from J-K to BVRI using formulae developed by Warner (2007). When possible, magnitudes are taken from the APASS catalog (Henden et al., 2009) since these are derived directly from reductions based on Landolt standard fields. Using either catalog, the nightly zero points have been found to be consistent to about ±0.05 magnitude or better, but on occasion are as large as 0.1 mag. This reasonably good consistency is critical to analysis of long period and/or tumbling asteroids. Period analysis is also done using MPO Canopus, which implements the FALC algorithm developed by Harris (Harris et al., 1989).
In the plots below, the “Reduced Magnitude” is Johnson V (or Cousins R) as indicated in the Y-axis title. These are values that have been converted from sky magnitudes to unity distance by applying –5*log (rΔ) to the measured sky magnitudes with r and Δ being, respectively, the Sun-asteroid and Earth-asteroid distances in AU. The magnitudes were normalized to the phase angle given in parentheses, e.g., alpha(6.5°), using G = 0.15, unless otherwise stated. The horizontal axis is the rotational phase and ranges from –0.05 to 1.05.
For the sake of brevity, only some of the previously reported results may be referenced in the discussions on specific asteroids. For a more complete listing, the reader is directed to the asteroid lightcurve database (LCDB; Warner et al. 2009). The on-line version at http://www.minorplanet.info/lightcurvedatabase.html allows direct queries that can be filtered a number of ways and the results saved to a text file. A set of text files of the main LCDB tables, including the references with bibcodes, is also available for download. When possible, researchers are strongly to obtain the original references listed in the LCDB for their work.
Tumbling Asteroids
Some of the objects reported here are confirmed (or suspected) to be in non-principal axis rotation (NPAR), or tumbling. The analysis of the periods (frequencies) involved is beyond the capabilities of the author. In such cases, the data are provided to Petr Pravec, Astronomical Institute, Czech Republic, who has developed specialized analysis tools for such objects. Details behind the analysis as well as a thorough discussion of tumbling asteroids in general are in Pravec et al. (2005). Also included is the PAR rating system, which gives an idea on the likelihood that the asteroid is in an NPAR state. This paper should be required reading for those doing asteroid lightcurve photometry.
Very briefly, the lightcurve of a tumbling asteroid is the sum of the integral multiples of two frequencies, i.e.,
Except in those cases where f1 and f2 represent very short periods (P < 1 h) and there is an extensive data set covering many rotations of both the principal and precession axes, finding a unique solution for f1 and f2 is very difficult, if not impossible. What is often determined is a dominant period (1/f1) with one or more possible solutions for the second period. Also, it is often not possible to determine which of the two periods is due to principal axis rotation and the other due to precession.
Individual Results
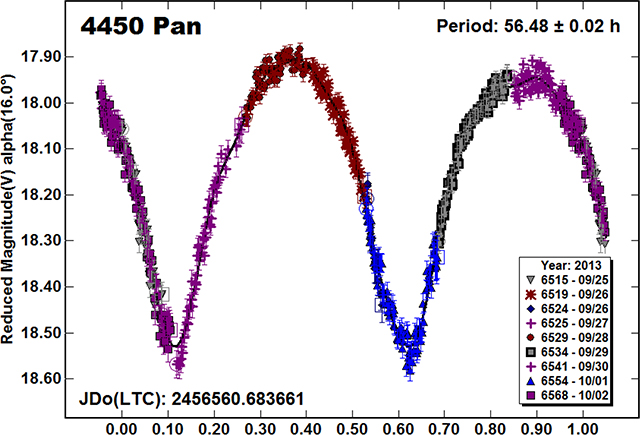
4450 Pan
Pravec et al. (2008) reported a period of 60 hours and that the asteroid probably tumbling (PAR = –1). No signs of tumbling were seen in the data obtained at CS3-PDS in 2013 September, although a more definitive dominant period of 56.48 h was found.
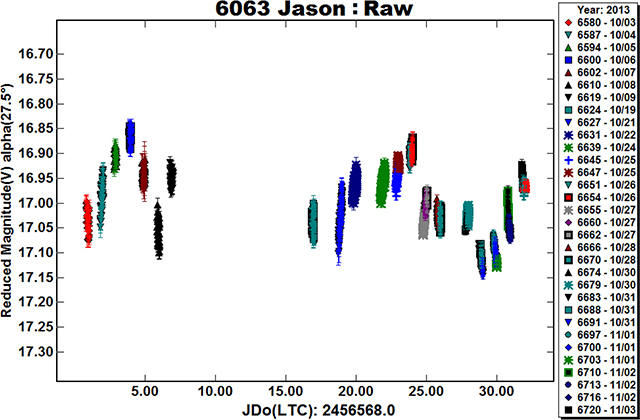
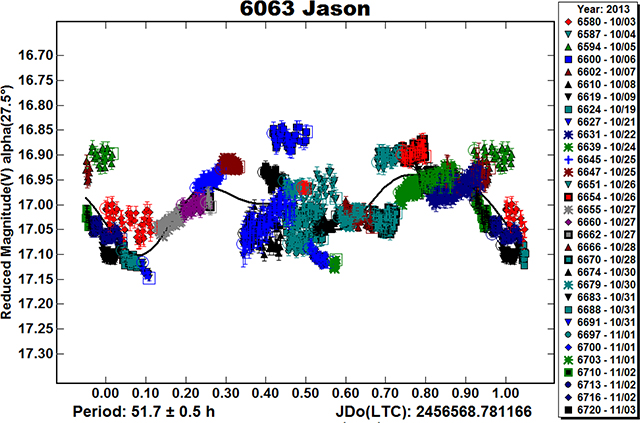
6063 Jason
This NEA appears to be in at least a slightly excited tumbling state. While some of the deviations in zero points in the raw plot of the data (first plot below) might be accounted for by calibration errors, the number and degree of adjustments was too many to exclude the possibility of tumbling. The second plot shows the lightcurve phased to a dominant period of about 52 hours, which was confirmed by Pravec. However a solution for a second period could not be determined before the asteroid faded and moved too far south for additional observations.
(10115) 1992 SK
Pravec et al. (1999) observed this asteroid for an extended time in 1999. Data from early March led a period of 7.328 h and amplitude of 0.72 mag (α = 41.6°). By the middle of March, the period had shortened to 7.31832 h and the amplitude increased to 1.03 mag (α = 69.0°). Polishook (2012) found a period of 7.31 h and amplitude 0.70 mag (α = 73.5°). The 2013 observations at α = 14° showed, not unexpectedly, a lower amplitude of 0.50 mag as well as a period in good agreement with the earlier results.

(17511) 1992 QN
Pravec et al. (1998) reported P = 5.9902 h and A = 1.10 mag; Krugly et al. (2002) found P = 5.99 h and A = 1.1 mag. Analysis of the CS3-PDS data give a similar period with A = 0.79 mag.

(18109) 2000 NG11
Pravec et al. (2000a) reported P = 4.2534 h and A = 1.13 mag (a = 6°). The CS3-PDS data led to P = 4.255 h and A = 0.89 mag (α = 21°). Usually, a larger amplitude is expected at higher phase angles. This could be explained by the fact that the Pravec et al. observations were made when the asteroid presented a more equatorial view than during the 2013 apparition.

(52760) 1998 ML14
Hicks et al. (1998) found P = 14.98 h and A = 0.12 mag. Ostro et al. (2001) reported an effective diameter of about 1 km based on radar observations while Mueller et al. (2011) found D ~ 0.81 km based on IR data. The CS3-PDS data led to P = 14.28 h and A = 0.15. mag.

(53435) 1999 VM40
Pravec et al. (2000a) reported a period centered on 5.189 h using data from mid-January to early February 2000. The amplitude ranged from 0.26 to 0.38 mag over phase angles 1.7–21.5°. The 2013 PDS observations produced P = 5.186 h and A = 0.32 mag at α = 38.8°.

(65733) 1993 PC
The lightcurve for 1993 PC showed significant changes over only a two-week span as the phase angle increased from 12° to 34°. In the early part of 2013 October, the amplitude was 0.73 mag. The period was 4.28 h, although this is based on data from only one night and a minimum of coverage of a second cycle. By 19–25 October, the amplitude had increased to 0.93 mag. and the period decreased to 4.184 h.


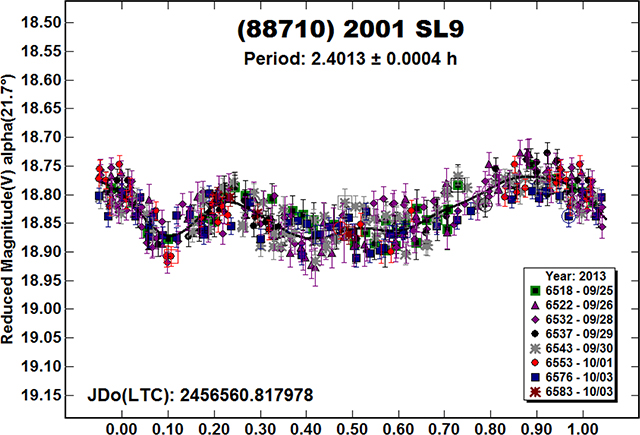
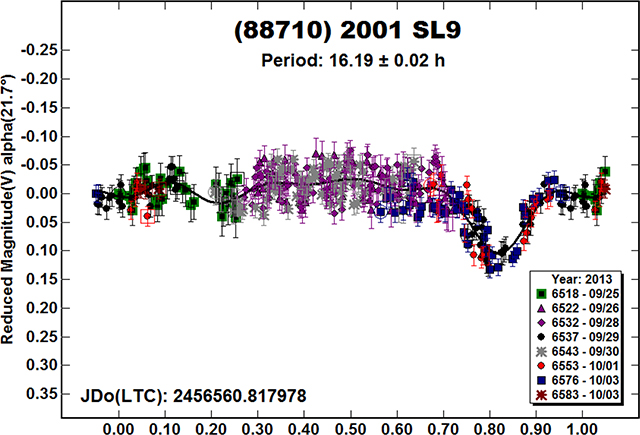
(88710) 2001 SL9
This is a known binary (Pravec et al., 2001; 2006). They reported a primary period of 2.4003 h and an orbital period of 16.40 h for the satellite. Analysis of the 2013 data from CS3-PDS showed a primary period in good agreement with the earlier finding (first plot). Only two well-defined events were observed from 25 September through 3 October, which led to 16.19 h for the orbital period. Furthermore, the secondary event, if one is to be seen at all, occurs about 0.1 cycle too soon (or late). The 2000 apparition seemed to show shadow transits as well as occultation and/or eclipses. It might be possible that the viewing geometry didn’t allow seeing the actual satellite event but did catch a shadow event. This might explain the eccentric placement of the shallow event at 0.2 phase in the second plot below.
(142781) 2002 UM11
The period of 6.8 h reported here is just one of many possible solutions (see the period spectrum). No long term trend was seen in the data, at least within the expected ±0.05 mag spread in night-to-night zero point calibrations.


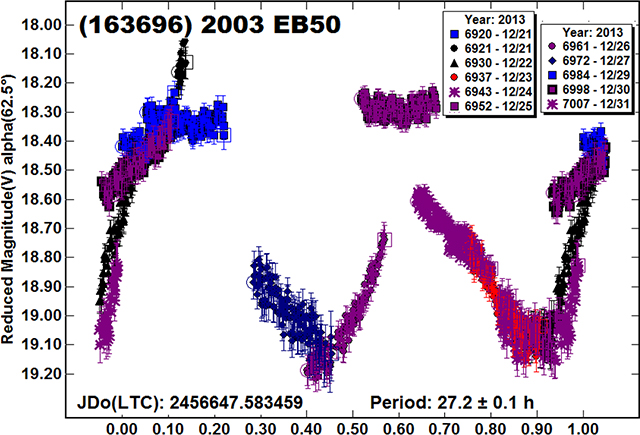
(163696) 2003 EB50
If the data from three nights are excluded and some significant adjustments to zero points are made, a case can be made that this object is in (near) single axis rotation with P = 27.2 h and A = 0.73 mag, meaning that the remaining sessions have the right slope (up or down) for their locations within the modeled lightcurve and don’t “cross swords” at some point. However, included all sessions produces a lightcurve (see below) with two sessions that are essentially flat and “too high” while a third session has a slope that is decidedly different from what it should be for its location. Overall, this should be consider a likely tumbler, with PAR = –1, tending to –2, with no second period guessed at let alone determined.
(249595) 1997 GH28
No previously reported period could be found. The lightcurve is somewhat unusual for the significantly different depths of the minimums.

(25146) 2007 SJ
The period of less than three hours makes this a good candidate for being binary. However, no signs of a satellite were seen during the three nights of observations.

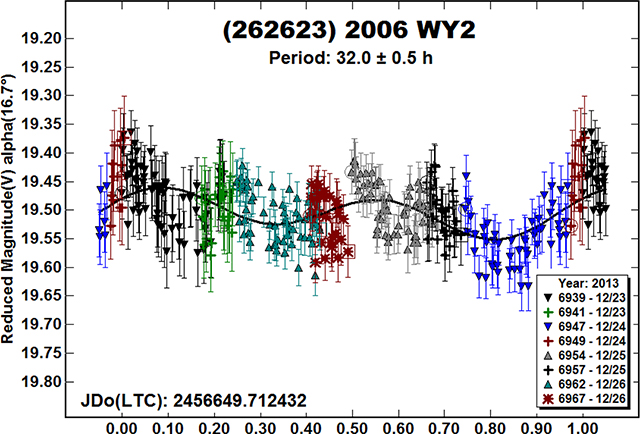
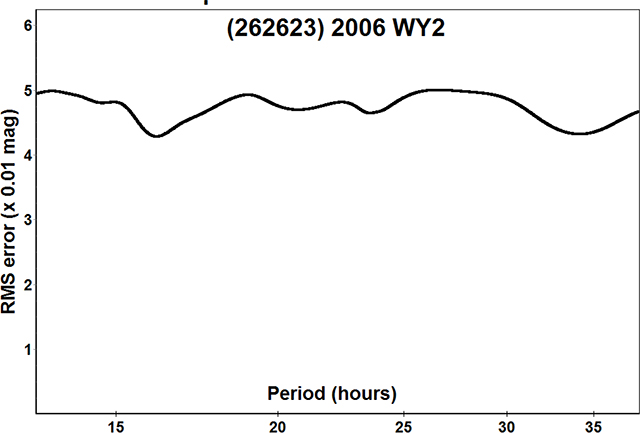
(262623) 2006 WY2
The low amplitude and noise on the order of at least half the amplitude made finding a unique period very difficult. Three plots are presented. The first shows a monomodal lightcurve with P = 16.3 h; the second is a bimodal lightcurve with P = 32.0 h; the final plot shows the period spectrum between 13–36 hours and that neither solution stands out from one another or the general background.

1997 WQ23
No reports of a period were found in the literature. The amplitude of 0.54 mag at the relatively low phase angle of 31° makes a bimodal solution almost certain.

2003 WX25
There were no prior entries in the LCDB (Warner et al., 2009) for this NEA. The period spectrum (not shown) showed a strong preference for the bimodal solution of a monomodal lightcurve with half the period.

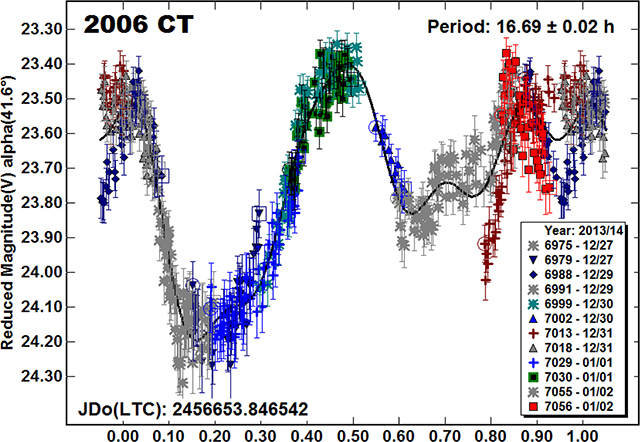
2006 CT
This asteroid was observed to assist radar observations made about the same time. The lightcurve shows a very unusual shape, including an almost flat bottom at the deeper minimum. There are also some unexplained “events” (attenuations) that could not be removed with simple subtractive dual-period analysis. The radar analysis is in progress and may help provide insights into the true nature of the asteroid.
2006 HU30
This NEA presents a conundrum. The raw data (first plot) shows a definite overall trend indicating a very long period (about 800 h; third plot). If this trend is subtracted, the result is a low amplitude lightcurve with a period of either 24 or 48 hours (second plot). This is suspicious since it coincides with an integral multiple of the interval between observing sessions.
It’s possible the shorter period is due to systematic effects where the data trend up or down over the course of a night’s observations. To test this, the images were re-measured using a star near the middle of the average field. That star showed no trend over the several hours of a night’s observations. Flat fields were used in all cases and random checks of sky background levels in images with the flat field applied showed a 1% variation or less. Thus, the asteroid traveling across the field would not appear to have caused a constant trend. If anything, it would have reached a minimum or maximum when nearing field center.
For now, the “primary” period is assumed to be on the order of 800 hours and the “secondary” period is unexplained. If there is a satellite, the numbers would indicate a very long orbital period and the odds of seeing mutual events to be exceedingly small.


2010 SL13
There were no entries in the LCDB for this asteroid. The asymmetry of the lightcurve favors a bimodal solution.

2010 CL19
This appears to be the first reported period for 2010 CL19.

2010 XZ67
The data set was too sparse (too short a total time span) for Pravec to determine if this was a tumbler or not. Removing some sessions does allow finding a period of 15.05 h (second plot), which also seems to reveal itself when using all data (first plot).


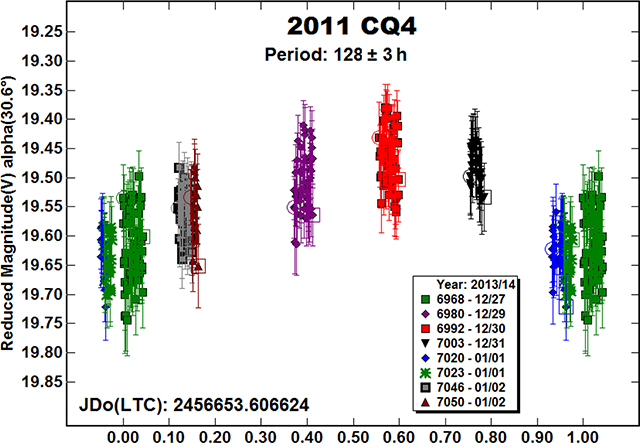
2011 CQ4
The frequent problem with observing NEAs with backyard telescopes is that the asteroid does not remain bright enough long enough for complete analysis. This is especially true if there are signs of tumbling or, in this case, a period on the order of a few hundred hours. The plot shows the data phased to P = 128 h when assuming a monomodal solution. Since the amplitude is 0.19 mag at α = 31°, it is probably safe to assume that A > 0.2 mag at α(0°). This starts to favor a bimodal solution with a period of about 255 hours.
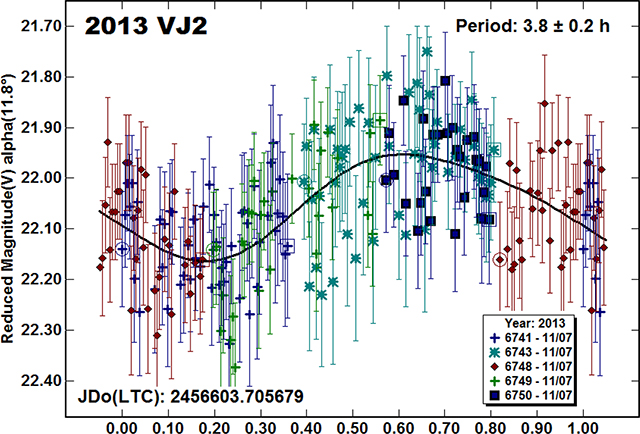
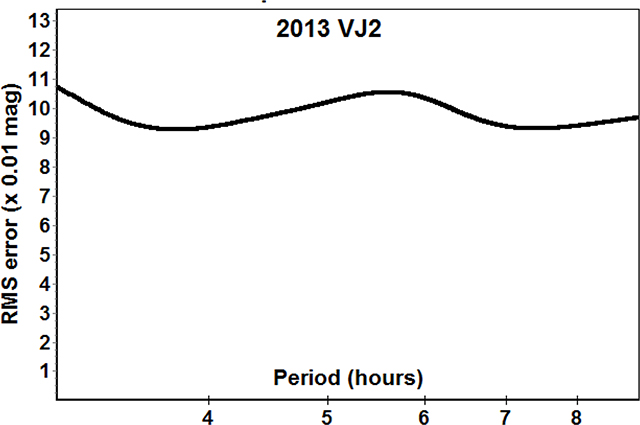
2013 VJ2
The period spectrum (third plot) covering 2–10 hours shows that no one period dominates over any other or even the background. The first two plots show the data phased to periods of 3.8 h (monomodal) and 7.6 h (bimodal). It seems likely that these are valid solutions, i.e., not picked out of the noise, but neither can be formally excluded.

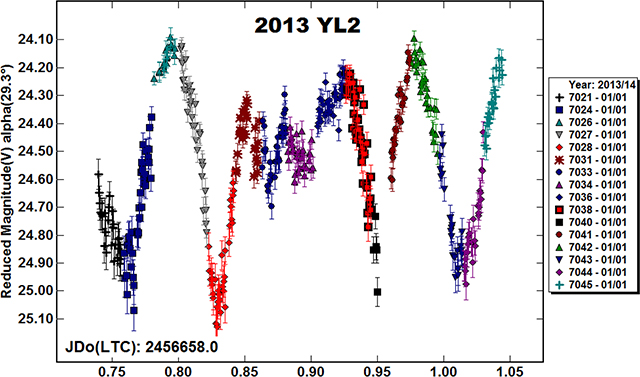
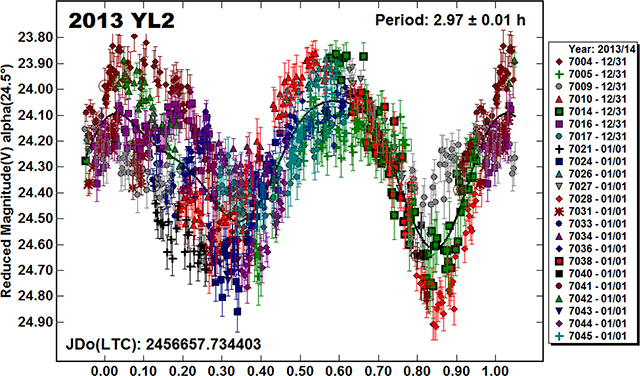
2013 YL2
The first plot shows the raw data from one of two nights (2014 Jan 1). Given the large amplitude and phase angle, there is no physical shape that can produce this lightcurve assuming single axis rotation (see Harris et al., 2014). Therefore, the object is almost certainly tumbling. Analysis by Pravec found the dominant period of about 2.97 h (second and third plots) but the second period could not be uniquely identified. One possible solution was 2.32 h, which is about 0.03 h longer that one of the minor minimums in the period spectrum.

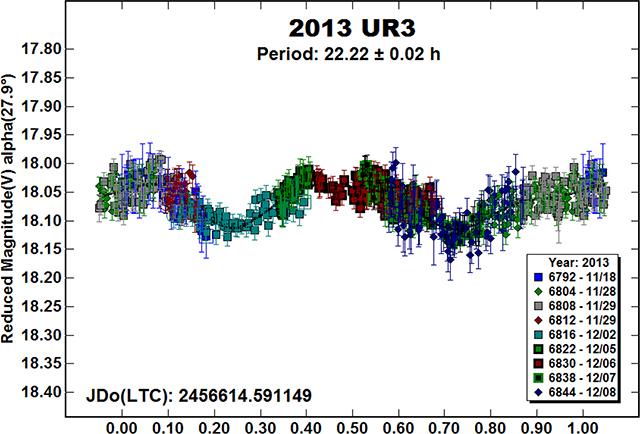
2013 UR3
Neither a bimodal solution of P = 22.22 h nor a monomodal solution of P = 11.08 h can be formally excluded. A feature near the second minimum in the 22-hour solution does tend to favor it over the shorter period.

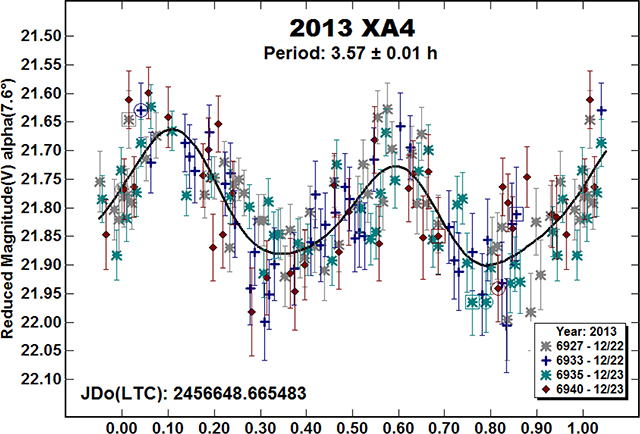
2013 XA4
The estimated diameter for this NEA is 150 meters. This makes it possible that it a super-fast rotator, i.e., one with P < 2 h. The period spectrum (first plot) shows that P ~ 1.8 h is possible, being only slightly less likely that the bimodal solution at 3.57 h. There appears to be enough asymmetry in the bimodal plot to make the longer period more likely, although the shorter period cannot be formally excluded.

2013 UH5
There were no previous entries in the LCDB.

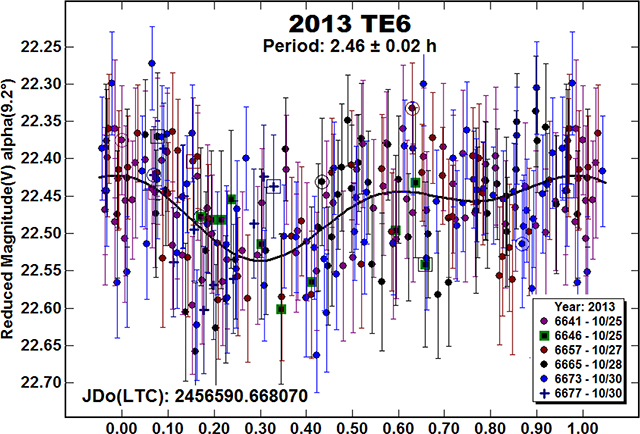
2013 TE6
Given the high noise and low amplitude, the solution of P = 2.46 h may just be the result of Fourier analysis locking onto noise. A search up to 6 hours actually favors a period of 4.96 h. Neither can be formally excluded but it’s probably better to say that neither should be formally included.
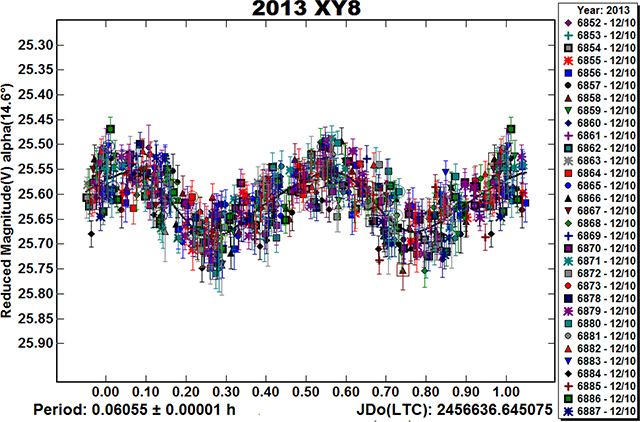
2013 XY8
The two plots (first, 2013 Dec 10; second, Dec 11) show the dramatic difference that can occur in a lightcurve with changing phase angle. The plot from Dec 10 shows an amplitude of 0.13 mag. The plot from Dec 11, with the same vertical scale, has an amplitude of 0.47 mag. Short exposures (15 s) were used to minimize trailing and to avoid “smearing” the data such that the true rotation period could not be found (see the discussion in Pravec et al., 2000b).

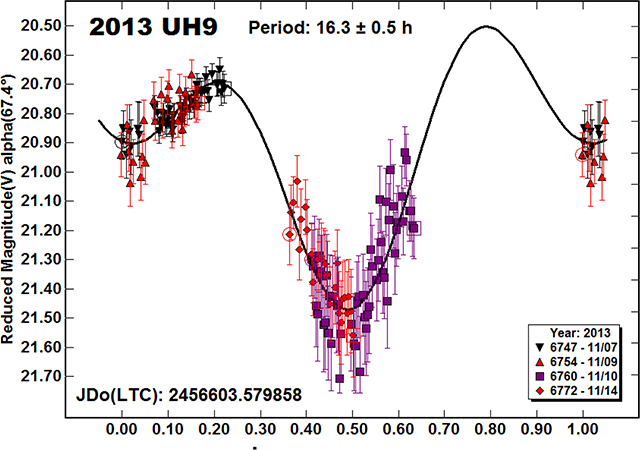
2013 UH9
A half-period analysis led to the final result of 16.3 h.
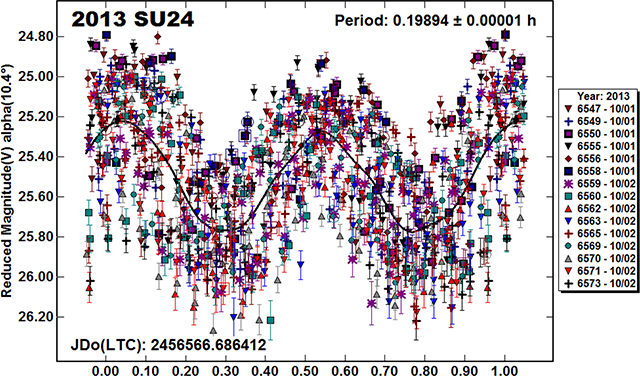
2013 SU24
This was an unusual case where there were sufficient data to find the two periods of a tumbling asteroid after only two nights of observations. The period spectrum shows two distinct pairs, one set being the half period of the other. Of interest is that the lesser member of each pair is also well-defined versus the background and that is not harmonically related to the other member. This is not often seen but, as it turned out, the “secondary” solution in the set was near the second period found by Pravec in his analysis.
The second plot shows all data phased to the dominant bimodal solution of about 0.2334 hours (14.004 min). The third and fourth plots show the data forced to the two periods found by Pravec, 0.23335 h and 0.19894 h (14.001 m and 11.964 min). While these show the two periods fairly well, the better plots are like those shown in Pravec et al. (2005).


2013 SW24
There were no previous entries in the LCDB for this asteroid.

2013 SC25
Fortunately, the amplitude was large enough and the nights long enough to overcome the period of the asteroid being close to commensurate with an Earth day.

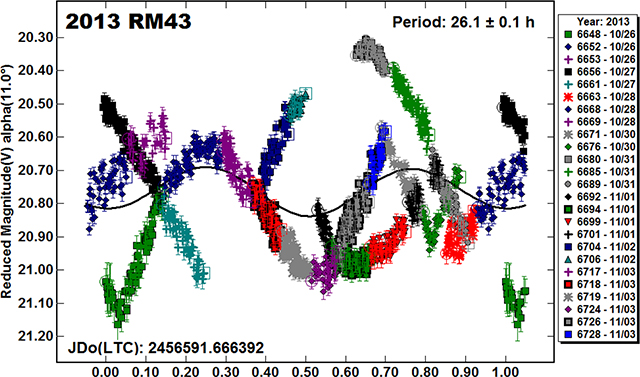
2013 RM43
The two plots show the data phased to the periods found by Pravec. The longer period, 32.6 h, is the more dominant. The second period, 26.1 hours, is less certain and may be an integral multiple of the true frequency (1/P). Pravec rates this as PAR = –2, with a slight tendency to –3.

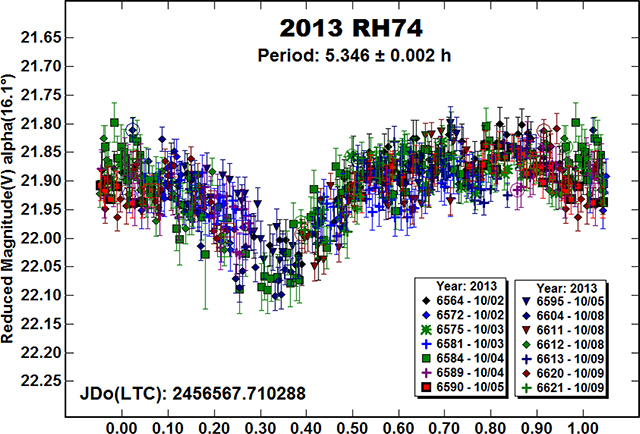
2013 RH74
Hicks et al. (2013) reported P = 5.38 h and A = 0.20 based on observations around 2013 Oct 15. The CS3-PDS data obtained on Oct 2–9 lead to a solution of P = 5.346 h and A = 0.21. However, a double period of 10.692 h cannot be formally excluded.

2013 TB80
A scan of periods ranging from 1 to 10 hours found a sharp minimum at about 2.6 hours but a number of other longer periods as well, many harmonically related to 2.6 h. Assuming that the solution of 2.632 h is correct, the phase angle of 35° and low amplitude may help explain the asymmetry of the lightcurve, where the maximums are about 0.7 rotation phase apart.


Table II.
Observing circumstances.
| Number | Name | 2013 mm/dd | Pts | Phase | LPAB | BPAB | Period | P.E. | Amp | A.E. |
|---|---|---|---|---|---|---|---|---|---|---|
| 4450 | Pan | 09/25–10/01 | 580 | 16.0,10.9 | 12 | 10 | 56.48 | 0.02 | 0.64 | 0.02 |
| 6063 | Jason | 10/03–11/03 | 1887 | 27.5,25.2,36.5 | 46 | −10 | 51.7 | 0.5 | 0.11 | 0.02 |
| 10115 | 1992 SK | 11/03–11/06 | 168 | 12.9,14.2 | 36 | 14 | 7.323 | 0.005 | 0.50 | 0.02 |
| 17511 | 1992 QN | 11/01–11/03 | 202 | 12.4,13.8 | 30 | 11 | 5.985 | 0.005 | 0.79 | 0.03 |
| 18109 | 2000 NG11 | 12/24–12/26 | 209 | 21.6,20.2 | 119 | 1 | 4.255 | 0.005 | 0.89 | 0.03 |
| 52760 | 1998 ML14 | 12/05–12/15 | 210 | 23.0,12.4 | 95 | 5 | 14.28 | 0.01 | 0.15 | 0.02 |
| 53435 | 1999 VM40 | 12/09–12/13 | 240 | 39.7,37.7 | 115 | 20 | 5.186 | 0.002 | 0.32 | 0.02 |
| 65733 | 1993 PC | 10/06–10/06 | 49 | 12.7,12.7 | 3 | 5 | 4.28 | 0.03 | 0.73 | 0.02 |
| 65733 | 1993 PC | 10/19–10/25 | 126 | 30.8,39.0 | 120 | 6 | 4.184 | 0.001 | 0.97 | 0.03 |
| 88710 | 2001 SL9 | 09/25–10/03 | 368 | 21.7,14.5 | 13 | 14 | 2.4013 | 0.0004 | 0.12 | 0.02 |
| 142781 | 2002 UM11 | 10/26–10/30 | 294 | 23.1,19.8 | 42 | 19 | 6.81 | 0.03 | 0.03 | 0.01 |
| 163696 | 2003 EB50 | 12/21–12/31 | 1088 | 62.4,54.5 | 44 | 8 | 27.2 | 0.1 | 0.73 | 0.03 |
| 249595 | 1997 GH28 | 12/27–01/01 | 290 | 37.1,35.0 | 126 | 15 | 19.74 | 0.05 | 1.20 | 0.03 |
| 251346 | 2007 SJ | 11/03–11/06 | 268 | 21.6,23.3 | 38 | 19 | 2.718 | 0.002 | 0.14 | 0.02 |
| 262623 | 2006 WY2 | 12/23–12/26 | 329 | 16.7,11.8 | 104 | −3 | 16.3 | 0.2 | 0.14 | 0.02 |
| 1997 WQ23 | 11/28–11/29 | 303 | 29.9,29.3 | 47 | 1 | 14.6 | 0.1 | 0.54 | 0.03 | |
| 2003 WX25 | 10/28–10/31 | 257 | 9.4,6.8 | 43 | −1 | 5.118 | 0.005 | 0.22 | 0.02 | |
| 2006 CT | 12/27–01/02 | 457 | 41.7,26.4 | 118 | 1 | 16.69 | 0.02 | 0.80 | 0.03 | |
| 2006 HU30 | 11/05–11/17 | 428 | 16.5,11.7,15.3 | 53 | 7 | 47.6 | 0.3 | 0.20 | 0.02 | |
| 2010 SL13 | 12/11–12/15 | 130 | 31.1,30.5 | 102 | −9 | 7.79 | 0.02 | 0.20 | 0.02 | |
| 2010 CL19 | 12/05–12/08 | 489 | 47.0,42.1 | 45 | −2 | 3.1597 | 0.0005 | 0.39 | 0.03 | |
| 2010 XZ67 | 12/26–01/01 | 949 | 26.7,8.1 | 91 | 6 | 15.05 | 0.02 | 0.24 | 0.05 | |
| 2011 CQ4 | 12/27–01/02 | 304 | 30.7,38.6 | 68 | −1 | 128. | 3. | 0.19 | 0.02 | |
| 2013 VJ2 | 11/07–11/07 | 208 | 11.7,11.7 | 52 | −1 | 3.8 | 0.2 | 0.22 | 0.03 | |
| 2013 YL2 | 01/01–01/01 | 962 | 30.0,30.0 | 114 | −8 | 2.97 | 0.01 | 0.96 | 0.05 | |
| 2013 UR3 | 11/18–12/08 | 565 | 27.9,38.4 | 40 | 4 | 11.08 | 0.01 | 0.08 | 0.01 | |
| 2013 XA4 | 12/21–12/23 | 206 | 7.0,8.5 | 87 | 4 | 3.57 | 0.05 | 0.15 | 0.03 | |
| 2013 UH5 | 10/31–11/02 | 264 | 8.6,6.3,8.4 | 42 | 0 | 2.69 | 0.02 | 0.18 | 0.03 | |
| 2013 TE6 | 10/25–10/30 | 239 | 9.1,6.2 | 38 | 4 | 2.46 | 0.02 | 0.12 | 0.02 | |
| 2013 XY8 | 12/10–12/10 | 553 | 12.4,12.4 | 75 | −6 | 0.06055 | 0.00001 | 0.13 | 0.01 | |
| 2013 XY8 | 12/11–12/11 | 188 | 31.2,31.2 | 94 | −5 | 0.06054 | 0.00003 | 0.47 | 0.03 | |
| 2013 UH9 | 11/07–11/14 | 153 | 67.4,69.1 | 93 | 5 | 16.3 | 0.5 | 0.80 | 0.05 | |
| 2013 SU24 | 10/01–10/02 | 876 | 9.0,2.3 | 7 | −2 | 0.23335 | 0.0001 | 0.63 | 0.10 | |
| 2013 SW24 | 10/01–10/02 | 234 | 19.9,19.3 | 3 | 11 | 7.09 | 0.02 | 0.18 | 0.02 | |
| 2013 SC25 | 10/31–11/02 | 182 | 30.0,31.6 | 42 | 23 | 12.96 | 0.02 | 0.72 | 0.03 | |
| 2013 RM43 | 10/26–11/03 | 1275 | 11.1,31.1 | 43 | 9 | 32.6 | 0.1 | 0.75 | 0.05 | |
| 2013 RH74 | 10/02–10/09 | 570 | 16.2,23.5 | 23 | 4 | 5.346 | 0.005 | 0.21 | 0.02 | |
| 2013 TB80 | 12/05–12/09 | 220 | 36.7,38.4 | 40 | 0 | 2.63 | 0.01 | 0.09 | 0.01 |
The phase angle (α) is given at the start and end of each date range, unless it reached a minimum, which is then the second of three values. If a single value is given, the phase angle did not change significantly and the average value is given. LPAB and BPAB are each the average phase angle bisector longitude and latitude, unless two values are given (first/last date in range).
Acknowledgements
Thanks to Dr. Petr Pravec, Astronomical Institute, Czech Republic, for his analysis of the data for the tumbling asteroids reported in this paper.
Funding for PDS observations, analysis, and publication was provided by NASA grant NNX13AP56G. Work on the asteroid lightcurve database (LCDB) was also funded in part by National Science Foundation Grant AST-1210099.
This research was made possible through the use of the AAVSO Photometric All-Sky Survey (APASS), funded by the Robert Martin Ayers Sciences Fund.
References
- Harris AW, Young JW, Bowell E, Martin LJ, Millis RL, Poutanen M, Scaltriti F, Zappala V, Schober HJ, Debehogne H, Zeigler KW (1989). “Photoelectric Observations of Asteroids 3, 24, 60, 261, and 863.” Icarus 77, 171–186. [Google Scholar]
- Harris AW, Pravec P, Galad A, Skiff BA, Warner BD, Vilagi J, Gajdos S, Carbognani A,Hornoch K, Kusnirak P, Cooney WR, Gross J, Terrell D, Higgins D, Bowell E, Koehn BW (2014). “On the maximum amplitude of harmonics on an asteroid lightcurve.” Icarus, submitted. [Google Scholar]
- Henden AA, Terrell D, Levine SE, Templeton M, Smith TC, Welch DL (2009). http://www.aavso.org/apass
- Hicks M, Weissman P, Rabinowitz DL, Chamberlin AB, Buratti BJ, Lee CO (1998). “Close Encounters: Observations of the Earth-crossing Asteroids 1998 KY26 and 1998 ML14.” B.A.A.S. 30, 1029. [Google Scholar]
- Hicks M, Ebelhar (2013). Astronomer’s Telegram 5526. http://www.astronomerstelegram.org
- Krugly Yu.N., Belskaya IN, Shevchenko VG, Chiorny VG, Velichko FP, Mottola S, Erikson A, Hahn G, Nathues A, Neukum G, Gaftonyuk NM, Dotto E (2002). “The Near-Earth Objects Follow-up Program. IV. CCD Photometry in 1996–1999.” Icarus 158, 294–304. [Google Scholar]
- Mueller M, Delbo M, Hora JL, Trilling DE, Bhattacharya B, Bottke WF, Chesley S, Emery JP, Fazio G, Harris AW, Mainzer A, Mommert M, Penprase B, Smith HA, Spahr TB, Stansberry JA, Thomas CA (2011). “Explore NEOs. III. Physical Characterization of 65 Potential Spacecraft Target Asteroids.” Astron. J. 141, A109. [Google Scholar]
- Ostro SJ, Hudson RS, Benner LAM, Nolan MC, Giorgini JD, Scheeres DJ, Jurgens RF, Rose R (2001). “Radar observations of asteroid 1998 ML14.” Meteoritics and Planetary Sci. 36, 1225–1236. [Google Scholar]
- Polishook D (2012). “Lightcurves and Spin Periods of Near-Earth Asteroids, The Wise Observatory, 2005 – 2010.” Minor Planet Bul. 39, 187–192. [Google Scholar]
- Pravec P, Wolf M, Sarounova L (1998). “Lightcurves of 26 Near-Earth Asteroids.” Icarus 136, 124–153. [Google Scholar]
- Pravec P,Wolf M, Sarounova L (1999, 2000a, 2008). http://www.asu.cas.cz/~ppravec/neo.htm
- Pravec P, Hergenrother C, Whiteley R, Sarounova L, Kusnirak P (2000b). “Fast Rotating Asteroids 1999 TY2, 1999 SF10, and 1998 WB2.” Icarus 147, 477–486. [Google Scholar]
- Pravec P, Kusnirak P, Warner B (2001). IAUC 7742. [Google Scholar]
- Pravec P, Scheirich P, Kušnirák P, Šarounová L, Mottola S, Hahn G, Brown P, Esquerdo G, Kaiser N, Krzeminski Z, and 47 co-authors (2006). “Photometric survey of binary near-Earth asteroids.” Icarus 181, 63–93. [Google Scholar]
- Pravec P, Harris AW, Scheirich P, Kušnirák P, Šarounová L, Hergenrother CW, Mottola S, Hicks MD, Masi G, Krugly Yu.N., Shevchenko VG, Nolan MC, Howell ES, Kaasalainen M, Galád A, Brown P, Degraff DR, Lambert JV, Cooney WR, Foglia S (2005b). “Tumbling asteroids.” Icarus 173, 108–131. [Google Scholar]
- Warner BD (2007). “Initial Results of a Dedicated H-G Program.” Minor Planet Bul. 34, 113–119. [Google Scholar]
- Warner BD, Harris AW, Pravec P (2009). “The Asteroid Lightcurve Database.” Icarus 202, 134–146. [Google Scholar]