Abstract
A powerful means to understand the cellular function of corrupt oncogenic signaling programs requires perturbing the system and monitoring the downstream consequences. Here, using a unique pair of non-small cell lung cancer (NSCLC)/normal lung epithelial patient-derived cell lines (HCC4017/HBEC30KT), we systematically inter-rogated the remodeling of the NSCLC proteome upon treatment with 35 chemical perturbagens targeting a diverse array of mechanistic classes. HCC4017 and HBEC30KT cells differ significantly in their proteomic response to the same compound treatment. Using protein covariance analyses, we identified a large number of functional protein networks. For example, we found that a poorly studied protein, C5orf22, is a novel component of the WBP11/PQBP1 splicing complex. Depletion of C5orf22 leads to the aberrant splicing and expression of genes involved in cell growth and immunomodulation. In summary, we show that by systematically measuring the tumor adaptive responses at the proteomic level, an understanding could be generated that provides critical circuit-level biological insights for these pharmacologic perturbagens.
Graphical Abstract
Recent large-scale genomic studies have identified both genetic and epigenetic alternations that likely drive the tumorigenesis of various types of human malignancies, including non-small cell lung cancer (NSCLC).1–4 The identification of these oncogenic drivers and the “attraction” of tumors to them provide a strong rationale to develop agents that target these unique tumor-acquired vulnerabilities.5–7 Although many cancer patients with actionable mutations (e.g., EGFR mutations for NSCLC patients) initially respond to these targeted therapies, resistance almost invariably occurs, resulting in disease progression.7–10 A number of these “acquired resistance” mechanisms have been identified, including the development of gatekeeper mutations (e.g., EGFRT790M)11,12 and expression of a splicing isoform of the drug target (e.g., p61BRAFV600E in melanoma patients).13 In addition to genomic resistance mechanisms, studies continue to increase in prevalence in regard to tumor cells that respond acutely to drug treatment by reshaping their signaling network, which likely allows the tumor cells to adapt to the inhibition of these key survival pathways (termed as “adaptive response”).14,15 However, the exact nature of many of these compensatory mechanisms, in particular those involved in proteome changes, is still poorly understood.
Beyond the context of compensatory mechanisms in human malignancies, systematic perturbation experiments could be performed, and by monitoring the downstream adaptive responses, an understanding could be generated that provides critical mechanistic and circuit-level biological insights for these pharmacologic perturbagens. Golub and colleagues have implemented such an “inference of function” concept in the connectivity map (cMap), where they treated cells with chemical compounds and then performed mRNA expression profiling.16,17 The expression signatures derived from these experiments find connections among genes, drugs, and disease states by virtue of common gene expression changes. These data then inform previously unrecognized connections between two biological pathways that regulate common signaling outputs. Furthermore, by establishing the connection between two chemical compounds of different structures but similar biological function, this approach represents a powerful means to glean novel mechanism of action (MoA) insights for small molecule chemical compounds.18
Although gene expression profiling remains a dominant method for characterizing cellular responses to perturbations, mRNA levels alone do not fully recapitulate these adaptive changes. In this context, the incorporation of proteomic expression signatures could serve as an independent dimension of the connectivity map.19,20 Indeed, recent studies have shown that a reduced representation of phosphoproteomic and epigenetic signatures could serve as an independent dimension of the connectivity map to generate previously unexpected associations between drugs and between biological pathways.21
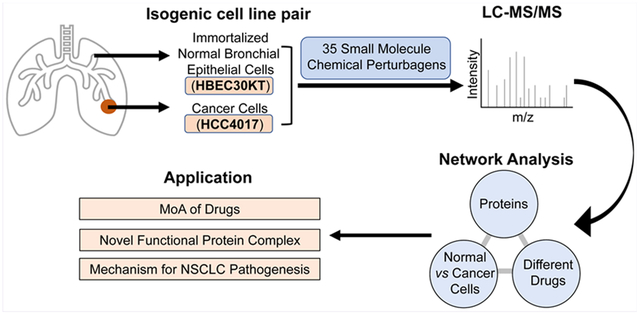
Here, we set out to characterize, in an unbiased manner, the proteomic aspect of the tumor adaptive response to various targeted- and chemo-therapeutic agents. We employed a unique isogenic patient-derived cell line system where HCC4017 lung adenocarcinoma cells were established from a 62-year-old patient with NSCLC.22 In addition, the isogenic pair contains HBEC30KT, which is an immortalized normal (benign) bronchial epithelial cell line that was established from the same patient.22,23 By systemically applying a panel of 35 pharmacological perturbagens, we sought to monitor how the global proteome of a tumor cell and its normal counterpart is remodeled in response to these compounds, and in doing so, we generate a reference resource of comprehensive protein expression signatures associated with these conditions. We found that compounds that inhibit various targets in the same pathway led to both overlapping and distinct changes in the protein expression signatures, providing critical insights for the potential MoAs of these compounds. Cross-reference analyses between the two data sets led to the identification of a number of molecular pathways that differentially responded to the drugs between the two isogenic lines. Furthermore, we performed protein co-expression analyses and identified a large number of protein covariance networks that showed coordinated regulations in specific drug treatment conditions. We experimentally validated these functional protein-protein interactions and showed that such analyses provide a powerful means to inform novel connections among functional protein clusters.
RESULTS
Selection of Cell Lines and Compounds.
We sought to generate a proteomic connectivity map (p-cMap) initially for NSCLC (Figure 1A). These experiments were performed in a unique pair of isogenic cell lines derived from a NSCLC patient.22 HCC4017 was established from this patient’s tumor and revealed mutations in TP53 and KRAS (KRASG12V). Furthermore, this cell line has a defective AMPK response, and therefore it is functionally equivalent to an LKB1-mutated status.22 HBEC30KT was established from the same patient and was immortalized with CDK4 and hTERT. This cell line is characterized by a number of properties consistent with untransformed epithelial cells, including the expression of epithelial markers and an inability to form tumors in vivo.22
Figure 1.
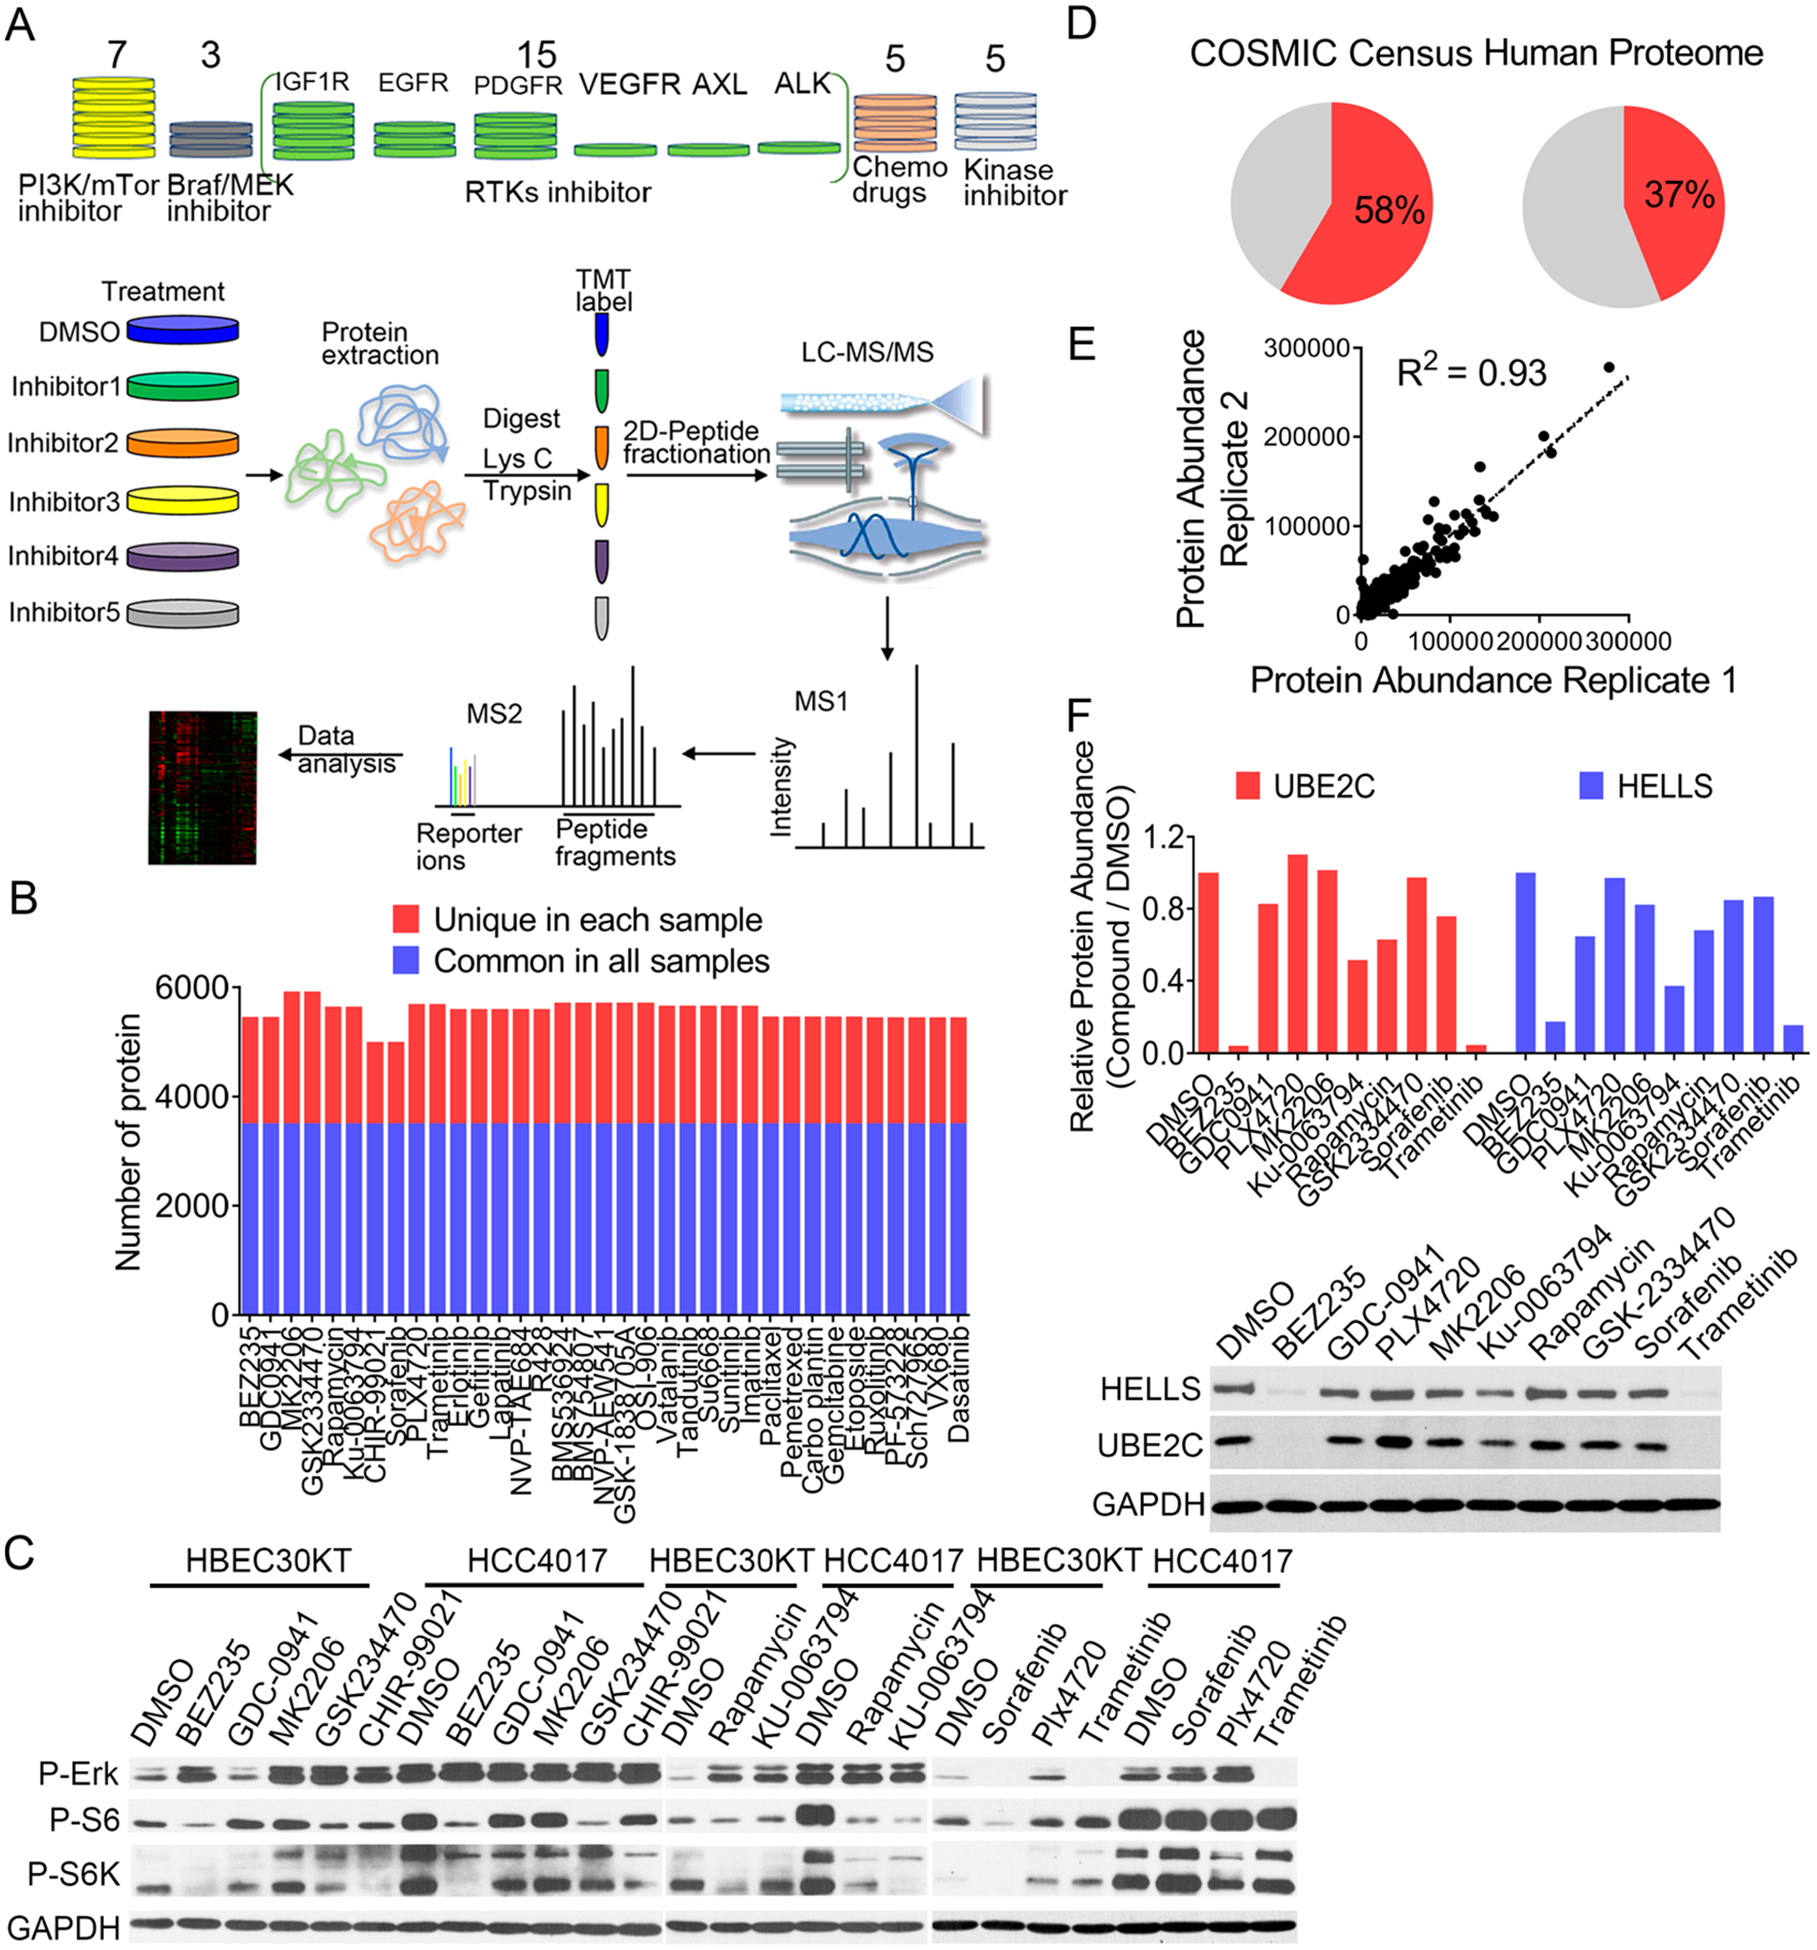
Proteomic analysis of HCC4017 cells treated with 35 small molecule chemical probes. (A) Overview of the workflow of the quantitative proteomic experiments. (B) Number of proteins commonly (blue bars) and uniquely (red bars) identified in all TMT sets for HCC4017 cells. (C) Immunoblots of phosphorylated forms of S6, S6K, and ERK in HBEC30KT and HCC4017 cells upon the treatment with the indicated compounds. (D) Percentage of the identified proteins that were found in the COSMIC Census and in the Uniprot/Swiss-Prot database. (E) Quantitative reproducibility of the TMT experiments. (F) TMT results and immunoblots of UBE2C and HELLS levels in HCC4017 cells upon the treatment of the indicated compounds.
Consistent with its mutation status (e.g., KRASG12V and LKB1/AMPK loss-of-function), HCC4017 cells had greatly elevated PI3K-AKT-mTORC1 (as shown by downstream target pS6K and pS6 levels) and MAPK-ERK (as shown by downstream target pERK levels) signaling, compared to HBEC30KT cells (Figure 1C). We then assembled a panel of 35 compounds that target the following pathways: (1) PI3K-AKT-mTORC1, (2) RAF-MEK-ERK, (3) RTKs, and (4) additional kinases (e.g., JAK1/2, FAK, CDK, Aurora, and Src). In addition, we also incorporated in this panel a series of commonly used chemotherapeutic agents, including paclitaxel, pemetrexed, carboplatin, gemcitabine, and etoposide (Table S1).
We performed molecular and phenotypic characterization to evaluate how HBEC30KT and HCC4017 cells respond to these compounds. The treatment of these cells with several compounds targeting PI3K-AKT-mTORC1 and RAF-MEK-ERK using the above-mentioned conditions led to potent inhibition of well-established downstream effector proteins. For example, pS6K and pS6 levels (in particular in HCC4017 cells) were dramatically reduced after the treatment of an mTORC1 inhibitor (rapamycin), mTORC1/mTORC2 inhibitor (KU-0063794), or PI3K/mTOR inhibitor (NVP-BEZ235) (Figure 1C). Similarly, the treatment of HBEC30KT and HCC4017 cells with a MEK inhibitor (i.e., trametinib) resulted in robust inhibition of its downstream signaling, as shown by the loss of pERK. In contrast, PLX4720 (a BRAF inhibitor) treatment resulted in ERK activation in both HBEC30KT and HCC4017 cells, which is consistent with the previous report that this compound induces transactivation of RAF dimers and paradoxical activation in cells with wild type BRAF24 (Figure 1C).
Finally, we also evaluated the sensitivity of HCC4017 cells to the 35 compounds and determined their corresponding IC50 values (Table S1). These cells are sensitive (IC50 < 1 μM) to the PI3K/mTOR inhibitors (e.g., NVP-BEZ235, GDC-0941, rapamycin, and KU-0063794), MEK inhibitor (trametinib), CDK inhibitor (SCH727965), and several chemotherapeutic drugs (paclitaxel, carboplatin, and pemetrexed). HCC4017 cells, however, are largely resistant to RTK inhibitors due to their activating KRAS mutation and the defective LKB1/AMPK pathway.22
Compound-Centric Analysis of the Proteomic Response to Chemical Perturbagens.
We employed an isobaric labeling strategy (tandem mass tag, TMT) to characterize the proteomic-level changes after treating HCC4017 cells individually with the 35 compounds (Figure 1A). In each TMT group, we were able to identify and quantify more than 5000 proteins (Figure 1B). The identified proteins represented 58% of the genes annotated in the Catalog of Somatic Mutations in Cancer (COSMIC) and 37% of the genes included in the Uniprot database (Figure 1D). We achieved excellent quantitative reproducibility between the two biological replicate TMT analyses (HCC4017 treated with DMSO control) (Figure 1E). To demonstrate the validity of our quantitative proteomic results, we randomly chose two proteins, UBE2C and HELLS, where similar results were obtained between the TMT and immunoblotting experiments (Figure 1F).
We reasoned that the treatment of cytotoxic compounds would likely induce a more dramatic perturbation of the proteome. We calculated, for each compound, the number of proteins that was either up- or downregulated by 2-fold. Indeed, the treatment of HCC4017 cells with either NVP-BEZ235 or trametinib resulted in a large number of differentially expressed proteins (e.g., 120 and 209 downregulated proteins for NVP-BEZ235 and trametinib, respectively). The treatment with a number of other compounds, including the CDK inhibitor (SCH727965), also led to a greatly perturbed proteome in HCC4017 cells (Figure 2A). In order to further quantify the degree of proteome dispersion, we determined the standard deviation (STDEV) of the quantitative MS results for each compound. Subsequent correlation analysis showed that the STDEV and IC50 were inversely correlated: more cytotoxic compounds (compounds with lower IC50 values) induced more dramatic protein perturbations, whereas compounds with higher IC50 values (less cytotoxic) induced fewer overall perturbations on the proteome (Figure 2B). Specifically, NVP-BEZ235 and trametinib are two of the most potent cytotoxins for HCC4017 cells, which target PI3K/mTOR and ERK-MAPK, respectively. Therefore, they induced dramatic changes in the overall protein expression profiles (Figure 2B).
Figure 2.
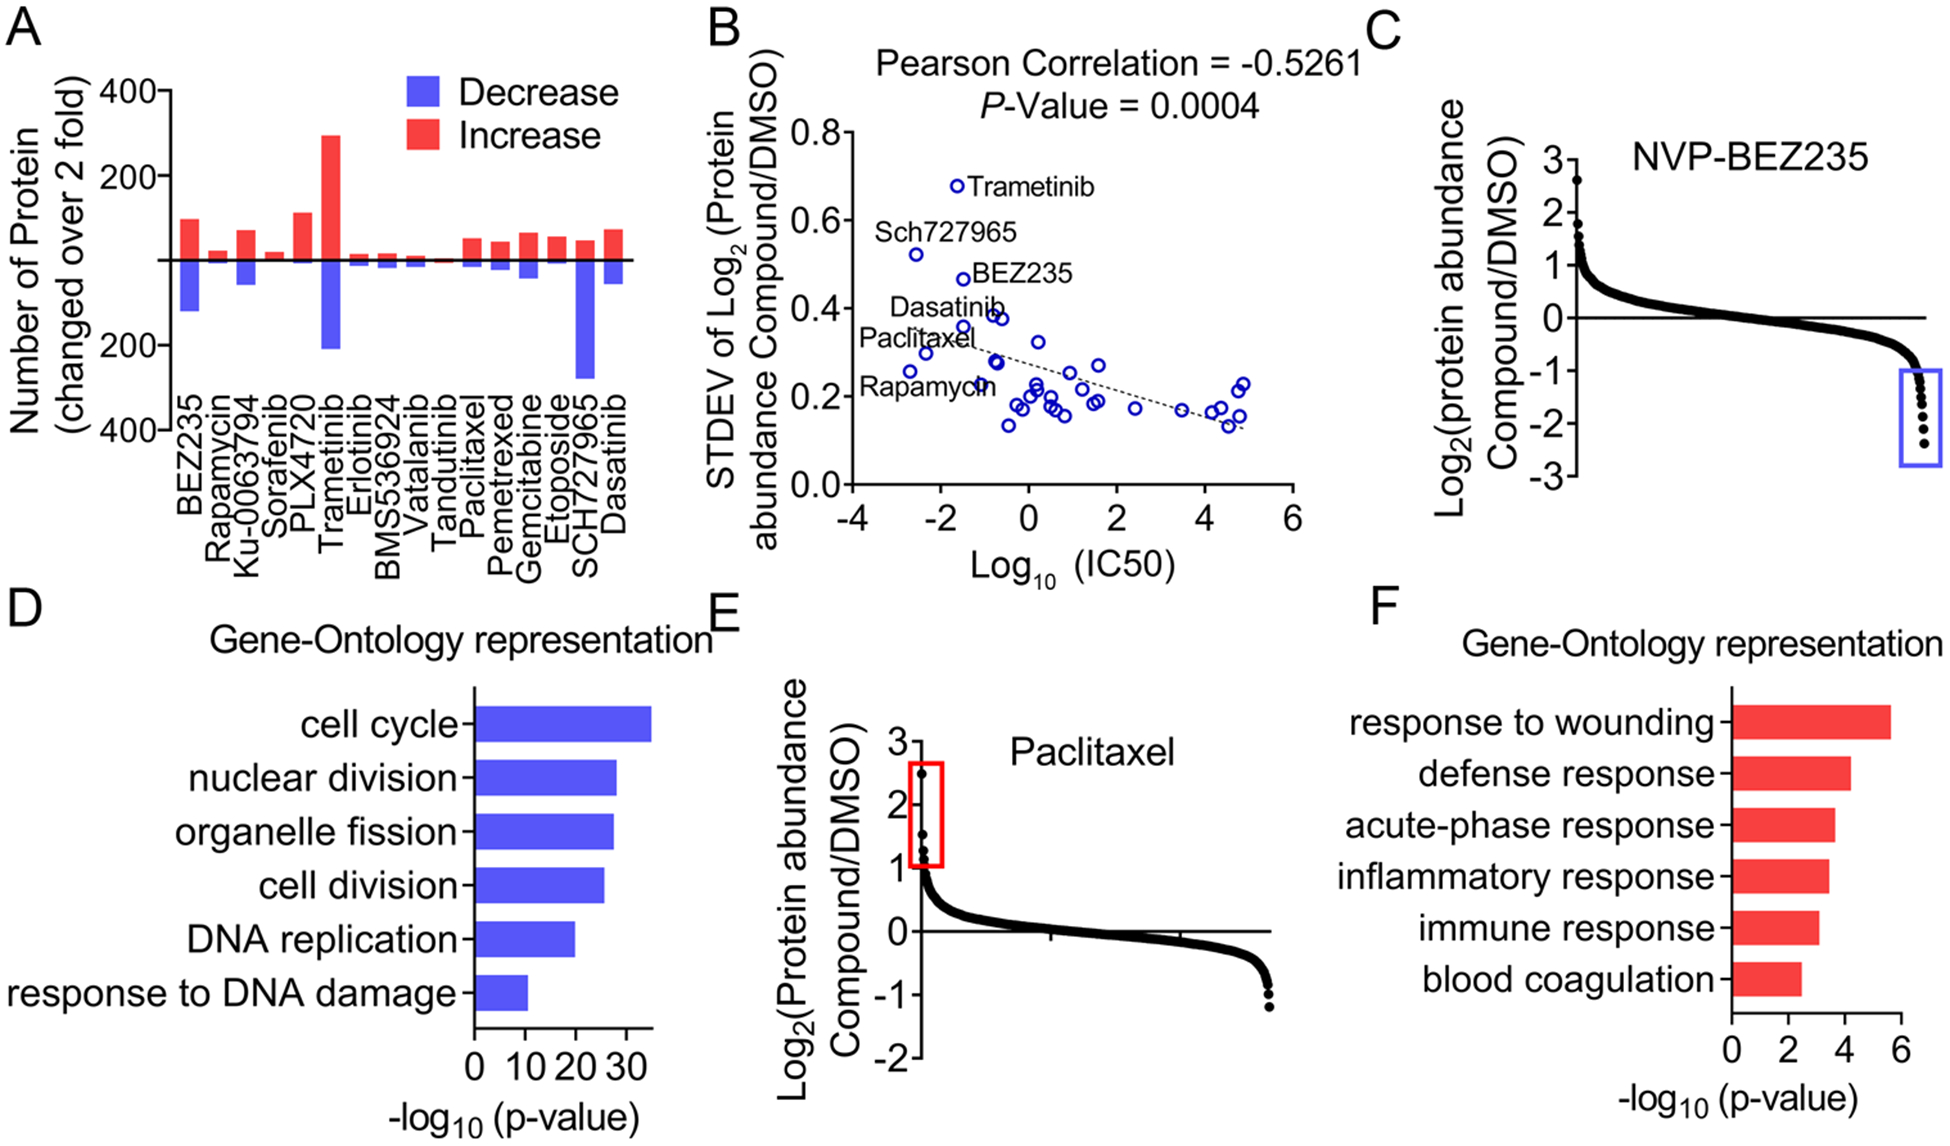
Compound-centric analysis of the proteomic response to chemical perturbagens. (A) Numbers of proteins up- and downregulated (by more than 2-fold) in HCC4017 cells upon the indicated compound treatment. (B) The correlation between IC50 and the standard deviation (STDEV) values. (C and D) Log2 plot analysis of protein abundances in HCC4017 cells treated with NVP-BEZ235 (C). GO analysis of the proteins that were downregulated by more than 2-fold (blue box of C) (D). (E and F) Log2 plot analysis of protein abundances in HCC4017 cells treated with paclitaxel (E). GO analysis of the proteins that were upregulated by more than 2-fold (red box in E) (F).
We further extracted the TMT results for NVP-BEZ235 in HCC4017 cells and performed a gene ontology (GO) analysis. The results showed that the proteins that were downregulated by more than 2-fold upon NVP-BEZ235 treatment were highly enriched for proteins involved in cell cycle regulation (Figures 2C and 2D). Intriguingly, we identified a highly similar profile of GO terms for the proteins that were downregulated after trametinib treatment, including cell cycle, mitosis, and nuclear division (Figure S1A). These results are consistent with these two pathways (i.e., PI3K and ERK-MAPK) being the major effectors downstream of mutant KRAS that drive cell growth and proliferation. In addition to the above-mentioned kinase inhibitors, the treatment of HCC4017 with other cytotoxic compounds also induced interesting proteome changes. In particular, we found that the proteins that were upregulated upon paclitaxel treatment were highly enriched with biological processes related to an immune response and a response to injury (Figures 2E and 2F). We performed Q-RT-PCR experiments, and we confirmed that two of the inflammatory genes, IL1A and IL1B, were strongly upregulated upon paclitaxel treatment (Figure S1C). Although the mechanism is still incompletely understood, it has been proposed that taxane-induced formation of postmitotic micronuclei might explain their higher activities in solid tumors. Specifically, paclitaxel-treated cells are highly micronucleated when they exit mitosis. This is consistent with the finding that micronuclei induce postmitotic DNA damage and promote inflammatory signaling in a cGAS-STING-dependent manner.25
Pathway-Centric Analysis of the Proteomic Response to Chemical Perturbagens.
In addition to the interrogation of the resource based on individual drugs, we performed unsupervised hierarchical clustering to identify more global patterns of proteomic changes induced by the various compounds. Clustering the compounds based on their quantitative proteomic profiles revealed that inhibitors with similar MoAs induced similar changes in protein expression patterns and tended to converge into the same or closely related clusters. On the basis of the resulting heat map, the 35 compounds tested were classified into eight representative clusters (Figure 3A). For example, IGF1R and VEGFR inhibitors formed two clusters (cluster 5 and cluster 6, respectively), even though they caused limited overall perturbation to the proteome of HCC4017 cells. This is not surprising because the KRASG12V mutation results in the constitutive activation of downstream survival pathways and renders these cells resistant to RTK inhibitors.22 In contrast, multiple compounds targeting the PI3K/mTOR pathway caused more dramatic protein expression changes, leading to the formation of cluster 4. Intriguingly, several compounds that target other nodal kinases within this pathway resulted in much more distinct patterns of proteome changes. For example, the proteomic responses of HCC4017 cells to the treatment of MK2206, a specific inhibitor of AKT, were rather mild compared to the aforementioned PI3K/mTOR inhibitors. Similarly, the treatment of HCC4017 cells with the PDK1 inhibitor (GSK2334470) also had a marginal effect on the proteome. Indeed, these two compounds were not grouped with the other compounds in cluster 4, and they formed a distinct class. It has been shown that the inhibition of both S6K and 4EBP, two major downstream targets of mTORC1, are required for the suppression of tumor cell growth. AKT and PDK inhibitors block the phosphorylation of S6K but not 4EBP and have no effect on the cell cycle progression of tumor cells, suggesting the presence of an AKT-independent mechanism for PI3K and mTOR to regulate 4EBP1 phosphorylation, protein translation, and cell proliferation.26 We envision that perhaps the protein expression signatures from our studies could shed light on the differential signaling mechanisms of these key PI3K downstream kinases in both physiological and pathological conditions.
Figure 3.
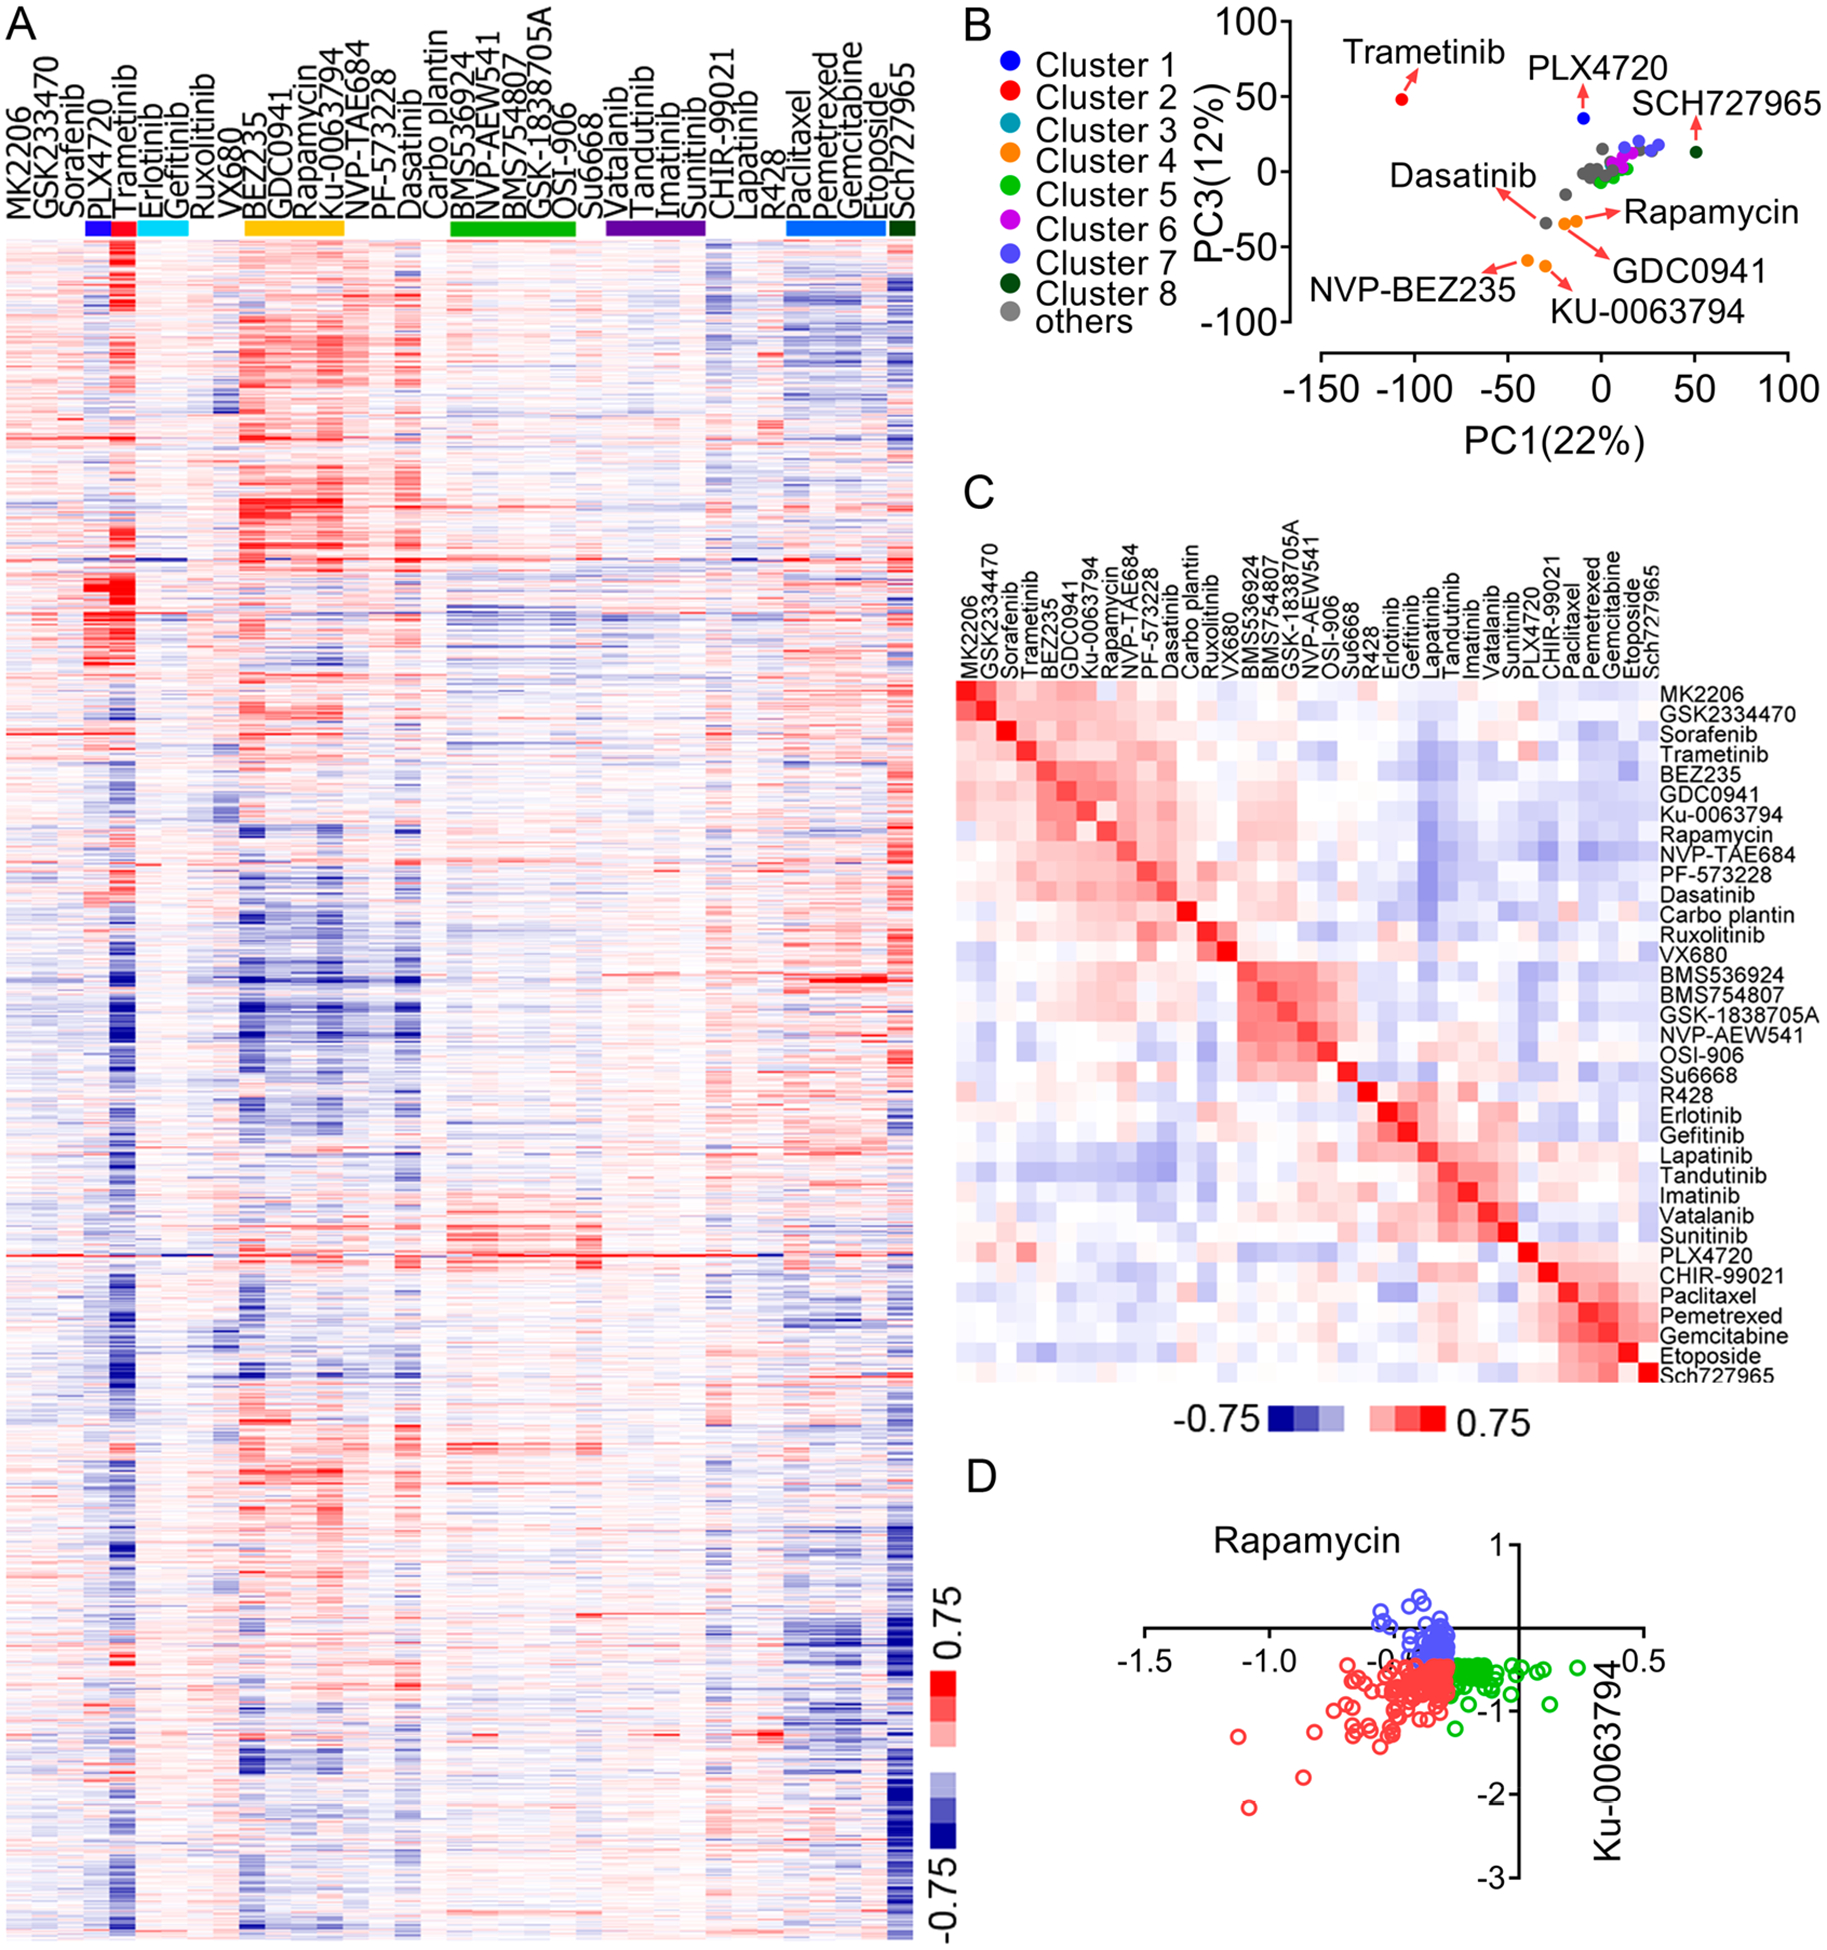
Pathway-centric analysis of the proteomic response to chemical perturbagens. (A) Hierarchical clustering of protein expression profiles of HCC4017 cells treated with the 35 compounds. Eight representative compound clusters are shown by different colors. The data were computed using centered Pearson correlations. (B) PCA analysis of the protein expression profiles of HCC4017 cells treated with the 35 compounds. The different colors represent the drug clusters, as shown in panel A. (C) Hierarchical clustering of Pearson correlation values between pairs of compounds. (D) Cross-reference analysis of the top 200 downregulated proteins in HCC4017 cells upon rapamycin versus KU-0063794 treatment. Results are shown as Log2(Compound/DMSO).
As another means of visualizing the results, we performed a principle component analysis (PCA) to identify the potential correlation between the protein expression profiles and the 35 different compounds (Figure 3B). This analysis accurately reproduced many of the aforementioned compound classes. Specifically, we found that the four PI3K/mTOR inhibitors (NVP-BEZ235, KU-0063794, GDC-0941, and rapamycin) form a tight cluster. Trametinib and SCH727965 induced more distinct protein expression changes, and this was characterized by the large distance on the PCA plot between these two inhibitors and the rest of the compounds.
To further analyze the functional relationship between the drugs, we performed a pairwise Pearson correlation analysis of the entire protein expression profile for each compound, followed by hierarchical clustering using the corresponding Pearson correlation values (Figure 3C). The analysis showed that the protein expression changes induced by several compounds, including NVP-BEZ235, GDC-0941, rapamycin, and KU-0063796, were again very similar, and these compounds formed a cluster on the resulting heat map. Similarly, IGF1R inhibitors and the various chemotherapeutic compounds also formed tight clusters. We reason that by correlating with the reference compounds, these global protein expression signatures could be a particularly powerful means to offer insights into the potential MoAs for novel therapeutic agents. By using this “proteomic connectivity” map, one could also deduce MoAs information for novel therapeutic agents.
While clustering the compounds helps identify their functional similarities, clustering proteins based on each compound highlights the heterogeneity in the response to their respective compound treatment. We selected two representative protein groups and performed GO analyses to identify the biological processes that are enriched for each protein group (Figure S2A). We also extracted the expression changes for proteins in each biological process to dissect how these proteins were specifically regulated by the various compound classes. Interestingly, upon the treatment of HCC4017 cells with cluster 4 inhibitors, proteins involved in oxidation-reduction-related proteins were upregulated, whereas cell cycle-related proteins were downregulated (Figure S2A).
The hierarchical clustering analysis showed that certain compounds targeted to the same signaling pathway had different effects on the proteome (Figure 3A). To further explore this, we selected several pairs of compounds and performed cross-reference analyses. Specifically, we extracted the top 200 most downregulated proteins from the rapamycin treatment group. These proteins were then queried against the KU-0063794 data set, and their corresponding expression changes in this sample were determined (Figure 3D). Similarly, the top 200 most downregulated proteins in the KU-0063794 data set were extracted and queried against the rapamycin data set. The resulting plot showed that rapamycin and KU-0063794 induced both overlapping and distinct expression changes for these downregulated proteins, consistent with the knowledge that rapamycin is a more specific inhibitor of mTORC1, whereas KU-0063794 is an ATP-competitive, mTOR kinase inhibitor that blocks both mTORC1 and mTORC2.27 A significant degree of overlap was also observed between the NVP-BEZ235/KU-0063794 pair (Figure S2B). In contrast, the effects of PLX4720 and trametinib on the proteome showed very little overlap (Figure S2B) due to the inability of PLX4720 to block the downstream signaling in the BRAFwt/Krasmut context. Finally, we extracted the proteins that were commonly downregulated between the NVP-BEZ235/ trametinib pair and performed a GO analysis. The results showed that both drugs affected the signaling pathways related to DNA damage and cell cycle regulation. However, the proteins downregulated upon trametinib treatment but upregulated upon NVP-BEZ235 treatment are involved in cellular homeostasis, and the proteins downregulated upon NVP-BEZ235 treatment but upregulated upon trametinib treatment are involved in extracellular matrix disassembly (Figure S2C). These results indicate that besides the commonly modulated cell cycle pathways, these two compounds can also regulate unique biological processes as well.
The Context Dependency of Drug-Induced Proteome Perturbation.
The isogenic HBEC30KT and HCC4017 cell pair offers a unique opportunity to interrogate how the proteome of normal cells versus NSCLC cells might respond differently to the drug treatment. Toward this, in several of the TMT experiments, we included HBEC30KT cells that were treated (in parallel with HCC4017 cells) with either DMSO or compounds targeting the PI3K/mTOR and RAS-ERK-MAPK pathways (Table S1). We also achieved excellent quantitative reproducibility for the HBEC30KT TMT results (Figures S3A and S3B).
To assess the difference in the basal proteome between these two cells, we first extracted the basal protein expression in HBEC30KT and HCC4017 cells (Figure 4A). As shown in Figure 4A, the proteome of HCC4017 cells differed significantly from that of HBEC30KT cells, with 270 and 120 proteins upregulated and downregulated by more than 2-fold, respectively. Gene Ontology analyses showed that the proteins upregulated (by more than 2-fold) in HCC4017 cells were involved in cell proliferation, INFG-mediated signaling, and oxidative stress (Figure 4B).
Figure 4.
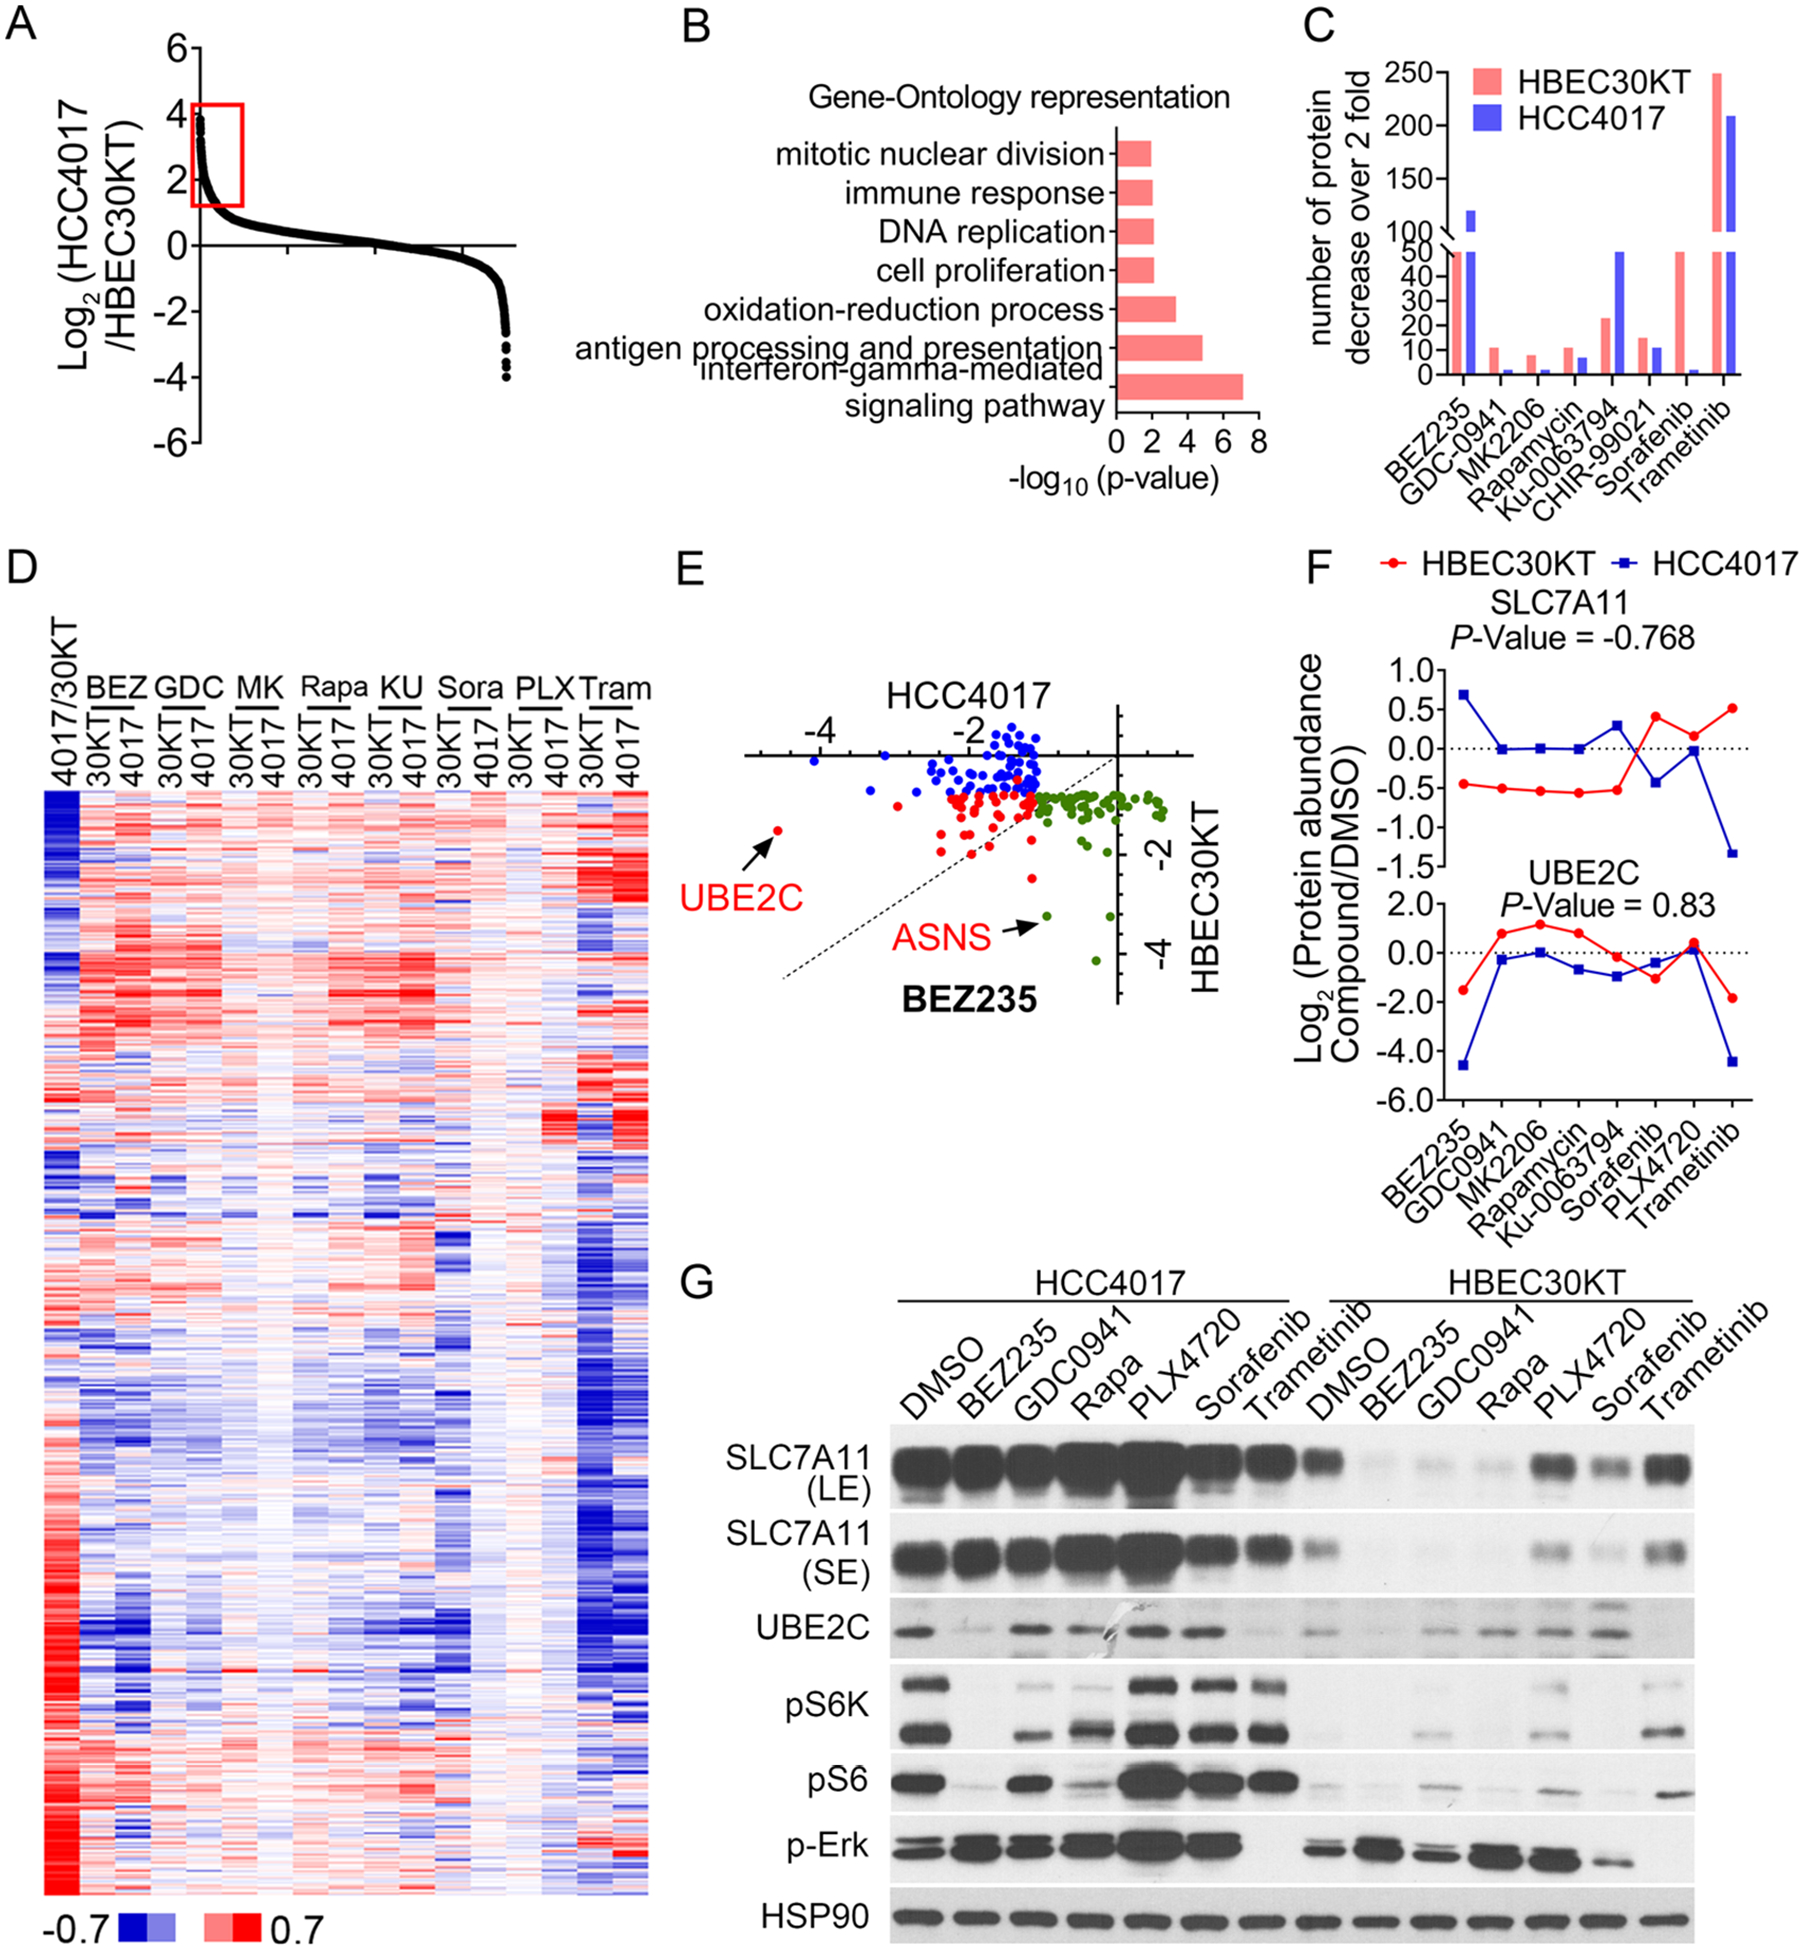
The context dependency of drug-induced proteome perturbation. (A and B) Comparison of basal protein expression between HCC4017 and HBEC30KT cells. Proteins that were upregulated by more than 2-fold in HCC4017 cells (red box of A) compared to HBEC30KT cells were subject to GO analysis (B). (C) Numbers of proteins downregulated (by more than 2-fold) in HBEC30KT and HCC4017 cells upon treatment with the indicated compounds. (D) Hierarchical clustering of protein expression profiles of HCC4017 cells (4017) and HBEC30KT cells (30KT) upon treatment with the compounds. The protein abundances are shown as log2(HCC4017/HBEC30KT) or log2(compound/DMSO). BEZ: NVP-BEZ235. GDC: GDC0941. MK: MK2206. Rapa: rapamycin. KU: KU-0063794. Sora: sorafenib. PLX: PLX4720. Tram: trametinib. (E) Cross-reference analysis of the top 100 downregulated proteins in HCC4017 and HBEC30KT cells upon NVP-BEZ235 treatment. Results are shown as log2(compound/DMSO). (F and G) TMT results (F) and immunoblot analysis (G) of SLC7A11 and UBE2C proteins in HCC4017 and HBEC30KT cells upon treatment with the indicated compounds.
We next compared the number of proteins whose expression decreased by more than 2-fold in HCC4017 and HBEC30KT cells upon the treatment with individual compounds (Figure 4C). We found that NVP-BEZ235 treatment led to the downregulation of 120 and 50 proteins in HCC4017 and HBEC30KT cells (by more than 2-fold), respectively. On the other hand, sorafenib treatment resulted in the downregulation of 86 proteins in HBEC30KT, but only 2 proteins in HCC4017 cells (by more than 2-fold). The unsupervised hierarchical clustering analysis provided a more global overview of the differential response between these two cell lines against these compounds (Figure 4D). To further interrogate the differential proteomic response between HBEC30KT and HCC4017 cells to the above-mentioned compound treatment, we extracted the top 100 NVP-BEZ235-induced downregulated proteins from the HCC4017 data set. These proteins were then queried against the HBEC30KT NVP-BEZ235 treatment data set, and their corresponding expression changes in this sample were determined. Similarly, the top 100 most downregulated proteins in the HBEC30KT NVP-BEZ235 data set were extracted and queried against the HCC4017 NVP-BEZ235 data set (Figure 4E and S3C). The results from these analyses indicated that NVP-BEZ235 induced both overlapping and distinct expression changes in these two cell lines. Finally, we performed a pairwise Pearson correlation analysis of the entire protein expression profile for the 8 compounds (Figure 4F). As an example, UBE2C, a ubiquitin E2-conjugating enzyme that is required for the destruction of mitotic cyclins,28 showed a Pearson correlation value of 0.826 between the HBEC30KT and HCC4017 cells. Intriguingly, we also observed many proteins that responded differently in these two cell lines. As an example, SLC7A11, a sodium-independent cysteine-glutamate antiporter,29,30 showed a Pearson correlation value of −0.768, indicating an inverse pattern of proteomic responses between HBEC30KT and HCC4017 cells (Figure 4F). We validated our quantitative proteomic results using immunoblotting experiments. Indeed, we found that although the PI3K/mTOR inhibitors (i.e., NVP-BEZ235, GDC-0941, and rapamycin) caused a dramatic downregulation of SLC7A11 in HBEC30KT cells, these compounds had no effect on the expression of this protein in HCC4017 cells (Figure 4G and S3D). This observation could result from the rewiring during oncogenic transformation of the signaling system that controls its expression. It is important to note that although PI3K signaling is frequently activated in cancer, many inhibitors against this pathway showed disappointing results with unfavorable toxicity profiles in the clinic.26 Our approach could help garner a thorough understanding of the therapeutic response in not only cancer cells but also normal cells in order to achieve an optimal therapeutic window and to avoid the potential adverse effects of these drugs.
Protein Covariance Network Analysis.
Proteins rarely function alone, and those with similar expression patterns are often of particular biological interest. Indeed, Stuart et al. previously identified pairs of genes that are co-expressed in humans, flies, worms, and yeast in publicly available DNA microarray data.31 More recently, Lapek et al. performed quantitative proteomic analyses on a panel of breast cancer cell lines, and they showed that a co-regulation analysis on the protein level predicts protein-protein associations.32 However, such protein co-expression and functional association analyses have not been performed under perturbation conditions (e.g., compound treatment conditions).
Toward this, we performed Pearson correlation analyses to analyze protein co-expression profiles between all the potential protein pairs in the HCC4017 data set. There were 1385 protein pairs that were positively co-regulated with a Pearson correlation coefficient over 0.9. The protein pairs with a Pearson correlation coefficient of more than 0.9 contained a total of 516 unique proteins. There were 147 proteins that were involved in more than five pairs with significant correlations (Figure 5A). We performed GO analyses of these proteins (516 unique proteins) and found that these proteins are mainly involved in DNA repair, spindle organization, nucleotide biosynthesis, cell cycle, translation elongation, RNA processing, and ribosome biogenesis (Figures 5B and 5C).
Figure 5.
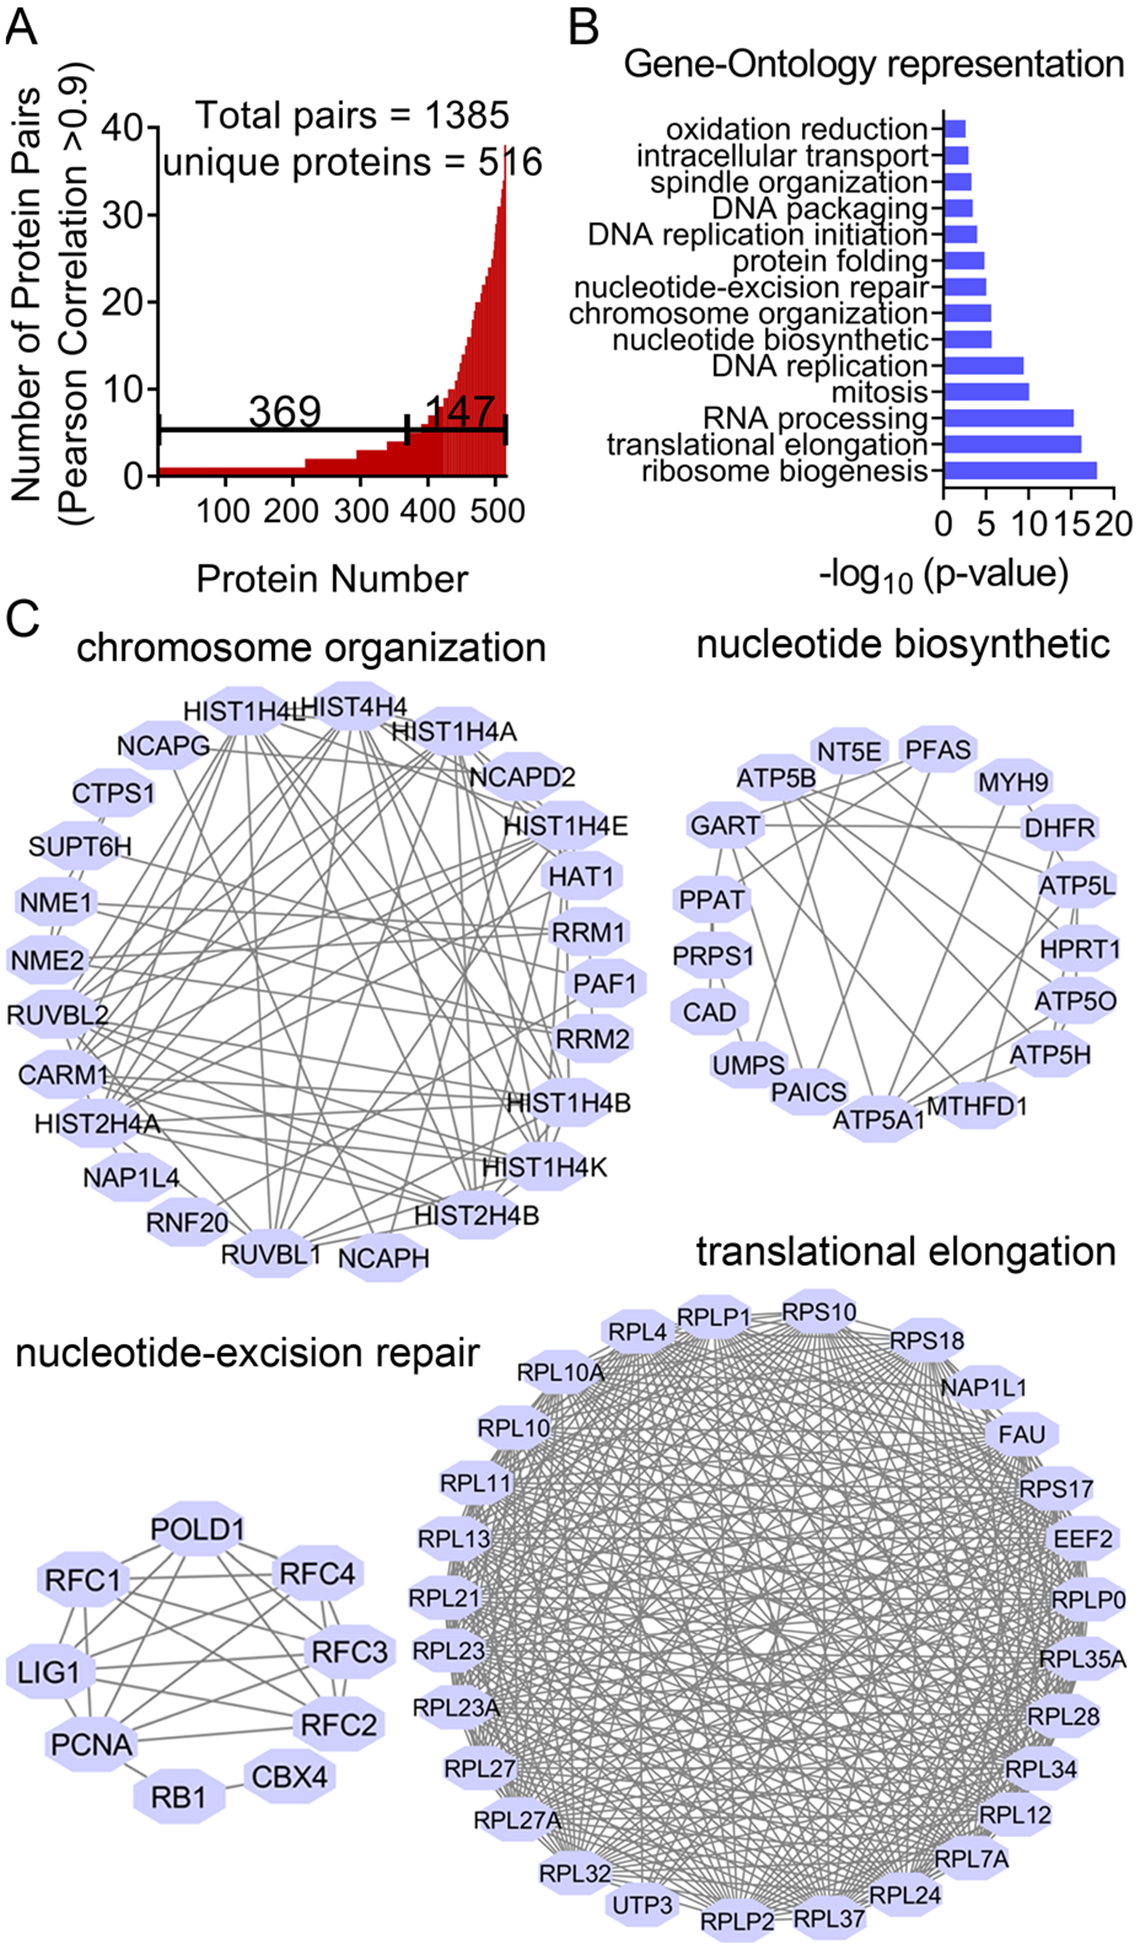
Identification of protein covariance networks. (A and B) Pearson correlation analysis of the protein covariant patterns. Protein pairs with a Pearson correlation coefficient of more than 0.9 are shown (A). These proteins are subject to GO analysis (B). (C) The resulting protein covariance networks are extracted from the STRING database and are visualized using Cytoscape.
On the basis of the resulting network of these protein pairs, we identified a large number of known protein complexes. For example, in the mini-chromosome maintenance (MCM) complex, we identified all of the six subunits (MCM2–7). The MCM complex was suggested to be critically involved in DNA replication initiation and other features of chromosome biology.33–35 We found that the expression of all the MCM proteins was highly coordinated (Figure S4A). For example, the abundance of MCM2 was near perfectly correlated with that of MCM7 (p-value = 0.96), which were simultaneously up- or downregulated across the compound treatment conditions (Figure S4B). These results agree well with the previous biochemical studies suggesting that the bulk of MCMs associate in vivo in a heterohexamer with a 1:1:1:1:1:1 stoichiometry, and there are very small amounts of single MCMs in the cell. We further demonstrated a direct interaction between MCM2 and MCM7 by co-immunoprecipitation experiments (Figure S4C). As another example, we found that several components of the NDC80 complex, which is a large protein machine that is involved in regulating chromosome segregation during cell cycle division.36,37 Specifically, the NDC80 complex is a composed of two dimers, Ndc80:Nuf2 and Spc24:Spc25.38 We found that these proteins also had a very robust, positive co-expression pattern (Figure S4D). For example, the abundance of Spc25 was highly correlated with that of Ndc80 and Spc24, with Pearson correlation coefficients of 0.86 and 0.93, respectively (Figures S4D and S4E). We further confirmed the presence of an interaction between Spc25 and Ndc80 using independent co-immunoprecipitation experiments (Figure S4F).
We also identified a total of 114 protein pairs (which contain 112 unique proteins) that had Pearson correlation values of less than –0.9 (Figure S4G). These pairs of proteins are also of potential biological interest because these could be antagonistic with respect to one another (e.g., a ubiquitin E3 ligase and its substrate).
C5orf22 Is a New Component of the WBP11/PQBP1 mRNA Splicing Complex.
Having established the utility of protein covariance networks, we sought to identify novel protein complexes using the above-mentioned data set. As an example, we found that a poorly studied protein C5orf22 displayed an excellent co-expression pattern with WBP11 (p-value = 0.897) (Figure 6A). WBP11 binds to another protein called PQBP1 to form a complex known to regulate cell cycle progression and mRNA splicing.39 Using tandem affinity purification mass spectrometry (TAP-MS) and co-immunoprecipitation experiments, we confirmed our protein co-expression results and found that C5orf22 indeed interacts with both WBP11 and PQBP1 (Figures 6B, S5A, and S5B).
Figure 6.
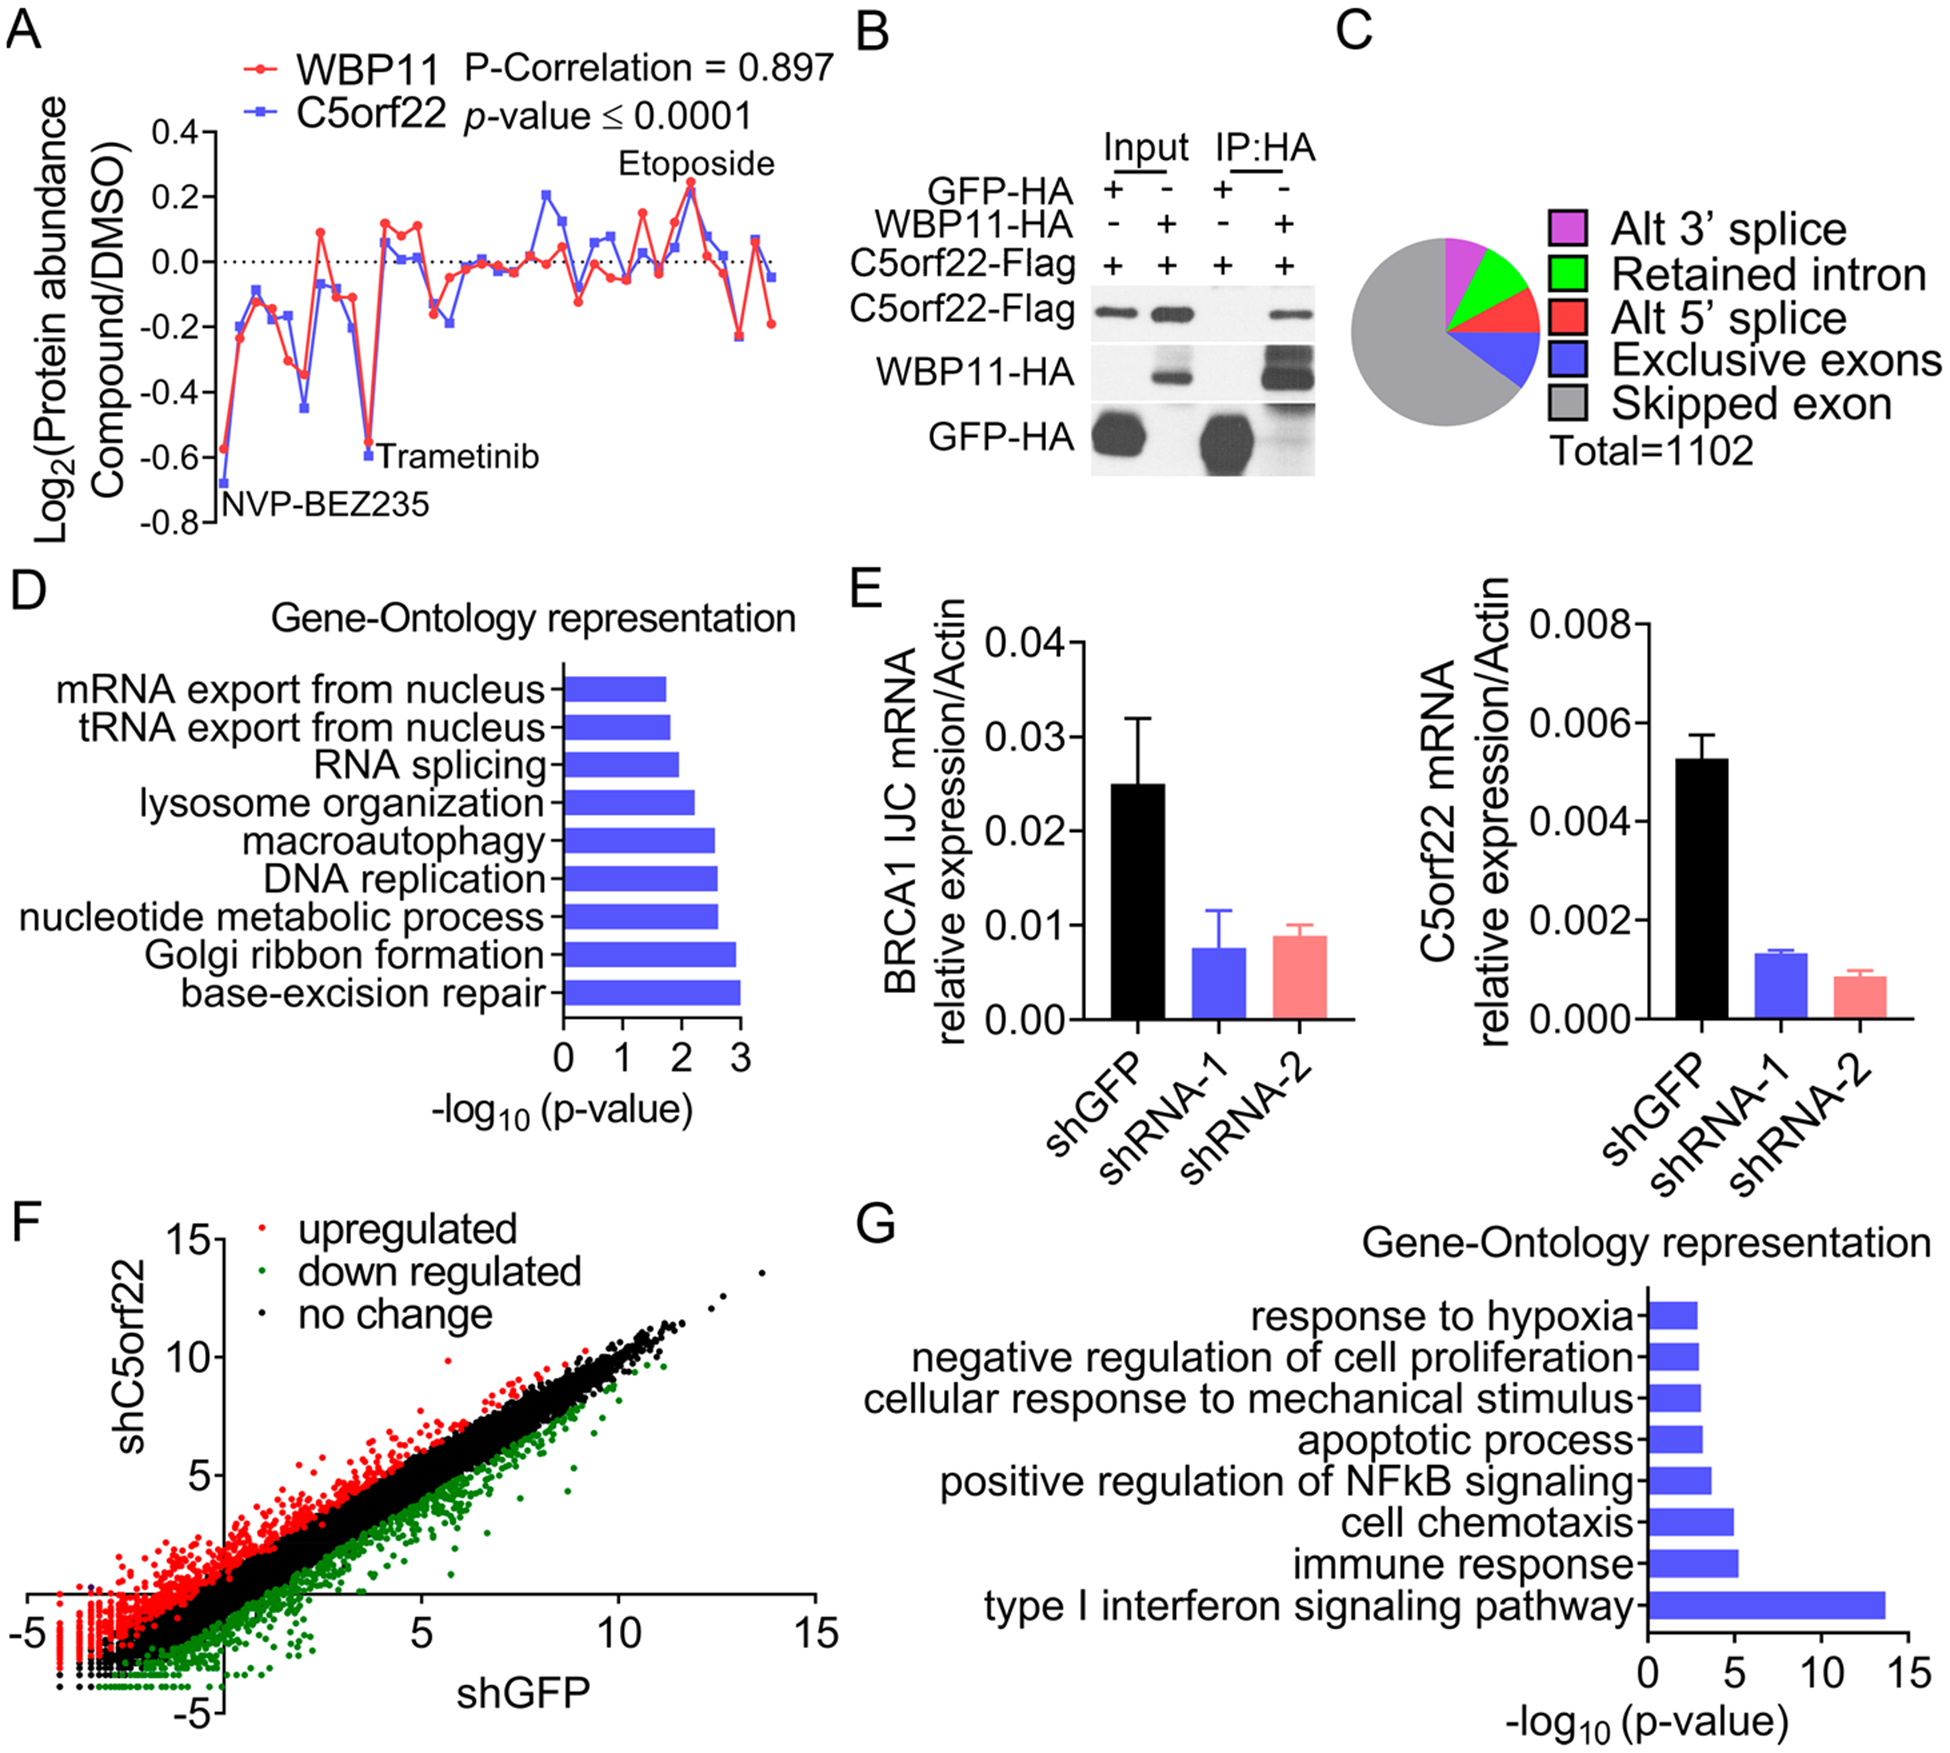
C5orf22 is a component of the WBP11/PQBP1 spliceosome complex. (A) Covariation between C5orf22 and WBP11 protein abundances in compound-treated HCC4017 cells. (B) Validation of the interaction between C5orf22 and WBP11 using co-immunoprecipitation. GFP-HA was used as the negative control. (C and D) Alternative splicing events induced by C5orf22 depletion (C) and their GO analysis (D). (E) Real-time RT-PCR analyses of the alternative splicing of BRCA1 and C5orf 22 in control and C5orf22-depleted HCC4017 cells. (F and G) Gene expression changes in C5orf22-depleted HCC4017 cells. Cells with shGFP were used as the control (F). Genes that were downregulated by more than 2-fold were subject to GO analysis (G).
Between 90 and 95% of pre-mRNAs encoded by human genes are alternatively spliced.40 To investigate whether C5orf22 is involved in regulating alternative splicing, we performed an RNA-seq analysis to identify alternative splicing events in HCC4017 cells transduced with either a control or C5orf22 short hairpins. Intriguingly, the depletion of C5orf22 in HCC4017 cells leads to profound cell cycle arrest and apoptosis (Figure S5C). We identified a total of 1102 differential splicing events that occurred with C5orf22 knockdown, including an alternative 5′ and 3′ splice site usage, retained introns, mutually exclusive exon inclusion, and, most significantly, skipped exons (Figure 6C). A GO analysis revealed that most of the affected genes are involved in DNA repair, DNA replication, and RNA splicing (Figures 6D and S5D). As an example, the levels of a BRCA1 variant with a skipped exon 3 were greatly elevated in cells with C5orf22 depletion compared to control cells, as shown by qRT-PCR experiments (Figures 6E and S5E). BRCA1 is a protein that is critically involved in regulating genomic stability and DNA damage response. Several BRCA1 mRNA variants have been identified, among which exon 3 skipping has been shown to cause a frameshift of the BRCA1 transcript, leading to the formation of a protein that is unstable and rapidly degraded.41 In addition to the alternative splicing events, we also found many genes involved in immune response were downregulated when C5orf22 was depleted (Figures 6F and 6G). This was further confirmed by qRT-PCR experiments (Figure S5F). Taken together, these data suggest that C5orf22 is a novel component of the WBP11/PQBP1 complex that regulates the splicing and expression of genes critical for multiple biological processes, including, in particular, DNA damage repair, cell survival, and immunomodulation pathways. The detailed mechanism of C5orf22-mediated regulation of these molecular events warrants further investigation. In addition, given the current great interest in cancer immunotherapy, it will be important to know if C5orf22 knockdown leads to increased or decreased immune anticancer responses.
Conclusions.
We systematically characterized the proteomic responses of a unique isogenic cell line pair (i.e., HBEC30KT vs HCC4017) to 35 small molecule compounds, including various kinase inhibitors and commonly used chemotherapeutic agents. Subsequent analyses of the data sets revealed the adaptive proteomic responses in a compound-centric, pathway-centric, and context-dependent manner. Furthermore, using protein covariance patterns extracted from the data sets, we uncovered both known and previously unrecognized functional protein networks. We envision that these data sets contain more examples of novel connections that will dramatically enrich studies on protein–protein interactions in both cancer and normal cells. These above-mentioned vignettes represent examples of potential applications for the proteomic response resource presented in this report. Ultimately, the value of this resource can only be validated by future hypothesis-driven research that leads to a better understanding of the molecular underpinnings of tumorigenesis and therapeutic response of NSCLC.
METHODS
A complete description of methods is given in the Supporting Information.
Supplementary Material
ACKNOWLEDGMENTS
This work was supported in part by grants from the Welch Foundation (I-1800 to Y.Y.), NIH (R01GM122932 and R01GM114160 to Y.Y., P50CA070907 to J.D.M., and R01GM130838 to Y.C.), American Cancer Society (RSG-15-062-01-TBE to Y.Y.), Bristol-Myers Squibb-MRA Young Investigator Award in Immunotherapy (#569414 to Y.C.), and CPRIT (RP160157 to Z.Z. and RP160652 to J.D.M.).
The authors declare the following competing financial interest(s): Y.Y. receives research support from Pfizer.
Footnotes
Supporting Information
The Supporting Information is available free of charge at https://pubs.acs.org/doi/10.1021/acschembio.9b00694.
Method, Figures S1–5 and Table S1–2 (PDF)
Proteomics data from HCC4017 cells upon 35 compounds treatment. The raw data of protein abundance identified by TMT experiments, fold changes of protein abundance (Compound/DMSO), Log2 (Fold Changes (Compound/DMSO)), Pearson correlation of compounds (For Figure 3C) are presented in different data sheet as indicated (http://pubs.acs.org/doi/suppl/10.1021/acschembio.9b00694/suppl_file/cb9b00694_si_001.xlsx)
Proteomics data from both HCC4017 and HBEC30KT cells upon indicated compound treatment. The raw data of protein abundance identified by TMT experiments, fold change of protein abundance (Compound/DMSO), Fold change of protein abundance (HCC4017-DMSO/HBEC30KT-DMSO) (For Figure 4A) (http://pubs.acs.org/doi/suppl/10.1021/acschembio.9b00694/suppl_file/cb9b00694_si_003.xlsx)
Pearson correlation of protein abundance between HCC4017 and HBEC30KT cells upon indicated compound treatment, Pearson correlation of SLC7A11 and UBE2C between HCC4017 and HBEC30KT cells upon indicated compound treatment (For Figure 4F) are presented in different data sheet as indicated (http://pubs.acs.org/doi/suppl/10.1021/acschembio.9b00694/suppl_file/cb9b00694_si_002.xlsx) RNA-seq data for splicing events in C5orf22 knockdown HCC4017 cells and their control cells (shGFP). Genes with alternative 5′ splicing, alternative 3′ splicing, mutually exclusive, retained intron, and skipped exon are all presented in this table as indicated in different data sheet (http://pubs.acs.org/doi/suppl/10.1021/acschembio.9b00694/suppl_file/cb9b00694_si_004.xlsx)
REFERENCES
- (1).Herceg Z, and Hainaut P (2007) Genetic and epigenetic alterations as biomarkers for cancer detection, diagnosis and prognosis. Mol. Oncol 1, 26–41. [DOI] [PMC free article] [PubMed] [Google Scholar]
- (2).Sadikovic B, Al-Romaih K, Squire JA, and Zielenska M (2008) Cause and consequences of genetic and epigenetic alterations in human cancer. Curr. Genomics 9, 394–408. [DOI] [PMC free article] [PubMed] [Google Scholar]
- (3).Flavahan WA, Gaskell E, and Bernstein BE (2017) Epigenetic plasticity and the hallmarks of cancer. Science 357, eaal2380. [DOI] [PMC free article] [PubMed] [Google Scholar]
- (4).Herbst RS, Morgensztern D, and Boshoff C (2018) The biology and management of non-small cell lung cancer. Nature 553, 446–454. [DOI] [PubMed] [Google Scholar]
- (5).Sawyers C (2004) Targeted cancer therapy. Nature 432, 294–297. [DOI] [PubMed] [Google Scholar]
- (6).Luo J, Solimini NL, and Elledge SJ (2009) Principles of cancer therapy: oncogene and non-oncogene addiction. Cell 136, 823–837. [DOI] [PMC free article] [PubMed] [Google Scholar]
- (7).Gower A, Wang Y, and Giaccone G (2014) Oncogenic drivers, targeted therapies, and acquired resistance in non-small-cell lung cancer. J. Mol. Med. (Heidelberg, Ger.) 92, 697–707. [DOI] [PMC free article] [PubMed] [Google Scholar]
- (8).Niederst MJ, and Engelman JA (2013) Bypass mechanisms of resistance to receptor tyrosine kinase inhibition in lung cancer. Sci. Signaling 6, No. re6. [DOI] [PMC free article] [PubMed] [Google Scholar]
- (9).Hrustanovic G, Lee BJ, and Bivona TG (2013) Mechanisms of resistance to EGFR targeted therapies. Cancer Biol. Ther 14, 304–314. [DOI] [PMC free article] [PubMed] [Google Scholar]
- (10).Stewart EL, Tan SZ, Liu G, and Tsao MS (2015) Known and putative mechanisms of resistance to EGFR targeted therapies in NSCLC patients with EGFR mutations-a review. Transl Lung Cancer Res. 4, 67–81. [DOI] [PMC free article] [PubMed] [Google Scholar]
- (11).Kim TM, Song A, Kim DW, Kim S, Ahn YO, Keam B, Jeon YK, Lee SH, Chung DH, and Heo DS (2015) Mechanisms of Acquired Resistance to AZD9291: A Mutation-Selective, Irreversible EGFR Inhibitor. J. Thorac. Oncol 10, 1736–1744. [DOI] [PubMed] [Google Scholar]
- (12).Morgillo F, Della Corte CM, Fasano M, and Ciardiello F (2016) Mechanisms of resistance to EGFR-targeted drugs: lung cancer. ESMO Open 1, No. e000060. [DOI] [PMC free article] [PubMed] [Google Scholar]
- (13).Shtivelman E, Davies MQ, Hwu P, Yang J, Lotem M, Oren M, Flaherty KT, and Fisher DE (2014) Pathways and therapeutic targets in melanoma. Oncotarget 5, 1701–1752. [DOI] [PMC free article] [PubMed] [Google Scholar]
- (14).Holohan C, Van Schaeybroeck S, Longley DB, and Johnston PG (2013) Cancer drug resistance: an evolving paradigm. Nat. Rev. Cancer 13, 714–726. [DOI] [PubMed] [Google Scholar]
- (15).Sun X, Bao J, You Z, Chen X, and Cui J (2016) Modeling of signaling crosstalk-mediated drug resistance and its implications on drug combination. Oncotarget 7, 63995–64006. [DOI] [PMC free article] [PubMed] [Google Scholar]
- (16).Lamb J, Crawford ED, Peck D, Modell JW, Blat IC, Wrobel MJ, Lerner J, Brunet JP, Subramanian A, Ross KN, Reich M, Hieronymus H, Wei G, Armstrong SA, Haggarty SJ, Clemons PA, Wei R, Carr SA, Lander ES, and Golub TR (2006) The Connectivity Map: using gene-expression signatures to connect small molecules, genes, and disease. Science 313, 1929–1935. [DOI] [PubMed] [Google Scholar]
- (17).Subramanian A, Narayan R, Corsello SM, Peck DD, Natoli TE, Lu X, Gould J, Davis JF, Tubelli AA, Asiedu JK, Lahr DL, Hirschman JE, Liu Z, Donahue M, Julian B, Khan M, Wadden D, Smith IC, Lam D, Liberzon A, Toder C, Bagul M, Orzechowski M, Enache OM, Piccioni F, Johnson SA, Lyons NJ, Berger AH, Shamji AF, Brooks AN, Vrcic A, Flynn C, Rosains J, Takeda DY, Hu R, Davison D, Lamb J, Ardlie K, Hogstrom L, Greenside P, Gray NS, Clemons PA, Silver S, Wu X, Zhao WN, Read-Button W, Wu X, Haggarty SJ, Ronco LV, Boehm JS, Schreiber SL, Doench JG, Bittker JA, Root DE, Wong B, and Golub TR (2017) A Next Generation Connectivity Map: L1000 Platform and the First 1,000,000 Profiles. Cell 171, 1437–1452. [DOI] [PMC free article] [PubMed] [Google Scholar]
- (18).Lee J, Liu J, Feng X, Salazar Hernandez MA, Mucka P, Ibi D, Choi JW, and Ozcan U (2016) Withaferin A is a leptin sensitizer with strong antidiabetic properties in mice. Nat. Med 22, 1023–1032. [DOI] [PMC free article] [PubMed] [Google Scholar]
- (19).Erickson BK, Rose CM, Braun CR, Erickson AR, Knott J, McAlister GC, Wuhr M, Paulo JA, Everley RA, and Gygi SP (2017) A Strategy to Combine Sample Multiplexing with Targeted Proteomics Assays for High-Throughput Protein Signature Characterization. Mol. Cell 65, 361–370. [DOI] [PMC free article] [PubMed] [Google Scholar]
- (20).Feller C, and Aebersold R (2018) A Proteomic Connectivity Map. Cell Syst 6, 403–405. [DOI] [PubMed] [Google Scholar]
- (21).Litichevskiy L, Peckner R, Abelin JG, Asiedu JK, Creech AL, Davis JF, Davison D, Dunning CM, Egertson JD, Egri S, Gould J, Ko T, Johnson SA, Lahr DL, Lam D, Liu Z, Lyons NJ, Lu X, MacLean BX, Mungenast AE, Officer A, Natoli TE, Papanastasiou M, Patel J, Sharma V, Toder C, Tubelli AA, Young JZ, Carr SA, Golub TR, Subramanian A, MacCoss MJ, Tsai LH, and Jaffe JD (2018) A Library of Phosphoproteomic and Chromatin Signatures for Characterizing Cellular Responses to Drug Perturbations. Cell Syst 6, 424–443. [DOI] [PMC free article] [PubMed] [Google Scholar]
- (22).Kim HS, Mendiratta S, Kim J, Pecot CV, Larsen JE, Zubovych I, Seo BY, Kim J, Eskiocak B, Chung H, McMillan E, Wu S, De Brabander J, Komurov K, Toombs JE, Wei S, Peyton M, Williams N, Gazdar AF, Posner BA, Brekken RA, Sood AK, Deberardinis RJ, Roth MG, Minna JD, and White MA (2013) Systematic identification of molecular subtype-selective vulnerabilities in non-small-cell lung cancer. Cell 155, 552–566. [DOI] [PMC free article] [PubMed] [Google Scholar]
- (23).Cadinu D, Hooda J, Alam MM, Balamurugan P, Henke RM, and Zhang L (2014) Comparative proteomic analysis reveals characteristic molecular changes accompanying the transformation of nonmalignant to cancer lung cells. EuPa Open Proteomics 3, 1–12. [Google Scholar]
- (24).Poulikakos PI, Zhang C, Bollag G, Shokat KM, and Rosen N (2010) RAF inhibitors transactivate RAF dimers and ERK signalling in cells with wild-type BRAF. Nature 464, 427–430. [DOI] [PMC free article] [PubMed] [Google Scholar]
- (25).Mitchison TJ, Pineda J, Shi J, and Florian S (2017) Is inflammatory micronucleation the key to a successful anti-mitotic cancer drug? Open Biol. 7, 170182. [DOI] [PMC free article] [PubMed] [Google Scholar]
- (26).Sathe A, Chalaud G, Oppolzer I, Wong KY, von Busch M, Schmid SC, Tong Z, Retz M, Gschwend JE, Schulz WA, and Nawroth R (2018) Parallel PI3K, AKT and mTOR inhibition is required to control feedback loops that limit tumor therapy. PLoS One 13, No. e0190854. [DOI] [PMC free article] [PubMed] [Google Scholar]
- (27).Garcia-Martinez JM, Moran J, Clarke RG, Gray A, Cosulich SC, Chresta CM, and Alessi DR (2009) Ku-0063794 is a specific inhibitor of the mammalian target of rapamycin (mTOR). Biochem. J 421, 29–42. [DOI] [PMC free article] [PubMed] [Google Scholar]
- (28).Hao Z, Zhang H, and Cowell J (2012) Ubiquitin-conjugating enzyme UBE2C: molecular biology, role in tumorigenesis, and potential as a biomarker. Tumor Biol. 33, 723–730. [DOI] [PubMed] [Google Scholar]
- (29).Huang Y, Dai Z, Barbacioru C, and Sadee W (2005) Cystine-glutamate transporter SLC7A11 in cancer chemosensitivity and chemoresistance. Cancer Res. 65, 7446–7454. [DOI] [PubMed] [Google Scholar]
- (30).Shin CS, Mishra P, Watrous JD, Carelli V, D’Aurelio M, Jain M, and Chan DC (2017) The glutamate/cystine xCT antiporter antagonizes glutamine metabolism and reduces nutrient flexibility. Nat. Commun 8, 15074. [DOI] [PMC free article] [PubMed] [Google Scholar]
- (31).Stuart JM, Segal E, Koller D, and Kim SK (2003) A gene-coexpression network for global discovery of conserved genetic modules. Science 302, 249–255. [DOI] [PubMed] [Google Scholar]
- (32).Lapek JD Jr., Greninger P, Morris R, Amzallag A, Pruteanu-Malinici I, Benes CH, and Haas W (2017) Detection of dysregulated protein-association networks by high-throughput proteomics predicts cancer vulnerabilities. Nat. Biotechnol 35, 983–989. [DOI] [PMC free article] [PubMed] [Google Scholar]
- (33).Tye BK (1999) MCM proteins in DNA replication. Annu. Rev. Biochem 68, 649–686. [DOI] [PubMed] [Google Scholar]
- (34).Bochman ML, and Schwacha A (2009) The Mcm complex: unwinding the mechanism of a replicative helicase. Microbiol Mol. Biol. Rev 73, 652–683. [DOI] [PMC free article] [PubMed] [Google Scholar]
- (35).Li N, Zhai Y, Zhang Y, Li W, Yang M, Lei J, Tye BK, and Gao N (2015) Structure of the eukaryotic MCM complex at 3.8 A. Nature 524, 186–191. [DOI] [PubMed] [Google Scholar]
- (36).Ciferri C, Musacchio A, and Petrovic A (2007) The Ndc80 complex: hub of kinetochore activity. FEBS Lett. 581, 2862–2869. [DOI] [PubMed] [Google Scholar]
- (37).Umbreit NT, Gestaut DR, Tien JF, Vollmar BS, Gonen T, Asbury CL, and Davis TN (2012) The Ndc80 kinetochore complex directly modulates microtubule dynamics. Proc. Natl. Acad. Sci. U. S. A 109, 16113–16118. [DOI] [PMC free article] [PubMed] [Google Scholar]
- (38).Tooley J, and Stukenberg PT (2011) The Ndc80 complex: integrating the kinetochore’s many movements. Chromosome Res. 19, 377–391. [DOI] [PMC free article] [PubMed] [Google Scholar]
- (39).Tapia VE, Nicolaescu E, McDonald CB, Musi V, Oka T, Inayoshi Y, Satteson AC, Mazack V, Humbert J, Gaffney CJ, Beullens M, Schwartz CE, Landgraf C, Volkmer R, Pastore A, Farooq A, Bollen M, and Sudol M (2010) Y65C missense mutation in the WW domain of the Golabi-Ito-Hall syndrome protein PQBP1 affects its binding activity and deregulates pre-mRNA splicing. J. Biol. Chem 285, 19391–19401. [DOI] [PMC free article] [PubMed] [Google Scholar]
- (40).Paschalis A, Sharp A, Welti JC, Neeb A, Raj GV, Luo J, Plymate SR, and de Bono JS (2018) Alternative splicing in prostate cancer. Nat. Rev. Clin. Oncol 15, 663–675. [DOI] [PubMed] [Google Scholar]
- (41).Orban TI, and Olah E (2003) Emerging roles of BRCA1 alternative splicing. Mol. Pathol 56, 191–197. [DOI] [PMC free article] [PubMed] [Google Scholar]
Associated Data
This section collects any data citations, data availability statements, or supplementary materials included in this article.


