Abstract
Background
Clinically, most patients of polycystic ovary syndrome (PCOS) also have insulin resistance (IR). The methods for establishing PCOS-IR animal model include using dehydroepiandrosterone (DHEA) and sodium prasterone sulfate subcutaneous injection, testosterone propionate combined with high-fat diet, and so on. This study aimed to establish an animal model of PCOS-IR using letrozole combined with a high fat diet.
Material/Methods
Study rats received 0.5% carboxymethylcellulose solution (CMC) or letrozole solution (1 mg/kg/day), with normal diet as control group and a high fat diet as the model group, for 21, 24, 27, and 30 days. The body weight and length were measured weekly. On Day 22, 25, 28 and 31, the weight, and the short and long diameters of the rat ovaries were measured, and blood samples were collected for the measurement of fasting plasma glucose (FPG), fasting insulin (FINS), triglyceride (TG), luteinizing hormone (LH), follicle stimulating hormone (FSH), and testosterone (T). Ovarian tissue was collected for paraffin sectioning and hematoxylin and eosin (H&E) staining.
Results
In model groups, rats’ weight was significantly increased (P<0.05). On Day 28 and 31, the weight, Lee’s index, and ovarian volume significantly increased compared with Day 22 (P<0.05). There were more dense transparent saclike follicles on the ovary surface under the microscope in model groups. Levels of LH/FSH, T, and TG were substantially increased (P<0.05), but levels of FINS and HOMA-IR were significantly increased (P<0.05) on Day 28 and 31 in the model groups.
Conclusions
This study implied that letrozole combined with a high fat diet for 27 days could induce the PCOS-IR rat model which has the characteristics of ovarian polycystic changes and endocrine and metabolic disorders.
MeSH Keywords: Diet, High-Fat; Insulin Resistance; Models, Animal; Polycystic Ovary Syndrome
Background
Polycystic ovary syndrome (PCOS) is a common endocrine disorder in gynecology, characterized by persistent anovulation, high androgen, ovarian polycystic changes, and always combined with insulin resistance (IR) and obesity, with an incidence of 15% to 20% [1]. It is considered one of the causes of menstrual disorders and infertility in adolescent and women of fertile age. For obese PCOS patients whose insulin sensitivity is reduced, and whose IR is more pronounced, the reproductive dysfunction is more serious. IR and hyperinsulinemia can cause excessive ovulation and reproductive dysfunction in the body, which can continue to aggravate IR, causing a vicious circle of pathological conditions, leading to PCOS-IR. The pathological mechanism of PCOS-IR continues to develop, and eventually can lead to long-term complications such as fatty liver, diabetes, hypertension, coronary heart disease, endometrial cancer, and metabolic syndrome [2]. PCOS-IR is characterized by high incidence, heterogeneity, and refractory. PCOS-IR has numerous clinical challenges and a complicated pathogenesis, so it is also a hot spot in endocrine and metabolic research. Therefore, a stable ideal PCOS-IR rat model is needed for exploring the pathogenesis of PCOS-IR and the mechanism of action of drugs for treatment of this disease.
The diagnostic criteria for PCOS-IR requires both PCOS and IR diagnostics. Based on a global network survey, the Rotterdam standard is currently the most widely accepted diagnostic standard for PCOS [3]. The diagnostic criteria are as follows: 1) rare ovulation or anovulation; 2) clinical and/or biochemical signs of high androgen; 3) ovarian polycystic changes under ultrasound: ≥1 2 follicles with a diameter of 2 to 9 mm in one or both ovaries, and/or ovarian volume >10 cm3. It can be diagnosed as PCOS if it meets any 2 items and excludes other diseases that cause androgen excess and low gonadotropin anovulation and premature ovarian failure. At present, there is no internationally unified IR diagnostic standard, and insulin sensitivity varies greatly among people of different ages. It is generally believed that fasting insulin (FINS) levels are higher than 15 mIU/L. While fasting plasma glucose (FPG) is normal, and insulin resistance is diagnosed [4]. IR can also be evaluated by the HOMA-IR [HOMA-IR=FPG (mmol/L)×FINS (mIU/L)/22.5]. The normal individual has a HOMA-IR index of 1, and its data is positively correlated with IR. If HOMA-IR ≥1.66, it can be diagnosed as IR [5].
Recently, many research studies have reported methods for establishing a PCOS-IR animal model. For example, some researchers established PCOS rat models by subcutaneous injection of dehydroepiandrosterone (DHEA) [6]. It has also been reported that a PCOS rat model can be successfully induced by intragastric administration of letrozole for 21 days [7]. However, the PCOS-IR rat model needs to be selected from PCOS rats with hyperinsulinemia. And it also has been reported that a PCOS-IR rat model can be established by subcutaneous injection of testosterone propionate combined with a high-fat diet [8]. These rats had similar features to PCOS pathology and endocrine disorder, but the androgen externally supplemented might affect the endocrine level of PCOS.
In this study, an animal model of PCOS-IR was established by using letrozole combined with a high-fat diet, and the time of preparation of our PCOS-IR model and its changes in endocrine levels and metabolism were also explored. Aromatase is a rate-limiting enzyme that plays an essential role in the conversion of androgens to estrogens. And letrozole is an effective aromatase inhibitor. It blocks the conversion of androgen into estrogen in the rat ovary, and eventually develops hyperandrogenism and ovarian polycystic changes, which has been widely used as a rat model for PCOS [9]. The changes in endocrine characteristics and ovarian morphological, which are similar to PCOS, include hyperandrogenemia, ovulation disorder, obesity, and so on. Recent studies indicated that a high fat diet can induce hypothalamic inflammatory reaction and lead to abnormal glucose and lipid metabolism in the body, as a result, obesity and insulin resistance (IR) were induced [10,11]. At present, numerous studies have successfully established a rat model for PCOS. However, there is no credible method established for a PCOS-IR rat model. This study established a PCOS-IR rat model by using the letrozole combined with a high fat diet.
Material and Methods
Animals
Forty-eight specific pathogen free (SPF) female Sprague-Dawley rats 6 to 8 weeks old were purchased from Beijing HFK Bioscience (China, Beijing, License NO. SCXK 2018-0006). They were raised in the SPF animal laboratory, with free access to water and food. After 1 week, the rats were numbered according to their weight and randomly divided into 2 groups: control group (n=24) and model group (n=24).
Establishment of the PCOS-IR model in rats
The rats in the control group daily received 0.5% carboxymethylcellulose (CMC)-Na (1 mL/100 g/day, USA, SIGAMA, NO. 1002375619) solution by intragastric administration and with normal diet and free water (H10010: 3.85 Kal/g, protein 20%, carbohydrate 70%, fat 10%; China, Beijing, HFK) for 21, 24, 27, and 30 days (each n=6). The rats in the model group daily received letrozole (1 mg/kg/day, China, Jiangsu, HENGRUI MEDICINE, NO. HI9991001) solution by intragastric administration and with high fat diet and free water (H10060: 5.24 Kal/g, protein 20%, carbohydrate 20%, fat 60%; China, Beijing, HFK) for 21, 24, 27, and 30 days (each n=6).
Measurement of body weight and length of the rats
The body weight and length (straight line from nose to anus) of rats were measured weekly, and the rat weight gain curve was drawn and the Lee’s index [Lee’s=(weight×1000)^(1/3)/length] was calculated [12] (Lee’s index was used as an indicator to evaluate the degree of obesity in adult obese model rats).
Sample preparation
The rats in both groups were fasted for 8 hours on the Day 22, 25, 28, and 31. Blood was collected from the tail, and FPG was measured and recorded using a Roche active blood glucose meter. Then the rats were anesthetized by intraperitoneal injection of 2% sodium pentobarbital (0.2 mL/100 g), and 5 to 8 mL of abdominal aortic blood was taken. Then the serum was collected by centrifugation at 3000 rpm for 15 minutes. One side of their ovaries was removed and fixed in 4% paraformaldehyde for 48 hours, and then the ovaries were dehydrated and embedded in paraffin.
Weight, volume, and histopathological examination of rat ovary
On Day 22, 25, 28, and 31, the left ovary of each rat was removed for weighing and measuring long and short diameters. And then ovarian index (=ovary weight/weight×100) and ovarian volume [mm3=(ρ/6)×long (mm)×short (mm)2] were calculated. Ovarian tissue was cut into 5 μm tissue sections with paraffin slicer and stained with hematoxylin and eosin (H&E) for pathological observation using an optical microscope. The number of follicles was recorded in ovarian tissue of each rat at low magnification.
Detection of serum sex hormones, INS, triglyceride (TG) in rats by enzyme-linked immunosorbent assay (ELISA)
The levels of testosterone (T), FSH, luteinizing hormone (LH), FINS, and triglyceride (TG) were determined using the enzyme-linked immunosorbent assay (ELISA) kit (Table 1). And then LH/follicle stimulating hormone (FSH) and HOMA-IR index were calculated. [HOMA-IR=FPG (mmol/L)×FINS (mIU/L)/22.5].
Table 1.
The ELISA kit of INS, TG, FSH, LH, and T.
| ELISA kits | Company | NO. |
|---|---|---|
| Rat Insulin ELISA kit | Excell Bio | ER010-96 |
| Triglyceride ELISA kit | Biokits Technologies Inc | BCBU010-96 |
| Follicle stimulating hormone ELISA kit | Endocrinetech | ERK R7014 |
| Luteinizing hormone ELISA kit | Endocrinetech | ERK R7017 |
| Testosterone ELISA kit | Biokits Technologies Inc | EU04 |
ELISA – enzyme-linked immunosorbent assay; INS – insulin; TG – triglyceride; FSH – follicle stimulating hormone; LH – luteinizing hormone; T – testosterone.
Experimental instruments and equipment
Ultra-low temperature refrigerator, tissue dehydrator, the paraffin embedding machine, paraffin slicer, an image analysis system, ultraviolet spectrophotometer, high-speed refrigerated centrifuge and other equipment were provided by the laboratory platform of Beijing Institute of Traditional Chinese Medicine.
Ethics
Ethics Committee Approval was granted from the Animal Care and Scientific Committee of Capital Medical University (Beijing Institute of Traditional Chinese Medicine, number: 2018050101).
Information of informed consent
This study does not involve informed consent information, because it is an animal experimental study.
Statistical analyses
Statistical analysis was performed using GraphPad Prism 7 and SPSS 17.0. All data were expressed as mean±standard deviation (χ̄±s), t-test was used for comparison between the 2 groups, one-way analysis of variance (ANOVA) was used for comparison between groups, and repeated measurement data was used for analysis of repeated measures. The difference was statistically significant at P<0.05.
Results
General condition of each group of rats
All rats had no discomfort during the experiment, and the diet, water, and activities were freely available. There were not any rats that died during the experiment.
Comparison of weight and Lee’s index in the 2 groups
The variance analysis method of repeated measures was utilized to compare the weight and Lee’s index on Day 1, 8, and 15. The results showed that the weight and Lee’s index of rats in the 2 groups increased significantly with the increase of administrative time (weight: F=45.810, P=0.000; Lee’s index: F=8.347, P=0.008). As shown in Figure 1A and Table 2, the results showed that the weight of the model rats was significantly higher than that of the control rats after 7 days; while as showed in Figure 1B, Lee’s index results showed that the model rats were significantly higher weight than the control rats after 14 days. As shown in Tables 3 and 4, the weight and Lee’s index of the rats in the model groups on Day 28 and 31 were significantly higher than on Day 22 (P<0.05) (Figure 1, Table 2).
Figure 1.
(A)The weight of rats between the 2 groups; (B) The Lee’s index of rats between the 2 groups; number, n=6, mean±standard deviation.
Table 2.
The weight and Lee’s index of rats in the 2 groups on Day 1, Day 8, and Day 15 (n=24, mean±SD).
| Groups | Weight/g | Lee’s index | ||||
|---|---|---|---|---|---|---|
| Day 1 | Day 8 | Day 15 | Day 1 | Day 8 | Day 15 | |
| Control | 181.74±9.59 | 207.77±11.71 | 224.73±14.60 | 3.12±0.14 | 3.16±0.10 | 2.93±0.07 |
| Model | 183.60±9.50 | 229.43±9.24* | 271.18±13.16* | 3.10±0.10 | 3.13±0.14 | 3.15±0.07* |
| t | 0.632 | 6.772 | 10.120 | 0.982 | 1.131 | 10.480 |
| P | 0.530 | 0.000 | 0.000 | 0.331 | 0.2638 | 0.000 |
P<0.05 versus control. SD – standard deviation.
Table 3.
The weight (g) of rats in the 2 groups on Day 22, Day 25, Day 28, and Day 31 (n=6, mean±SD).
| Groups | Day 22 | Day 25 | Day 28 | Day 31 | F | P |
|---|---|---|---|---|---|---|
| Control | 240.67±25.82 | 221.00±16.16 | 263.65±17.70 | 248.90±9.43 | 16.540 | 0.000 |
| Model | 303.30±19.65* | 300.62±22.51* | 313.12±17.67*,# | 308.37±20.11*,# | 2.587 | 0.064 |
| t | 11.460 | 7.037 | 5.278 | 6.193 | ||
| P | 0.000 | 0.000 | 0.000 | 0.000 |
P<0.05 versus control;
P<0.05 versus Day 22. SD – standard deviation.
Table 4.
The Lee’s index (%) of rats in the 2 groups on Day 22, Day 25, Day 28, and Day 31 (n=6, mean±SD).
| Groups | Day 22 | Day 25 | Day 28 | Day 31 | F | P |
|---|---|---|---|---|---|---|
| Control | 3.04±0.10 | 2.98±0.08 | 3.16±0.10 | 63.12±0.03 | 11.000 | 0.000 |
| Model | 3.23±0.08* | 3.28±0.09 | 3.34±0.09*,# | 3.37±0.11*,# | 21.070 | 0.000 |
| t | 6.503 | 0.021 | 2.797 | 4.268 | ||
| P | 0.000 | 0.9839 | 0.021 | 0.002 |
P<0.05 versus control;
P<0.05 versus Day 22. SD – standard deviation.
Comparison of ovarian weight and ovarian volume in the 2 groups
The rats were anesthetized abdominally on Day 22, 25, 28, and 31, then the ovaries were removed and weighed. Long and short diameter of the ovaries were measured using a ruler. As shown in Figure 2A and Table 5, the ovarian weight on Day 28 and 31 was significantly increased in the model group (P<0.05). As shown in in Figure 2B and Table 6, ovarian volume of rats in all model groups significantly increased compared with all control groups (P<0.05). In all the model groups, the ovarian volume of rats on Day 28 and 31 was significantly increased (P<0.05).
Figure 2.
(A) The weight of rat ovarian between the 2 groups; (B) The volume of rat ovarian between the 2 groups; number, n=6, mean±standard deviation, * P<0.05 versus control group; # P<0.05 versus Day 22.
Table 5.
The ovary weight (mg) of rats in the 2 groups on Day 22, Day 25, Day 28, and Day 31 (n=6, mean±SD).
| Groups | Day 22 | Day 25 | Day 28 | Day 31 | F | P |
|---|---|---|---|---|---|---|
| Control | 46.58±4.37 | 47.45±8.56 | 62.59±5.02 | 69.17±5.92 | 19.81 | 0.000 |
| Model | 69.53±13.27* | 68.07±10.43* | 78.10±6.24* | 80.58±9.65* | 2.447 | 0.091 |
| t | 4.024 | 3.742 | 4.982 | 2.471 | ||
| P | 0.002 | 0.004 | 0.000 | 0.033 |
P<0.05 versus control. SD – standard deviation.
Table 6.
The ovary volume (mm3) of rats in the 2 groups on Day 22, Day 25, Day 28, and Day 31 (n=6, mean±SD).
| Groups | Day 22 | Day 25 | Day 28 | Day 31 | F | P |
|---|---|---|---|---|---|---|
| Control | 46.58±4.37 | 47.45±8.56 | 62.59±5.02 | 69.17±5.92 | 19.81 | 0.000 |
| Model | 69.53±13.27* | 68.07±10.43* | 78.10±6.24* | 80.58±9.65* | 2.447 | 0.091 |
| t | 4.024 | 3.742 | 4.982 | 2.471 | ||
| P | 0.002 | 0.004 | 0.000 | 0.033 |
P<0.05 versus control;
P<0.05 versus Day 22. SD – standard deviation.
The observation of ovarian tissue morphology and the differences in all kinds of follicles in the 2 groups
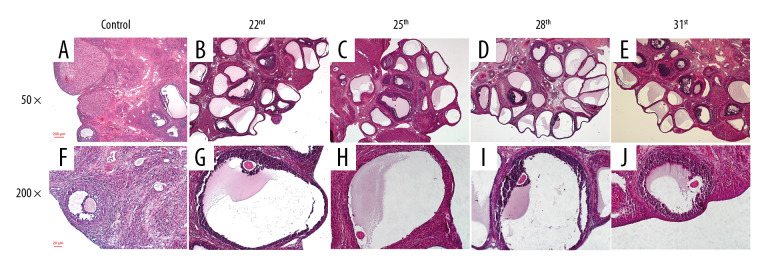
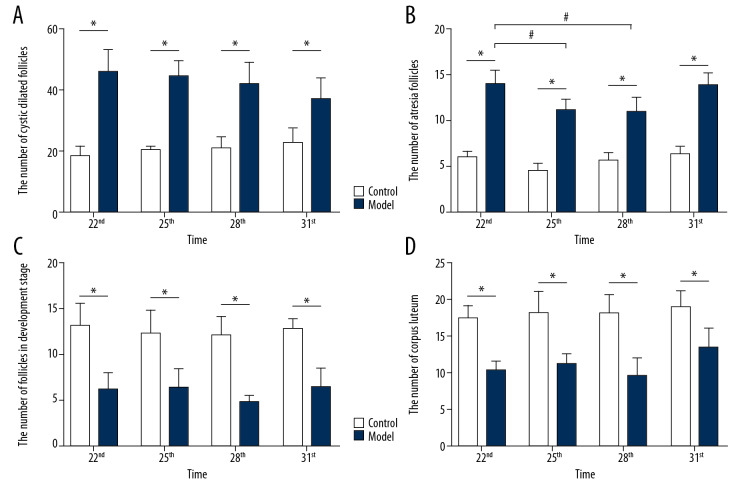
In this study, the rat model of letrozole-induced PCOS was established to explore the changes of ovarian morphological. This study revealed that the rats in the control group had normal ovarian morphology and ovary color. However, in the model group, multiple transparent cystic dilated follicles were found to be densely distributed on the ovarian surface, and the ovarian morphology was polycystic and the ovary color was pale. H&E staining found that the pathological changes of ovaries in the rat with letrozole-induced PCOS were structural abnormalities: immature follicles and atresia follicles significantly increased, multiple cystic dilated follicles appeared on the surface of the ovaries, and follicles and corpus luteum in development stage were significantly reduced. Microscopy (200×) showed that the structure of the follicles in the control group was intact with 8 to 9 layers of granulosa cells. However, in the model group, the granular cell layer and radioactive crowns in the follicles were significantly decreased or disappeared (Figure 3). As shown in Figure 4A, the number of cystic dilated follicles on the ovary surface of rats in all the model groups was significantly increased (P<0.05). All model groups at different time periods had no significant differences (F=1.674, P=0.212). As shown in Figure 4B, the number of atresia follicles in the ovaries of all the model groups was significantly increased (P<0.05). In all the model groups, the atresia follicles of rats on Day 22 and Day 31 were significantly increased (F=8.799, P=0.001). As shown in Figure 4C, the number of follicles in the development stage in the ovaries of all the model groups was significantly reduced (P<0.05). All the model groups at different time periods had no significant differences (F=1.783, P=0.179). As shown in Figure 4D, the corpus luteum in the ovaries of all the model groups was significantly reduced (P<0.05). In all the model groups, the corpus luteum of rats on Day 31 was significantly reduced (F=4.974, P=0.009).
Figure 3.
The change of rat ovarian tissue pathological in the 2 groups. (A) 50×, the ovarian of rats in the control group on Day 31; (B) 50×, the ovarian of rats in the model group on Day 22. (C) 50×, the ovarian of rats in the model group on Day 25; (D) 50×, the ovarian of rats in the model group on Day 28; (E) 50×, the ovarian of rats in the model group on Day 31; (F) 200×, the ovarian of rats in the control group on Day 31; (G) 200×, the ovarian of rats in the model group on Day 22; (H) 200×, the ovarian of rats in the model group on Day 25; (I) 200×, the ovarian of rats in the model group on Day 28; (J) 200×, the ovarian of rats in the model group on Day 31.
Figure 4.
The differences in all kinds of follicles of rat ovarian tissue. (A) The number of cystic dilated follicles on the ovary surface of rats; (B) The number of atresia follicle on the ovary surface of rats; (C) The number of follicles in development stage in the ovaries of rats; (D) The number of corpus luteum in the ovaries of rats; number, n=6, mean±standard deviation, * P<0.05 versus control; # P<0.05 versus Day 22.
The level of FPG, FINS, HOMA-IR, and TG in the 2 groups
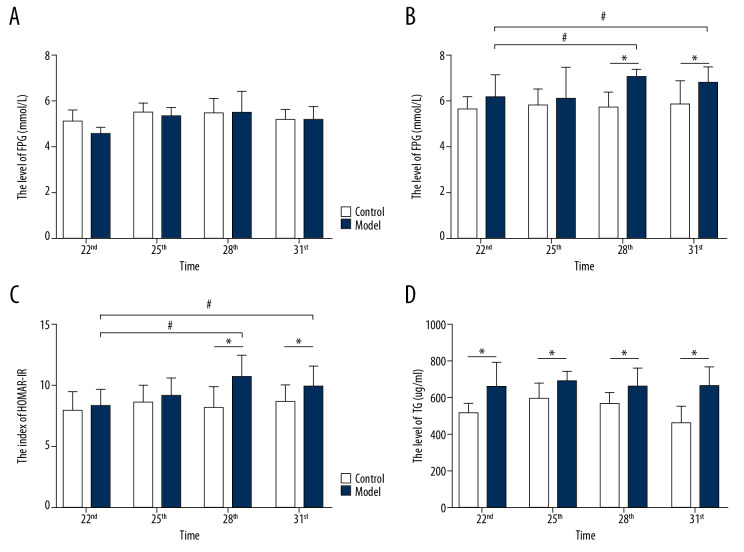
In this study, we established a rat model of letrozole combined with a high fat diet induced PCOS-IR to investigate the changes in endocrine and metabolism. As shown in Figure 5A, there was no significant difference in the FPG level of rats in the 2 groups (F=0.925, P=0.453). As shown in Figure 5B and Figure 5C, the levels of FINS and HOMA-IR of rats in the model group were significantly increased compared with the control group on Day 28 and Day 31 (P<0.05). In all the model groups, levels of FINS and HOMA-IR of rats were significantly increased on Day 28 and Day 31 compared with Day 22 (P<0.05). This study detected the level of TG in PCOS-IR rats by ELISA. As shown in Figure 5D, the level of TG in the rats with letrozole and a high fat diet induced PCOS-IR model was significantly increased (P<0.05). However, there was no significant differences in TG levels in all the model groups (F=0.037, P=0.99).
Figure 5.
The levels of FPG, FINS, HOMA-IR and TG in rat serum. (A) The level of FPG in rats between the 2 groups; (B) The level of FINS in rats between the 2 groups; (C) The index of HOMA-IR in rats between the 2 groups; (D) The level of TG in rats between the 2 groups; number, n=6, mean±standard deviation, * P<0.05 versus control; # P<0.05 versus Day 22. FPG – fasting plasma glucose; FINS – fasting insulin; TG – triglyceride.
The level of FSH, LH, LH/FSH, and testosterone (T) in the 2 groups
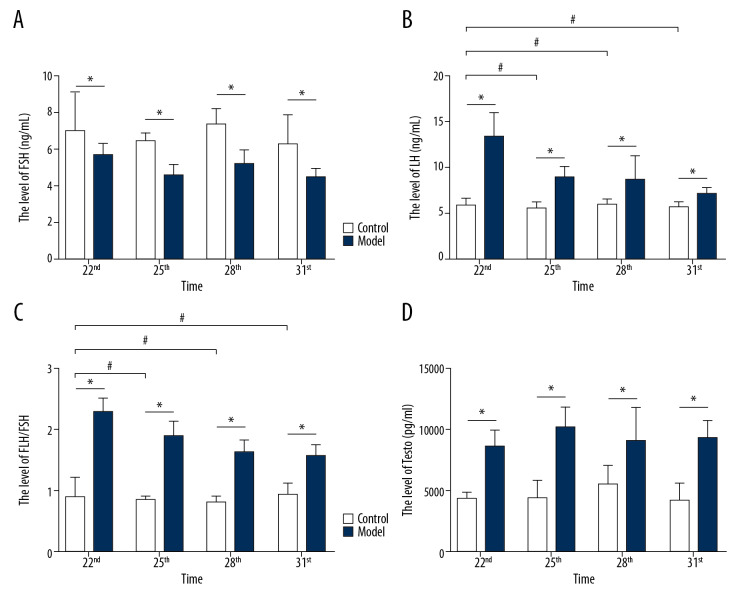
This study successfully replicated the abnormal state of sex hormone secretion of PCOS-IR rats. As shown in Figure 6A, the level of FSH in rats with letrozole and a high fat diet induced PCOS-IR model was significantly decreased (P<0.05) on Day 25, Day 28, and Day 31. And in all the model groups, the level of FSH was significantly higher on Day 22 and Day 28 compared to Day 25 and Day 31. As shown in Figure 6B–6D, the levels of LH, LH/FSH, and T in the rats in the letrozole and a high fat diet-induced PCOS-IR model were significantly increased (P<0.05) on Day 22, Day 25, Day 28, and Day 31. And in all the model groups, the levels of LH and LH/FSH increased significantly on Day 25, Day 28, and Day 31 compared with Day 22.
Figure 6.
The levels of LH, FSH, LH/FSH and T in rat serum. (A) The level of LH in rats between the 2 groups; (B) The level of FSH in rats between the 2 groups; (C) The index of LH/FSH in rats between the 2 groups; (D) The level of T in rats between the 2 groups; number, n=6, mean±standard deviation, * P<0.05 versus control; # P<0.05 versus Day 22. LH – luteinizing hormone; FSH – follicle stimulating hormone; T – testosterone.
Discussion
Recently, more and more studies have proven that IR is closely related to PCOS in occurrence and development. However, the clinical manifestations of PCOS-IR have been associated with complex pathogenesis. Thus, the difficulty of the treatment of gynecological diseases has focused on PCOS-IR, and it has also been a hot spot in endocrine and metabolism research in recent years. Metformin hydrochloride was the first choice for treatment of PCOS-IR. It could reduce the state of insulin resistance and promote ovulation. However, it often caused gastrointestinal discomfort, which would decrease the patient’s medication compliance, and the long-term effect was unsatisfactory.
In order to further understanding of the mechanisms of PCOS-IR and explore effective treatment methods, it is necessary to establish an ideal animal model. Because the pathogenesis of PCOS-IR is still unclear, it has been difficult to establish an animal model that can fully simulate the pathological manifestations of PCOS-IR. At present, researchers have established several animal models of PCOS-IR, including DHEA subcutaneous injection [13], testosterone propionate combined with high-fat diets [8], and injection of prasodone sulfate [14], subcutaneous implanted contraceptive rods combined with human chorionic gonadotropin (HCG) injection [15], letrozole by intragastric administration [16], and so on. But they can only mimic the clinical characteristics of PCOS-IR in some aspects. Although there are many methods, none are perfect: some drugs (e.g., prastorone sulfate sodium) are not easily available; some injection oils cause subcutaneous nodules; and some ovarian histological changes do not match the disease after modeling. In our previous preliminary experiments, our team used testosterone propionate combined with high-fat feed to build a model. As a result, the ovarian volume became smaller without obvious polycystic changes. Thus, the analysis may be related to the inhibition of ovarian function by exogenous androgens. One research reported inducing a PCOS-IR rat model by using letrozole combined with high-fat diet for 21 days [17]. In our study, we found that by using this method for 21 days, all rats in the model group were close to the clinical manifestations of PCOS in terms of serum sex hormones and local morphology of ovaries, but only a few rats had hyperinsulinemia. Therefore, this study extended the modeling time to 30 days, and demonstrated observed changes in serum sex hormones, blood glucose, insulin levels, and local ovarian morphology in the model group rats at different time periods. The purpose of this study was to use a scientific method to determine a reasonable and stable PCOS-IR rat model replication time and its endocrine, metabolic, and ovarian pathological changes.
This study showed that letrozole combined with a high-fat diet for 21, 24, 27, and 30 days resulted in body weight and Lee’s index of the rats in each model group to be significantly increased compared with the control group. In the model group, ovarian volume of the rats was significantly increased, and there were dense transparent cystic dilated follicles on the surface of the ovary (P<0.05). And the ovaries of letrozole and a high-fat diet induced-PCOS-IR rats showed polycystic changes and the number of follicles increased significantly under the microscope (P<0.05). This study found that the levels of LH/FSH, testosterone, and TG were significantly increased in PCOS-IR rats on Day 22, Day 25, Day 28, and Day 31 (P<0.05). However, levels of FINS and HOMA-IR were significantly increased in PCOS-IR rats on Day 28 and Day 31 (P<0.05), and it conformed to the pathological characteristics of long-term, complex, and endocrine and metabolic disorders of PCOS-IR.
Conclusions
This work found that letrozole combined with a high fat diet for 27 days could induce a PCOS-IR rat model which had the characteristics of ovarian polycystic changes and endocrine and metabolic disorders. This PCOS-IR rat model could provide a good foundation for exploring some potential drugs with therapeutic value for PCOS-IR.
Footnotes
Conflict of interest
None.
Source of support: National Natural Science Foundation of China (No. 81674010)
References
- 1.Cassar S, Misso ML, Hopkins W, et al. Insulin resistance in polycystic ovary syndrome: A systematic review and meta-analysis of euglycaemic-hyperinsulinaemic clamp studies. Hum Reprod. 2016;31(11):2619–31. doi: 10.1093/humrep/dew243. [DOI] [PubMed] [Google Scholar]
- 2.Li MF, Zhou XM, Li XL. The effect of berberine on polycystic ovary syndrome patients with insulin resistance (PCOS-IR): A meta-analysis and systematic review. Evid Based Complement Alternat Med. 2018;2018 doi: 10.1155/2018/2532935. 2532935. [DOI] [PMC free article] [PubMed] [Google Scholar]
- 3.Ning N, Balen A, Brezina PR, et al. How to recognize PCOS: Results of a web-based survey at IVF-worldwide.com. Reprod Biomed Online. 2013;26(5):500–5. doi: 10.1016/j.rbmo.2013.01.009. [DOI] [PubMed] [Google Scholar]
- 4.Jeanes YM, Reeves S. Metabolic consequences of obesity and insulin resistance in polycystic ovary syndrome: Diagnostic and methodological challenges. Nutr Res Rev. 2017;30(1):97–105. doi: 10.1017/S0954422416000287. [DOI] [PubMed] [Google Scholar]
- 5.Tosi F, Di Sarra D, Kaufman JM, et al. Total body fat and central fat mass independently predict insulin resistance but not hyperandrogenemia in women with polycystic ovary syndrome. J Clin Endocrinol Metab. 2015;100(2):661–69. doi: 10.1210/jc.2014-2786. [DOI] [PubMed] [Google Scholar]
- 6.Neisy A, Zal F, Seghatoleslam A, et al. Amelioration by quercetin of insulin resistance and uterine GLUT4 and ER alpha gene expression in rats with polycystic ovary syndrome (PCOS) Reprod Fertil Dev. 2019;31(2):315–23. doi: 10.1071/RD18222. [DOI] [PubMed] [Google Scholar]
- 7.Chen L, Hu LM, Wang YF, et al. Effect of sodium aescinate treatment on PCOS rat model with insulin resistance. Bratisl Lek Listy. 2017;118(4):223–27. doi: 10.4149/BLL_2017_044. [DOI] [PubMed] [Google Scholar]
- 8.Ding Y, Jiang Z, Xia B, et al. Mitochondria-targeted antioxidant therapy for an animal model of PCOS-IR. Int J Mol Med. 2019;43(1):316–24. doi: 10.3892/ijmm.2018.3977. [DOI] [PMC free article] [PubMed] [Google Scholar]
- 9.Iqbal R, Jain GK, Siraj F, Vohora D. Aromatase inhibition by letrozole attenuates kainic acid-induced seizures but not neurotoxicity in mice. Epilepsy Res. 2018;143:60–69. doi: 10.1016/j.eplepsyres.2018.04.004. [DOI] [PubMed] [Google Scholar]
- 10.DeBoer MD. Assessing and managing the metabolic syndrome in children and adolescents. Nutrients. 2019;11(8) doi: 10.3390/nu11081788. pii: E1788. [DOI] [PMC free article] [PubMed] [Google Scholar]
- 11.Huang R, Zheng J, Li S, et al. Characteristics and contributions of hyperandrogenism to insulin resistance and other metabolic profiles in polycystic ovary syndrome. Acta Obstet Gynecol Scand. 2015;94(5):494–500. doi: 10.1111/aogs.12612. [DOI] [PubMed] [Google Scholar]
- 12.Rao JY, Yeriswamy MC, Santhosh MJ, et al. A look into Lee’s score: Peri-operative cardiovascular risk assessment in non-cardiac surgeries – usefulness of revised cardiac risk index. Indian Heart J. 2012;62(2):134–38. doi: 10.1016/S0019-4832(12)60047-9. [DOI] [PMC free article] [PubMed] [Google Scholar]
- 13.Kim EJ, Jang M, Choi JH, et al. An improved dehydroepiandrosterone-induced rat model of polycystic ovary syndrome (PCOS): Post-pubertal improve PCOS’s features. Front Endocrinol (Lausanne) 2018;9:735. doi: 10.3389/fendo.2018.00735. [DOI] [PMC free article] [PubMed] [Google Scholar]
- 14.Li Q, Huang DM, Lu FE. [Effect of bushen tongmai recipe on insulin resistance and ovulation dysfunction in PCOS rats accompanied with insulin resistance]. Zhongguo Zhong Xi Yi Jie He Za Zhi. 2009;29(8):733–36. [PubMed] [Google Scholar]
- 15.Gompel A, Piette JC. Is there a place for postmenopausal hormone therapy use in women with lupus? Panminerva Med. 2008;50(3):247–54. [PubMed] [Google Scholar]
- 16.Kakadia N, Patel P, Deshpande S, Shah G. Effect of Vitex negundo L. seeds in letrozole induced polycystic ovarian syndrome. J Tradit Complement Med. 2019;9(4):336–45. doi: 10.1016/j.jtcme.2018.03.001. [DOI] [PMC free article] [PubMed] [Google Scholar]
- 17.Qiu Z, Dong J, Xue C, et al. Liuwei Dihuang pills alleviate the polycystic ovary syndrome with improved insulin sensitivity through PI3K/Akt signaling pathway. J Ethnopharmacol. 2019;250:111965. doi: 10.1016/j.jep.2019.111965. [DOI] [PubMed] [Google Scholar]


