Abstract
Background:
We have recently shown that a novel signalling kinase, inositol hexakisphosphate kinase 1 (IP6K1), is implicated in whole-body insulin resistance via its inhibitory action on Akt. Insulin and insulin like growth factor 1 (IGF-1) share many intracellular processes with both known to play a key role in glucose and protein metabolism in skeletal muscle.
Aims:
We aimed to compare IGF/IP6K1/Akt signalling and the plasma proteomic signature in individuals with a range of BMIs after ingestion of lean meat.
Methods:
Ten lean [Body mass index (BMI) (in kg/m2): 22.7 ± 0.4; Homeostatic model assessment of insulin resistance (HOMAIR): 1.36 ± 0.17], 10 overweight (BMI: 27.1 ± 0.5; HOMAIR: 1.25 ± 0.11), and 10 obese (BMI: 35.9 ± 1.3; HOMAIR: 5.82 ± 0.81) adults received primed continuous L-[ring-13C6]phenylalanine infusions. Blood and muscle biopsy samples were collected at 0 min (post-absorptive), 120 min and 300 min relative to the ingestion of 170 g pork loin (36 g protein and 5 g fat) to examine skeletal muscle protein signalling, plasma proteomic signatures, and whole-body phenylalanine disappearance rates (Rd).
Results:
Phenylalanine Rd was not different in obese compared to lean individuals at all time points and was not responsive to a pork ingestion (basal, P = 0.056; 120 & 300min, P > 0.05). IP6K1 was elevated in obese individuals at 120 min post-prandial vs basal (P < 0.05). There were no acute differences plasma proteomic profiles between groups in the post-prandial state (P > 0.05).
Conclusions:
These data demonstrate, for the first time that muscle IP6K1 protein content is elevated after lean meat ingestion in obese adults, suggesting that IP6K1 may be contributing to the dysregulation of nutrient uptake in skeletal muscle. In addition, proteomic analysis showed no differences in proteomic signatures between obese, overweight or lean individuals.
Keywords: insulin resistance, obesity, amino acids, anabolic resistance, IP6K1
Introduction
Obesity and increased fat mass are associated with impaired metabolic function in a variety of tissue types, which can result in a range of diseases including metabolic syndrome and type 2 diabetes (Golay et al., 1986; Stumvoll et al., 2005). In skeletal muscle, decreased insulin-stimulated glucose uptake in obese individuals is partly caused by reduced insulin receptor substrate 1 (IRS-1) and post receptor activity (Golay et al., 1986; DeFronzo & Tripathy, 2009). In healthy humans and animals, it has been shown that insulin and IGF-1 have important roles in the activation of Akt and mechanistic target of rapamycin complex 1 (mTORC1) (Svanberg et al., 1996; Greenhaff et al., 2008). The mTORC1 pathway has been shown to have an important role in the regulation of post-prandial (Dickinson et al., 2011), but not basal (Dickinson et al., 2013), muscle protein synthesis rates. Given that obesity contributes to insulin resistance and insulin and IGF-1 activate mTORC1 through a similar intracellular mechanism, there is likely a link between altered IGF-1 signalling, coupled with reduced insulin action, and the reduced post-prandial mTORC1 signalling previously observed in people with excess adiposity (Beals et al., 2016).
Using rodent models, O’Neill et al., (2015) demonstrated the synergistic roles of insulin-like growth factor 1 receptor (IGFR) and IRS-1 in the maintenance of skeletal muscle mass and function. Altered expression of IRS-1/IGFR results in reduced glucose and protein synthesis, with the knockout of both receptors resulting in skeletal muscle atrophy whilst over expression of IGFR induces glucose intolerance (O’Neill et al., 2015). Currently, it is unknown if differences exist in muscle IGFR in insulin resistant obese when compared to healthy and overweight individuals. In addition, evidence in rodent and in vitro models suggests that inositol hexakisphosphate kinase 1 (IP6K1) reduces insulin sensitivity and inhibits glucose uptake (Bhandari et al., 2008; Chakraborty et al., 2010). This is supported by recent work from our laboratory which showed decreased IP6K1 skeletal muscle content and improved insulin sensitivity in response to muscle contraction in pre-diabetic humans (Naufahu et al., 2018). IP6K1 is known to synthesize IP6 to IP7 which binds to the pleskstrin homology (PH) domain of Akt, preventing translocation to the cell membrane (Chakraborty et al., 2010). This mechanism results in decreased Akt phosphorylation owing to reduced PIP3 binding to the PH domain (Chakraborty et al., 2010; Naufahu et al., 2018). However, the impact of increasing adiposity on whole body amino acid kinetics and muscle IGF-1/IP6K1/Akt signalling pathway in humans in the basal and postprandial-states has not been characterized.
Given that both IRS-1 and IGF-1 signalling pathways converge on Akt to induce numerous post-prandial metabolic responses, we aimed to investigate the role IP6K1 may play on both muscle IGF-1/Akt signalling and skeletal muscle phenylalanine uptake in overweight and obese individuals, previously shown to have dysregulated mTORC1 signalling (Beals et al., 2016), in response to lean meat ingestion. Moreover, we examined whether there was an interaction between excess adiposity and changes in the postprandial proteome after high quality meat ingestion to improve our understanding of circulating protein factors that may contributed to dysregulated metabolism in adults with excess fat mass (Alfadda et al., 2017; Beals et al., 2017; Beals et al., 2016; Halton & Hu, 2004). We hypothesised that insulin-resistant humans would display a divergent postprandial circulating proteome and reduced whole body phenylalanine uptake in response to lean meat ingestion which would be coupled with altered muscle IGF-1/IP6K1/Akt signalling when compared to lean adults.
Materials and Methods
Participants and Ethical Statement
Ten normal weight (lean), 10 overweight (OW), and 10 obese (OB) young men and women volunteered to participate in this study. These participants were part of a larger investigation being conducted in our laboratories to investigate the impact of adiposity on skeletal muscle mass regulation to anabolic stimuli (Beals et al., 2016). Participant characteristics have been described previously (Beals et al., 2016) and the groups were counterbalanced for age and sex (Beals et al., 2017; Beals et al., 2016). In short, participants with cardiovascular disease, diabetes mellitus, chronic smoker/tobacco use, uncontrolled hypertension, or on medications known to affect protein metabolism (corticosteroids, androgen/estrogen containing compounds) were excluded from the study. Furthermore, all participants were classified as sedentary, deemed healthy by health screen questionnaire and had not previously taken part in any amino acid tracer study. Prior to commencing experimental procedures, written informed consent was gained from all volunteers and ethical approval was obtained by the Institutional Review Board at University of Illinois. All procedures conformed to standards for the use of human participants in research studies as outlined in the Declaration of Helsinki.
Familiarisation and Pretesting
Participants presented to the University of Illinois laboratory on two separate occasions and diabetes risk was assessed by oral glucose tolerance test as well as assessing height, weight, and body composition by dual energy X–Ray absorptiometry (Hologic QDR 4500A, Bedford, USA). Time was taken to familiarise volunteers to all procedures.
Infusion Protocol
For three days prior to the experimental infusion trial, participants were instructed to refrain from all physical activity, alcohol, and analgesic drugs. The evening prior to this trial, participants were required to consume a standardized meal of the same composition providing ~30% of estimated daily energy expenditure and containing 50% calories of carbohydrate, 25% calories of fat, and 25% calories of protein. Participants were instructed to fast overnight and arrive to the laboratory by car. Upon arrival, a cannula was inserted into an antecubital vein for baseline blood sample collection. Following this blood sample, a primed (2 μmol·kg−1), continuous infusion of L-[ring-13C6]phenylalanine (0.05 μmol·kg−1·min−1) was initiated (t=−180 min) and maintained until the end of the trial. Using a heated blanket, repeated arterialized blood sampling was carried out from a second cannula in a contralateral dorsal hand vein which was kept patent with a 0.9% saline drip.
Muscle biopsy samples (~100 mg) of the vastus lateralis were collected with a Bergstrom needle under local anaesthesia in the post-absorptive state at 0 min. Post-absorptive biopsies were randomly obtained from one leg whilst the post-prandial biopsies from the contralateral leg. Participants then consumed 170 g of grounded cocked lean pork loin (36g protein, ~3g leucine, and 5g fat) with the addition of 300 mL of water supplemented with 4% with L-[ring-13C6]phenylalanine according to the phenylalanine content of pork to minimize disturbances in isotopic equilibrium during the infusion trial (t=0). Analysis of pork composition is described elsewhere (Beals et al., 2016). Additional muscle biopsies were collected at t=120 and 300 min after pork ingestion. Arterialized blood samples (8 mL) were drawn every 30 or 60 min in EDTA – containing tubes and were spun at 3000 x g at 4°C for 10 min then stored at −80°C. Plasma samples obtained before and after pork ingestion at t=120 and 300 min were used to assess the post-prandial proteome profile.
Western blot analysis
Muscle samples were homogenized using previously reported methodology (Beals et al., 2016). An aliquot of muscle homogenate representing the sarcoplasmic fraction was used for chemiluminescent Western blot analysis. Prior to blotting, total protein was quantified using the Lowry method (Bradford assay; Bio – Rad). Equal quantity of protein (20 μg) was loaded to 7.5% precast polyacrylamide gel. After blocking, membranes were incubated in primary antibodies at 4oC overnight to determine the total protein of IP6K1 (Abcam, USA), total and phosphorylated Akt Ser473 Cell Signaling, USA) and total IGFR (Cell Signaling, USA). Following one-hour incubation with appropriate secondary antibodies, membranes were imaged using Li – Cor Fe and quantified using Image Studio Pro. Band normalization was quantified by measurement of total protein stain (Bio Rad, USA).
Plasma Analysis
Plasma IGF-1 were determined using commercially available enzyme-linked immunosorbent assays following manufacturer’s instructions (IGF-1: Sigma Aldrich, USA). Plasma L-[ring-13C6]phenylalanine enrichments were measured by GC/MS using electron impact ionization as previously described (Beals et al., 2016).
Plasma proteomics
Plasma samples (10 μL) were prepared for LC-MS/MS analysis by first depleting 12 commonly most abundant proteins using spin columns according to the manufacturer’s instructions (Pierce Top 12, Pierce Biotechnology, Rockford, IL USA) centrifuged at 1000 × g for 2 min. Spin columns contained antibodies for α1-Acid glycoprotein, α1-Antitrypsin, α2-macroglobulin, Albumin, Apolipoprotein A-I, Apolipoprotein A-II, Fibrinogen, Haptoglobin, Immunoglobulin A, Immunoglobulin G, Immunoglobulin M, and Transferrin. Subsequently, sample clean-up was performed using a commercially available sample preparation kit (G-Biosciences, St. Louis, MO, USA). Sample was digested with mass spectrometry grade-Trypsin (G-Biosciences, St. Louis, MO) at a w/w ratio of 1:10 using a microwave digestion system (CEM Discover, Mathews, SC) at 55°C and maximum power of 60 watts for 30 minutes. Digested peptides were lyophilized in a Virtis-55 lyophilizer to dryness. The digested peptides were dissolved in 5% acetonitrile + 0.1% formic acid for LC/MS.
LC-MS/MS was performed using a Thermo Dionex Ultimate RSLC3000 operating in nano mode at 300 microliters/min with a gradient from 0.1% formic acid to 100% acetonitrile + 0.1% formic acid in 120 minutes. The trap column used was a Thermo Acclaim PepMap 100 (100 μm x 2 cm) and the analytical column was a Thermo Acclaim PepMap RSLC (75 μm x 15 cm). 2 micrograms of the digested peptides were loaded per injection.
The raw data files from the Thermo Fusion Orbitrap were processed using Mascot Distiller using the built-in processing parameter set Orbitrap_low_res_MS2_1.opt to yield MGF peak lists that were subsequently submitted to Mascot server for analysis. The Mascot search parameters were 10 ppm precursor mass and 0.6 Da fragment pass tolerance with up to 5 missed cleavages using trypsin. SwissProt was used as the database with the taxonomy of homo sapiens. Two quantitation methods were used and results from both the T3PQ (Grossmann et al., 2010) and emPAI scores (Ishihama et al., 2005) were used for analysis. Only protein hits with Mascot scores that indicated a P < 0.05 were considered significant and used for further analysis. All proteins significantly identified in ≥ 3 samples were used for functional classification.
Calculations
Rate of disappearance (Rd) of L-[ring-13C6]phenylalanine was calculated using the below formula. In short, the remaining tracer element, which is the concentration of phenylalanine in plasma, was divided by enriched plasma free precursor pool over time and normalized with lean body mass as opposed to the typical body mass equation. Metabolic clearance rate is the volume (V) of plasma needed to completely clear (C) a substance (either filtered or processed) and units are mL or litre per unit mass in a unit of time (t) (min). MCR is the Rd divided by the average concentration between the two time points measured (Gastaldelli et al., 1999; Bergman, 1989) as indicated in the below formula.
In Vitro Experiment
C2C12 myoblasts (ATCC # CRL – 1772) derived from mouse skeletal muscle were cultured in in growth media (GM) of Dulbecco’s modified Eagle’s Media (DMEM; Gibco), supplemented with 10 % FBS, penicillin (50 U.mL−1) and streptomycin (50 U.mL−1) in standard culture conditions (37 °C, 5 % CO2, 100 % humidity) until 80% confluence. Cells were then trypsinized and seeded into 6 well plates. To induce differentiation from myoblast to myotube, cells were first washed in Dulbecco’s PBS (dPBS) and cultured in differentiation media (DM) of DMEM with 2 % donor equine serum, penicillin (50U.mL−1) and streptomycin (50 U.mL−1) for 96hours with DM changed every 24 hours until experimental treatments were administered.
Following differentiation from myoblast to myotube, the mature C2C12 myotubes were incubated under control (DM) and IGF-1 (Long R3 IGF-1; Sigma Aldrich) in a serial concentration of 10, 30 and 50ng/mL. All treatments were contained in serum-free DMEM and passed through a 0.22μm Millipore filter to ensure sterility. At the 24hour point, treatments were aspirated, cells were washed on ice with ice cold PBS prior to 400μL of cell lysis buffer with phosphatase & protease (1:100; Cell Signalling) inhibitor was added. Following a 20 minute incubation, cells were scraped into 1.5mL Eppendorf tubes, spun for 6 minutes at 700G, supernant removed and used for later analysis of proteins by Western blot methodology (described above).
Statistics
Differences in plasma IGF-1, Rd, metabolic clearance rate (MCR), muscle IGFR, muscle IP6K1, muscle P/tAkt473, were examined by two factor (group x time) repeated measures analysis of variance (ANOVA). Tukey’s post-hoc test located specific differences between means for all significant main effects and interactions. Participant characteristics, muscle signalling, and plasma variables were correlated with Rd using a Pearson’s correlation coefficient. Calculations were performed using IBM SPSS Statistics Version 21. Plasma proteome analysis was conducted using two-factor (group x time) repeated measures ANOVA with sex as a covariate using log2 (Average value + 0.5). The false discovery rate was set at 0.05. Statistical analysis of the plasma proteome was conducted using R (version 3.4.0) and the limma package (version 3.32.2). Functional classification of proteins was analysed using statistical overrepresentation tests (PANTHER classification system, Gene Ontology database; Mi et al. Nature Protocol: 2013 July 18 Supplement 1551 – 66) with Bonferroni corrections applied. Data are expressed as means ± SEMs. Significance was accepted at P<0.05.
Results
Plasma Analysis
Concentration of IGF-1 in plasma was significantly greater in OW individuals compared to OB (Figure 1A, P = 0.009, +61%) but not lean at basal (P = 0.088). Following pork ingestion, lean individuals increased IGF-1 concentration at 120 min compared to basal (P = 0.001, +26%), whereas in OW individuals this decreased (P = 0.02, −17%) and OB remained unchanged (P > 0.05). Thus, lean (P = 0.002, +46%) and OW (P = 0.046, +34%) individuals had significantly greater IGF-1 concentration compared to OB during the post-prandial period. Plasma phenylalanine (data not shown; Beals et al., 2017) concentrations increased from basal (P < 0.001), but did not differ between groups after the ingestion of pork (P > 0.05).
Figure 1.
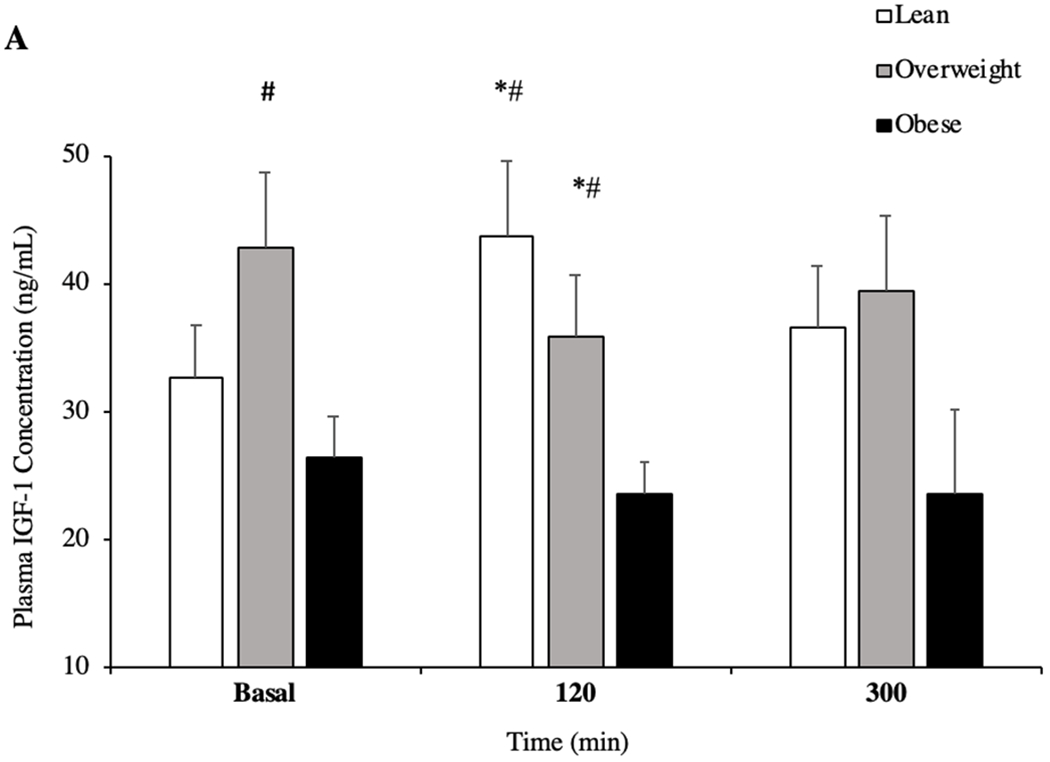
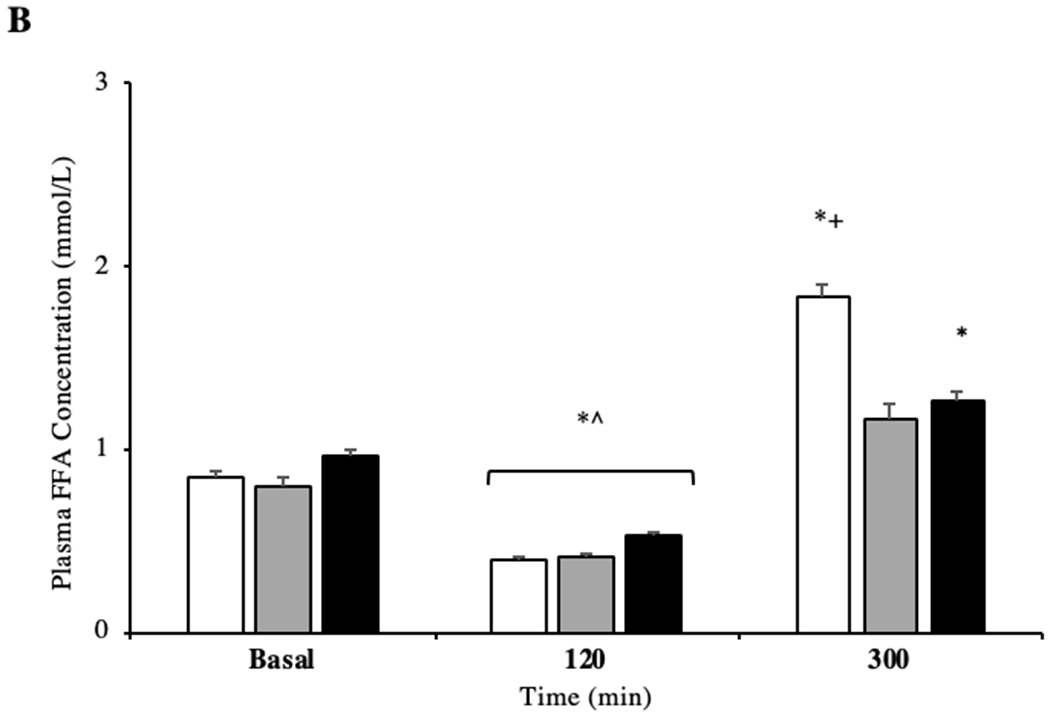
Plasma concentration of insulin like growth factor 1 (IGF-1) in the basal and in post-prandial state (A) (n = 10/group). Plasma concentration of free fatty acids (FFA) in the basal and in post-prandial state (B). *P < 0.05 vs basal. # P < 0.05 vs OB. + P <0.05 vs OW. ^ P < 0.05 120min vs 300min. Data are mean ± standard error of the mean.
Concentration of FFA between groups was not different at basal or 120 min (P > 0.05) of the post-prandial period. However, all groups had reduced concentration of FFA at 120 min after pork ingestion when compared to basal and 300 min (Figure 1C, P = 0.001). Similarly, 300 min after pork ingestion, lean (P = 0.001, +54%) and OW (P = 0.046, +21%), but not OB (P = 0.091) individuals had increased plasma FFA compared to basal. Finally, at the same time point, lean individuals had a significantly greater concentration of FFA compared to OW individuals (P = 0.037, +36%).
Muscle IGF-1 Signalling
Basal IGFR protein content in skeletal muscle was not different between groups (P > 0.05), however only OB individuals increased IGFR protein content at 120 min of the post-prandial period (P = 0.02, +20%; Figure 2A), with IGFR decreasing back to basal concentrations at 300 min (Figure 2A). IGFR remained constant in lean and OW at all time points (P > 0.05). However, OB adults had reduced IGFR at 300 min when compared to 120 min of the post-prandial period (P = 0.033, −22%). OW individuals showed reduced IGFR protein compared to the OB group (P = 0.036, −69%) at 120 min of the post-prandial period. There was no difference between OW and lean groups (P > 0.05) at all time points.
Figure 2.
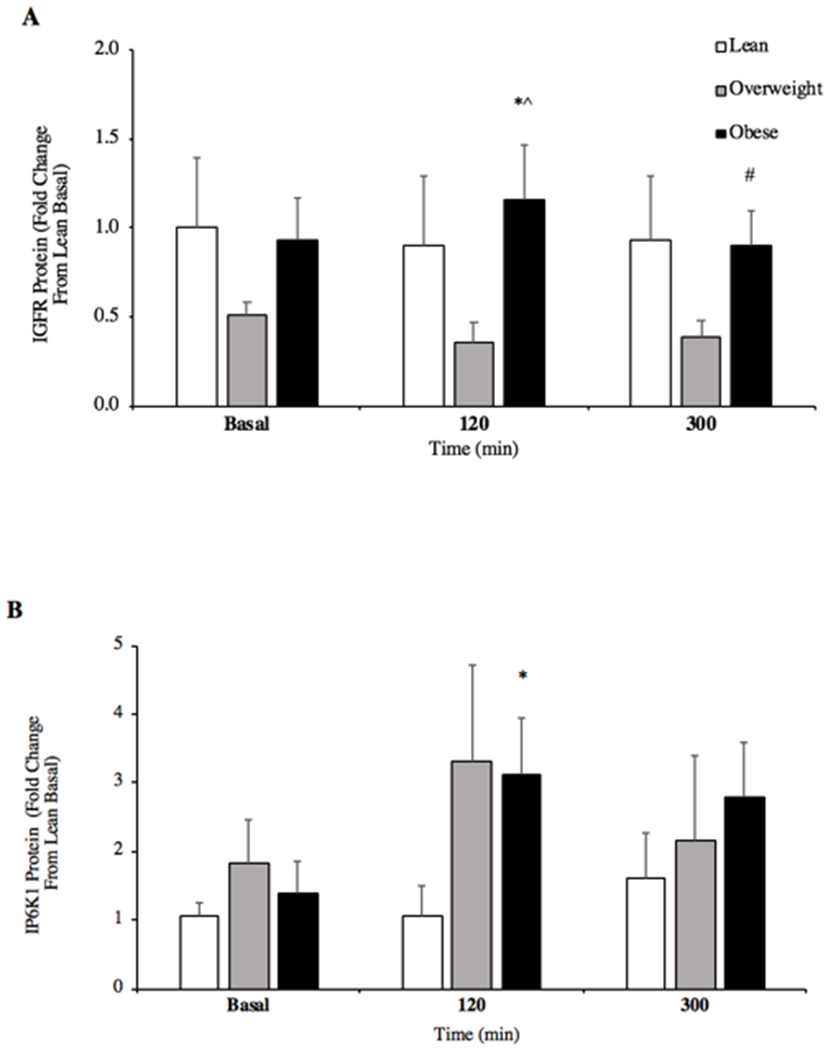
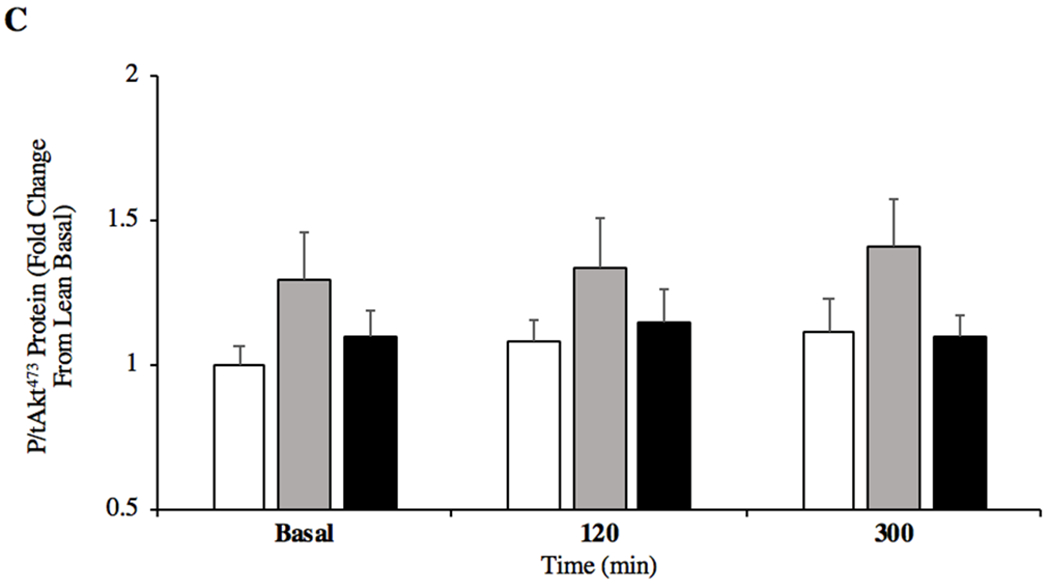
Skeletal muscle protein content for insulin like growth factor receptor (IGFR; A) and inositol hexakisphosphate kinase 1 (IP6K1; B) content in the basal state and after ingestion of pork (A, n = 6/group; B, n = 10/group). Skeletal muscle protein content for phosphorylated/total Akt Ser473 (P/tAkt473; C) in the basal state and after ingestion of pork (n = 10/group). *P < 0.05 vs basal. #P < 0.05 vs 120min. ^P < 0.05 OW vs OB. Data are mean ± standard error of the mean.
Relative IP6K1 protein content increased in OB individuals in the post-prandial state (120min; P = 0.034, +52%) but was not different between groups (Figure 2B, 120min; P > 0.05). A trend was present between OW individuals who showed greater IP6K1 protein content versus lean (120min; P = 0.079, +71%) and OB versus lean (120min; P = 0.101, +66%). No between group differences were observed at 300min post-prandial (P = 0.265). P/tAkt473 was not different among groups in both the post-absorptive and post-prandial states (Figure 2C, P = 0.151). OW individuals tended to demonstrate increased Akt473 phosphorylation compared to lean at basal (P = 0.079, +23%) whilst OW had a similar response compared to OB at 300 min (P = 0.058, +34%).
Rate of Phenylalanine Disappearance (Rd) and Metabolic Clearance Rate (MCR)
Basal phenylalanine Rd in skeletal muscle was not different between OB and lean individuals at basal (Figure 3A, P = 0.056), or OB and OW or OW and lean (all, P > 0.05). There was no effect of pork ingestion on skeletal muscle Rd across the groups (P > 0.05). MCR was not different at basal among groups, but decreased in response to the high protein food in lean, OW and OB at 120min whilst only lean and OW maintained the decreased MCR at 300 min (Figure 3B, P < 0.05).
Figure. 3.
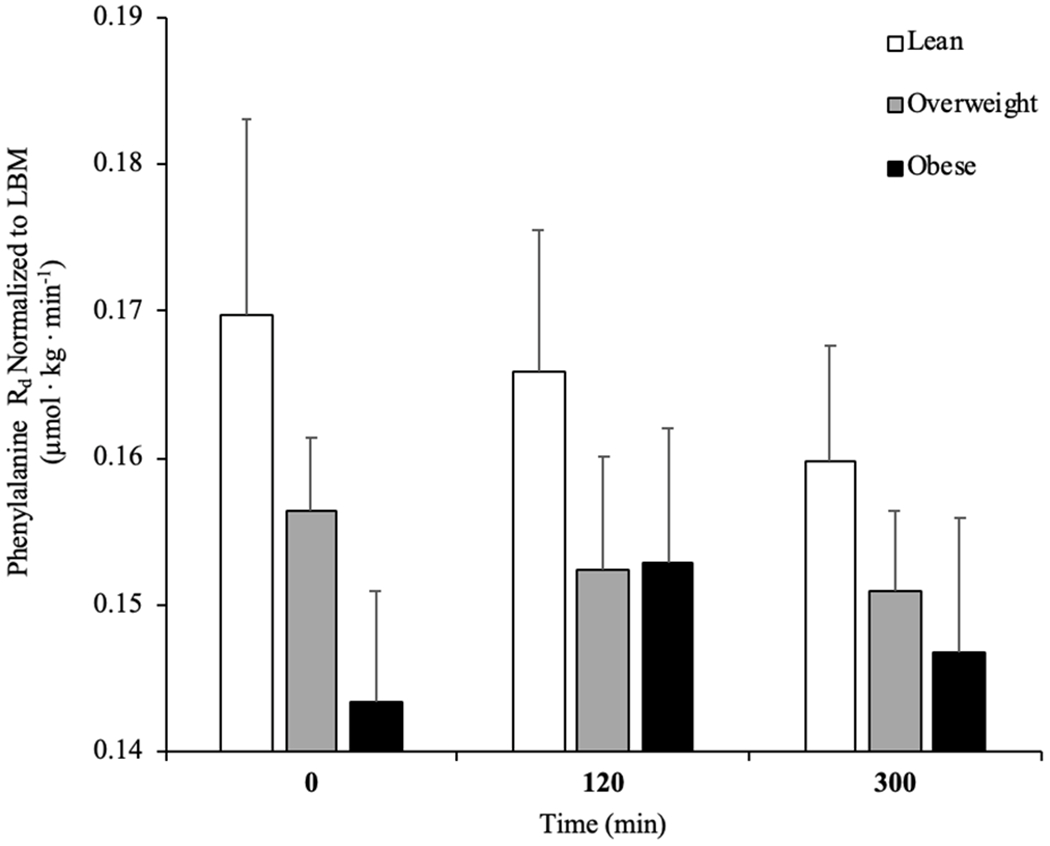
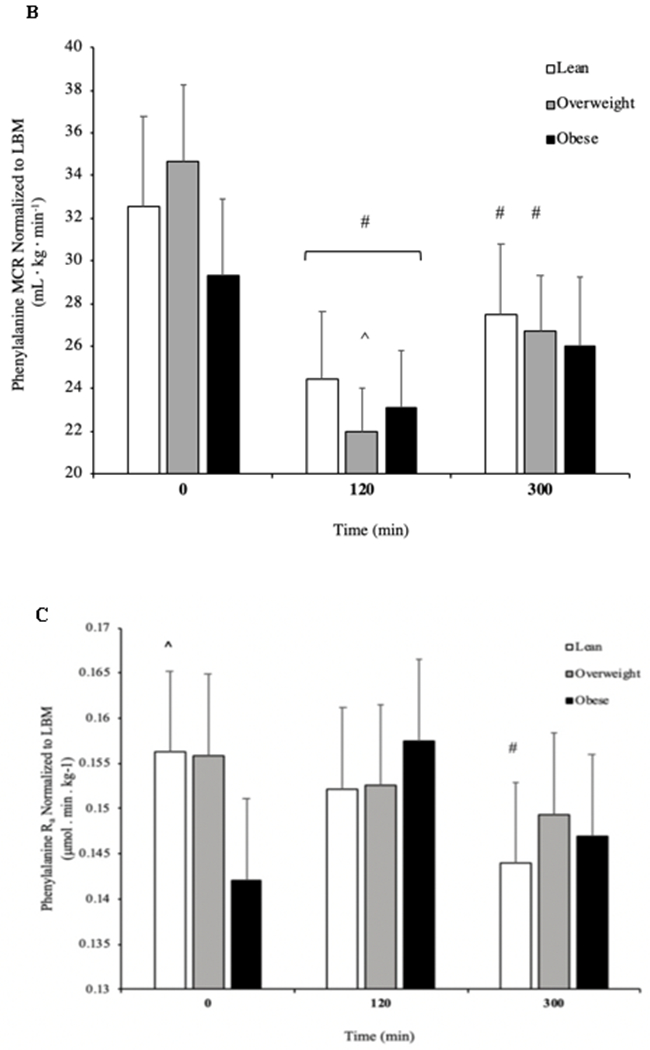
Rate of disappearance (Rd) of L-[ring-13C6]phenylalanine (A), metabolic clearance rate (MCR; B) and rate of appearance (Ra) of L-[ring-13C6]phenylalanine (C) in the basal state and after pork ingestion (n = 10/group) for lean body mass (LBM). *P b 0.01 vs lean. #P b 0.05 vs basal. ^P b 0.05 vs 300 min. ^P b 0.05 vs OB. Data are mean ± standard error of the mean.
Basal Correlation Data
In the post-absorptive state, phenylalanine Rd is positively correlated with plasma IL-6 (R = 0.413, P < 0.05) and MCR (R = 0.680, P < 0.001). MCR of lean body mass was not significantly correlated with any variable aside from Rd in the post-absorptive state (P > 0.05).
Post-Prandial Correlation Data
Phenylalanine Rd was positively correlated with IGFR (R = 0.400, P < 0.05) and MCR at 120min (R = 0.633, P < 0.05), whilst negatively correlated with SNAT2 at the same time point (R = −0.376, P < 0.05).
Proteomics
The relative abundance of 517 and 139 plasma proteins using emPAI scores and the Top 3 Protein Quantification (T3PQ) method, respectively were included in our analysis. Statistical analyses of results from both approaches yielded similar findings with respect to BMI, time, and sex. Therefore, we elected to focus on the results from the T3PQ method since it provided more conservative results. No group differences were found in any of the proteins detected (Figure 4, P > 0.05). Similarly, there was no effect of pork ingestion on the circulating proteome (Figure 5, P > 0.05). There was an effect of sex where proteins involved primarily in plasma lipid handling were detected at greater levels in men vs. women (Table 5, P < 0.05). KEGG pathway analysis depicted 28 functional classifications significantly represented by the proteins found (P < 0.05). In addition, GO overrepresentation analysis of the proteins identified 1306 biological processes and 163 molecular functions significantly represented in the data (P < 0.05). The top 10 most overrepresented protein functional classifications from the PANTHER overrepresentation tests are presented in table 4.
Figure 4.
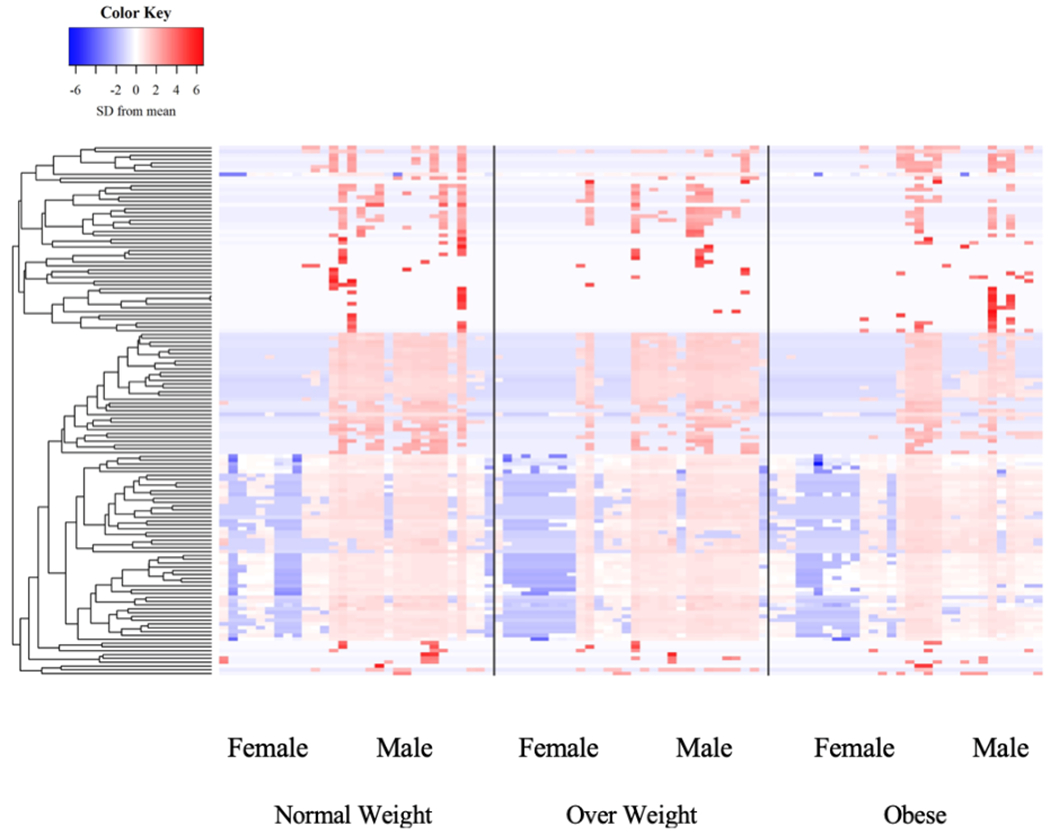
Plasma proteomic signature organized by BMI category.
Figure 5.
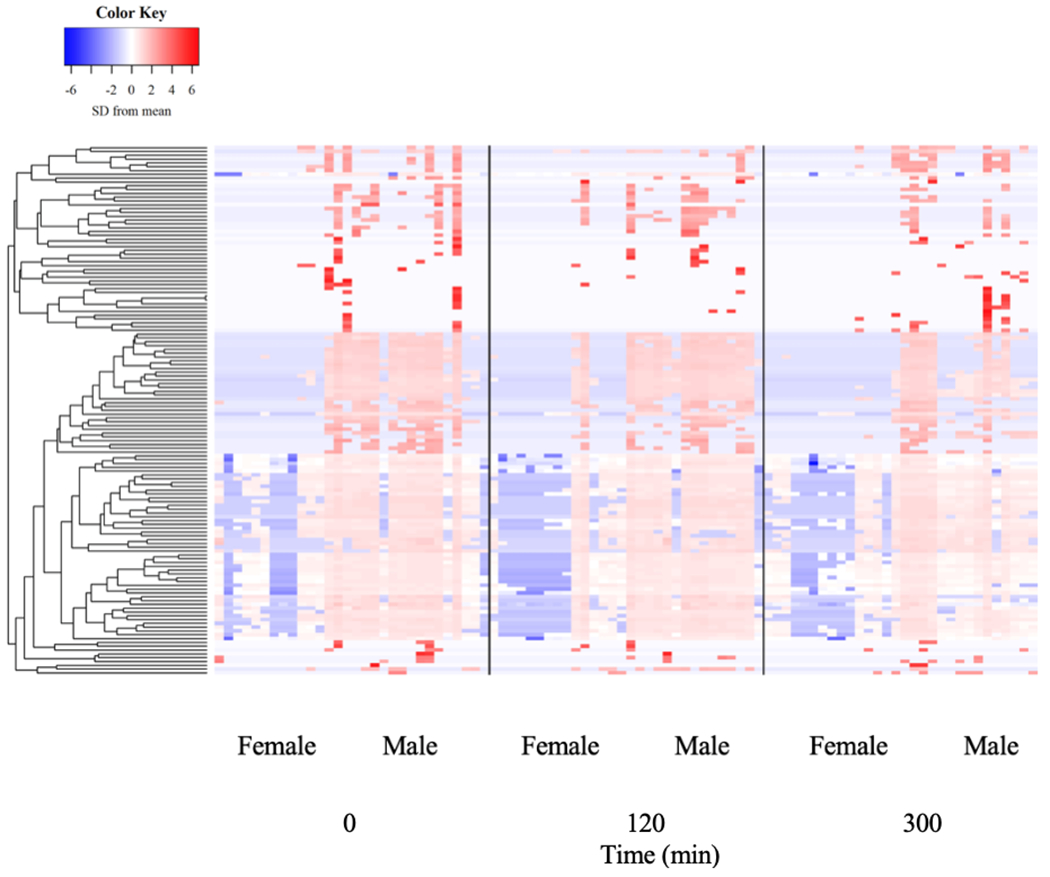
Plasma proteome in response to protein-dense food ingestion.
Table 5.
Top 10 GO terms differentially represented in males vs. females.
| Protein categories | Term | P-value |
|---|---|---|
| Biological processes | ||
| Negative regulation of very-low density lipoprotein particle remodeling | 1.20 × 10−03 | |
| Regulation of very-low density lipoprotein particle remodeling | 2.10 × 10−05 | |
| Negative regulation of very-low density lipoprotein particle clearance | 2.83 × 10−03 | |
| Regulation of very-low-density lipoprotein particle clearance | 2.83 × 10−03 | |
| Chylomicron remodeling | 5.22 × 10−09 | |
| Chylomicron assembly | 9.80 × 10−09 | |
| Positive regulation of cholesterol esterification | 1.18 × 10−06 | |
| Complement activation, alternative pathway | 2.53 × 10⁻¹⁰ | |
| Triglyceride-rich lipoprotein particle remodeling | 2.53 × 10⁻¹⁰ | |
| Triglyceride-rich lipoprotein particle clearance | 1.37 × 10−04 | |
| Molecular function | ||
| High-density lipoprotein particle receptor binding | 4.37 × 10⁻⁴ | |
| Phosphatidylcholine-sterol O-acyltransferase activator activity | 1.59 × 10⁻⁵ | |
| Hemoglobin binding | 2.01 × 10−03 | |
| Lipase inhibitor activity | 1.01 × 10−05 | |
| Complement binding | 3.93 × 10−07 | |
| Phosphatidylcholine binding | 4.53 × 10−05 | |
| Cholesterol transporter activity | 1.55 × 10−03 | |
| Lipoprotein particle receptor binding | 8.30 × 10−05 | |
| Sterol transporter activity | 9.63 × 10−03 | |
| Cholesterol binding | 1.10 × 10−03 |
Table 4.
Top 10 GO protein classifications.
| Protein categories | Term | Representative protein(s) | P-value |
|---|---|---|---|
| Biological processes | |||
| Platelet degranulation | Platelet basic protein | 2.56 × 10−53 | |
| Protein activation cascade | Complement C1 subunits | 2.78 × 10−52 | |
| Acute inflammatory response | Complement factors | 1.34 × 10−45 | |
| Defense response | LPS-binding protein | 1.16 × 10−38 | |
| Regulation of proteolysis | Carboxypeptidase B2 | 4.67 × 10−38 | |
| Complement activation | Immunoglobulin | 1.56 × 10−37 | |
| Proteolysis | Plasma serine protease inhibitor | 9.36 × 10−37 | |
| Vesicle-mediated transport | Apolipoprotein D | 2.77 × 10−36 | |
| Response to stress | Galectin-3-binding protein | 2.46 × 10⁻³⁵ | |
| Inflammatory response | Serum amyloid A | 2.72 × 10⁻³⁵ | |
| Molecular function | |||
| Endopeptidase inhibitor activity | Kallistatin | 1.37 × 10⁻³¹ | |
| Endopeptidase regulator activity | Protein AMBP | 3.94 × 10⁻³¹ | |
| Peptidase inhibitor activity | Inter-alpha-trypsin inhibitor | 6.59 × 10⁻³¹ | |
| Peptidase regulator activity | Kininogen-1 | 6.85 × 10⁻³⁰ | |
| Enzyme inhibitor activity | Alpha-1-antichymotrypsin | 4.55 × 10⁻²⁷ | |
| Serine-type endopeptidase inhibitor activity | Protein Z-dependent protease inhibitor | 1.27 × 10⁻²⁵ | |
| Enzyme regulator activity | Angiotensinogen | 2.23 × 10⁻¹⁸ | |
| Serine-type endopeptidase activity | Prothrombin | 1.53 × 10⁻¹⁶ | |
| Glycosaminoglycan binding | Thrombospondin | 5.25 × 10⁻¹⁶ | |
| Serine-type peptidase activity | Plasminogen | 8.45 × 10⁻¹⁶ |
LPS; lipopolysacharide
Protein Signalling in C2C12 Muscle Cells
Low concentration of IGF-1 significantly increased IP6K1 content in C2C12 myotubes (P = 0.021; +75%). There was no difference between control, moderate (P = 0.181; + 69%) and high IGF-1 concentrations (P = 0.388; +72%; Figure 6A). Downstream, neither p/tAkt308 and p/tAkt473 was not different among treatments (Figure 6B & 6C).
Figure 6.
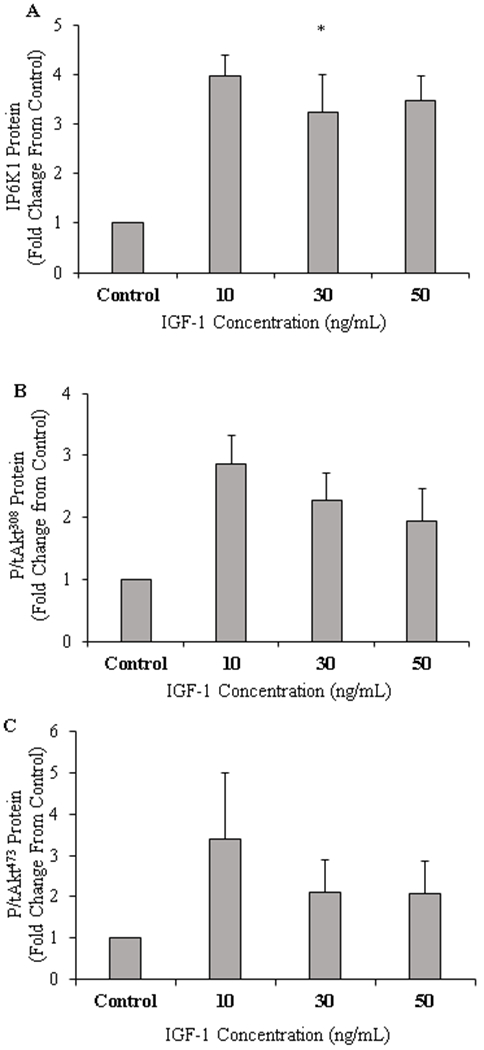
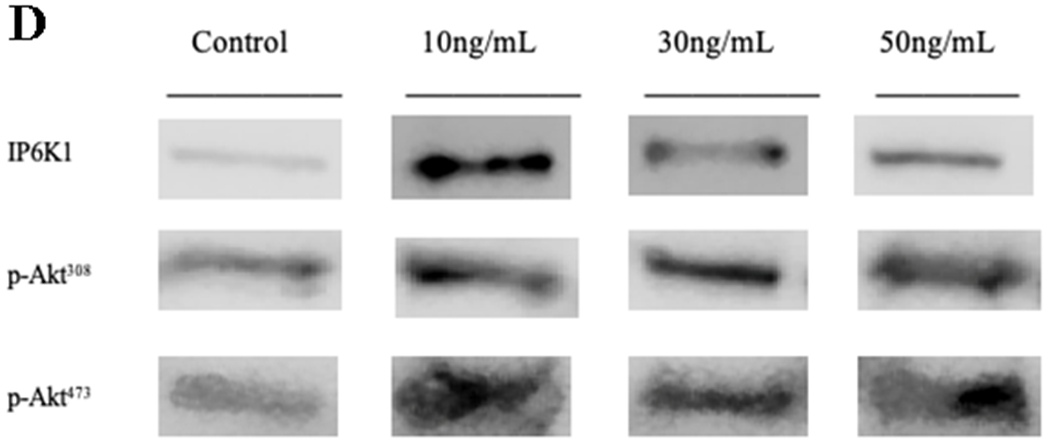
C2C12 muscle protein content for inositol hexakisphosphate kinase 1 (IP6K1; A), Phosphorylated/total Akt Thr308 (B), Phosphorylated/total Akt Ser473 (C), and respective blot images for protein targets (D) (n=6/treatment). *P<0.05 vs Control. Data are mean ± standard error of the mean.
Discussion
High protein diets are commonly used for weight management and treatment of obesity-related co-morbidities. This is the first study to characterize IGF-1/IP6K1/Akt signalling in skeletal muscle and post-prandial circulating proteome after lean meat ingestion, a common component of a western dietary pattern, in sedentary young adults of various BMIs and fat masses. The novel finding here is that muscle IP6K1 protein content is elevated in individuals with obesity after the ingestion of lean meat when compared to lean adults, suggesting that IP6K1 may be implicated in the dysregulation of nutrient uptake in skeletal muscle in the post-absorptive state in obese individuals (Naufahu et al., 2018). Our data also showed that IGFR signalling in skeletal muscle is elevated in the obese phenotype which is present in the face of reduced plasma IGF-1 in the same population compared to lean controls. Indeed, we hypothesised that adults with obesity would demonstrate differentially expressed circulating proteins yet our data showed no clear differences in the postprandial plasma proteome between groups. Hence, this global analysis did not provide insight into postprandial circulating events that may contribute to dysregulated molecular signalling in insulin resistant obese muscle.
IP6K1 is thought to inhibit Akt phosphorylation via the secondary messenger IP7 with its subsequent binding to Akt’s PH domain (Chakraborty et al., 2010). IP6K1 is elevated in the post-prandial state, and this may be an important cause or at least a consequence of poor amino acid metabolism in skeletal muscle as supported in the obese rodent (Friedman et al., 1990), obese humans (Liebau et al., 2014) and our recent work showing reduced peripheral glucose uptake post intravenous glucose administration in insulin resistant pre-diabetic individuals (Naufahu et al., 2018). Given that one of IP6K1 proposed actions is to inhibit Akt activity, we would have expected a reduction in phosphorylated Akt473 at the same time point, yet our current data does not support this. The lack of change in p/tAkt473 may be due to the increase in IP6K1 whereby p-Akt308, not p-Akt473, is downregulated in response to increased IP6K1 muscle content (Chakraborty et al., 2010; Naufahu et al., 2018). With the ingestion of a sole food source, glucose handling is not a particular relevant variable in this study. However, it is worth acknowledging that the pork contained ~3.3 g leucine, which is a particularly strong insulin stimulator (van Loon et al., 2000). To probe additional upstream mechanisms that may underpin the obesity-related dysregulation of mTORC1 signalling (Beals et al., 2016), we examined muscle IGFR protein content (an upstream regulator of Akt and mTORC1) in the volunteers of different BMIs. Like IP6K1, muscle IGFR protein content increased at 120 min in the post-prandial period from basal in the obese group, and was greater in the obese compared to overweight group. This finding could demonstrate a compensatory mechanism due to decreased plasma IGF-1 in the obese individuals and/or hyperinsulimia, and not IGF-1, contributes to increased IGFR-IP6K1 muscle content. Indeed, O’Neill et al. (2015) showed that IRS-1 and IGF-1Rs are required for hypertrophic muscle protein remodelling in mice, which highlights the protein interaction between these otherwise separate pathways in a rodent model.
It appears that IP6K1 muscle content in overweight men and women is increased after protein ingestion, however large variation within this data set may have contributed to a lack in statistical significance (P = 0.084). This is also the first set of data that has investigated the IP6K1 response to meat ingestion. Lean and overweight groups had similar glycaemic and insulinemic responses to a protein-dense feed. We would therefore not expect IP6K1 to be different between these groups (Chakraborty et al., 2010; Ghoshal et al., 2016). However, obese individuals in this study were insulin resistant and displayed hyperinsulinemia (data presented Beals et al., 2016), which may have contributed to the increased IP6K1 at 120 minutes post pork ingestion given that the hyperinsulinemia is known to drive IP6K1 activity (Chakraborty et al., 2010). It is hypothesised that over stimulation of the insulin signalling pathway by insulin, not IGF-1, in the obese group results in increased IP6K1 activity that maybe contributing to a reduction in protein synthesis (Beals et al., 2016). We see indirect support for this notion with a previously documented decrease in muscle IP6K1 content with an increase in phosphorylation of Akt and subsequent improvement in insulin sensitivity (Naufahu et al., 2018). IP6K1 inhibition using TNP in insulin-stimulated hepatic cell lines and IP6K1 KO mice show hyper Akt activation (Ghoshal et al., 2016; Chakraborty et al., 2010), suggesting that IGF-1 and insulin may act independent of each other in the potential IP6K1–Akt signalling pathway. In a separate in vitro experiment using the C2C12 muscle cell line we investigated the effects of IGF-1 on IP6K1. Low IGF-1 concentration (10 ng/mL) was sufficient to increase muscle IP6K1 content while increasing IGF-1 to 30 and 50 ng/mL showed no difference from control cells (Figure 6A). Interestingly, our in vitro and in vivo data agree whereby obese individuals who had the lowest plasma IGF-1 concentration, also increased their muscle IP6K1 at 120 and 300min which suggests that whilst higher concentrations of IGF-1 may not affect long term muscle function (Morton et al., 2016), it may be favourable for reducing IP6K1 muscle content and therefore increasing insulin sensitivity. Yet this is a notion that requires further investigation.
We have previously shown that mTORC1 is hyper-phosphorylated in a post-absorptive-state in obese individuals, yet in response to a large oral protein load mTORC1 phosphorylation is blunted compared to lean controls (Beals et al., 2016). However, there was an increase in the muscle protein content of the large neutral amino acid transporter-1 (LAT1) and sodium dependent neutral amino acid transporter-2 (SNAT2) at 5 hr of the post-prandial period after a high protein food ingestion irrespective of BMI score in sedentary young adults (Beals et al., 2016). It has been suggested that these amino acid transporters may play a key role in the activation of the mTORC1 signaling pathway via an amino acid transporter/receptor (Gran & Cameron-Smith, 2011; Drummond et al., 2011; Beals et al., 2016). As such, we tested the relationship with these amino acid transporters with phenylalanine uptake in skeletal muscle and its MCR, observing a negative correlation between phenylalanine uptake in skeletal muscle and SNAT2 muscle content at 120 minutes. Moreover, it is worth highlighting that the total protein content of amino acid transporters as determined by Western Blot does not provide information into the intracellular location of these transporters nor their activity and/or transport capacity (Hodson et al., 2017). Thus, we are unable to conclude that there are no defects in amino acid transport capacity in people with excess fat mass.
We have previously established a clear defect in the post-prandial myofibrillar protein synthetic response in obese adults (Beals et al., 2016), yet skeletal muscle phenylalanine Rd is not different in this group compared to lean individuals (Figure 3B). Phenylalanine Rd is known to reflect skeletal muscle amino acid uptake, oxidation and protein and hormone/metabolite synthesis which drives the utilization of ingested nutrients to deposit them to various tissues (Matthews, 2007). The current study demonstrated a trend towards lower R d in obese individuals at basal (P = 0.056), suggesting that insulin resistant obese individuals may suffer from reduced skeletal muscle amino acid uptake in the post-absorptive state (Liebau et al., 2014). Obese individuals have elevated mTORC1 signalling in the post-absorptive state, and therefore this exacerbated activation of this protein complex of mTOR may be already over stimulated which makes the muscle insensitive to further uptake of remaining amino acids (Beals et al., 2016). Contrary to this, there was no difference within, or between groups for skeletal muscle Rd of phenylalanine, suggesting that the ability of obese individuals to dispose of amino acids in skeletal muscle is normal and that the mechanism driving anabolic resistance may be explained by hyperinsulinemia (data not shown), intracellular mTORC1 and associated protein signalling (Beals et al., 2016), particularly given the finding that plasma IGF-1 is suppressed in this population (Figure 1B). We acknowledge that there is a gap between the skeletal muscle uptake of amino acids and molecular signalling in skeletal muscle, however ingested amino acids predominantly deposit into skeletal muscle versus other tissues (Chang & Goldberg, 1978).
To help examine skeletal muscle phenylalanine Rd and muscle anabolic response further, we investigated whether obese insulin resistant individuals display a different circulating proteome in both the basal and post-prandial states compared to our healthy lean and overweight sample. This is the first work of its kind to profile the plasma proteome in response to a typical dinner amount of dietary protein (36 g) across various BMI scores. We observed no differences in the postprandial circulating proteome in the basal and post-prandial states in obese individuals. It is worth noting that previous work has demonstrated that fasting-state proteomic signatures in an overweight female adolescent population correlated with HOMAIR (Rothwell et al., 2011). However, our work is generally consistent with studies in adults that showed the post-prandial plasma proteome is unchanged after the ingestion of a low protein, but high in fat, meal (Pellis et al., 2012), and consistent with the notion that changes in the plasma metabolome are more sensitive to an acute meal setting (Pellis et al., 2012).
Some limitations are present in the current study which must be acknowledged. Firstly, the small sample size between groups is important when drawing conclusions from the data. Secondly, due to lack of sample, IRS-1 muscle protein data is missing from our data set and would have been a useful protein target for our interpretation of IGF-1 and IGFR signalling in the overweight and obese adults. Finally, we acknowledge that there is a gap between the skeletal muscle uptake of amino acids and molecular signalling in skeletal muscle, however ingested amino acids predominantly deposit into skeletal muscle versus other tissues (Chang & Goldberg, 1978).
To conclude, we characterized IGF-1/IP6K1/Akt signalling in individuals with various levels of adiposity and BMI scores before and after lean meat ingestion and showed that IP6K1 was acutely elevated in obese individuals post feeding. This finding, in combination with the hyperinsulinemia (Beals et al., 2016) and the trend for reduced phenylalanine Rd, and our previous findings (Naufahu et al., 2018) suggest that IP6K1 may be contributing to regulation of nutrient uptake of skeletal muscle in the post-prandial state. Our data showed no clear differences in plasma proteomic signatures between groups despite overt differences in muscle nutrient signalling. We therefore conclude that acute changes in the post-prandial plasma proteome does not contribute significantly to altered molecular signalling in skeletal muscle and that the mechanism(s) driving anabolic resistance may be explained by intracellular mTORC1 and associated protein signalling.
Table 1.
Participant Characteristics.
| Variable | Lean | Overweight | Obese |
|---|---|---|---|
| Participants (males) | 10 (5) | 10 (5) | 10 (5) |
| Age (years) | 24 ± 1 | 26 ± 2 | 27 ± 3 |
| Height (m) | 1.73 ± 0.03 | 1.70 ± 0.02 | 1.71 ± 0.03 |
| Weight (kg) | 68.5 ± 3.5 | 78.6 ± 2.2 | 106.0 ± 5.0*Ψ |
| BMI (kg/m2) | 22.7 ± 0.4 | 27.1 ± 0.5 | 35.9 ± 1.3 |
| Waist: Hip | 0.79 ± 0.02 | 0.83 ± 0.02 | 0.92 ± 0.01*Ψ |
| Body Fat (%) | 22.2 ± 1.8 | 29.1 ± 1.4* | 35.3 ± 1.8*Ψ |
| Lean Body Mass (kg) | 51.3 ± 3.7 | 53.8 ± 1.3 | 65.5 ± 3.2*Ψ |
| Fasting Glucose (mmol/L) | 4.33 ± 0.12 | 4.35 ± 0.07 | 4.55 ± 0.12 |
| 120min Glucose (mmol/L) | 4.36 ± 0.34 | 4.47 ± 0.23 | 5.51 ± 0.43*Ψ |
| Fasting Insulin (pmol/L) | 49.31 ± 6.25 | 45.14 ± 3.47 | 175.01 ± 26.39*Ψ |
| HOMAIR | 1.36 ± 0.17 | 1.25 ± 0.11 | 5.82 ± 0.81*Ψ |
Glucose values were obtained from the oral-glucose-tolerance test. Demographic, body-composition, and HOMAIR data were analysed by 1-factor ANOVA. Fasting glucose and 120-min glucose data were analysed by using 2-factor repeated- measures ANOVA. A Tukey’s post hoc test was used to locate differences between group means when indicated by significant group effects or group - time interactions.
P < 0.05 vs Lean group;
P < 0.05 vs OW group. Glucose: group effect, P = 0.59; time effect, P < 0.001; group x time, P < 0.001; OB, obese; OW, overweight. Values are means ± standard error of the mean.
Table 2.
Fasting and Post-prandial Phenylalanine Disappearance Rate Correlation analysis.
| Variable | Rate of Disappearance (Rd) Basal(μmol.min−1.kg−1) | Rate of Disappearance (Rd) 120min(μmol.min−1.kg−1) | Rate of Disappearance (Rd) 300min(μmol.min−1.kg−1) |
|---|---|---|---|
| Plasma IGF-1 (ng/mL) | .319 | .074 | .232 |
| Muscle IGFR (A/U) | .145 | .400* | −.113 |
| Muscle IP6K1 (A/U) | −.082 | .081 | −.044 |
| p/t Akt473 (A/U) | −.045 | −.262 | .051 |
| p/t Akt308(A/U) | −.102 | .268 | .282 |
| Body Fat (%) | −.182 | −.017 | −.078 |
| Lean Body Mass (g) | −.180 | −.253 | −.381 |
| BMI (kg/m2) | −.298 | −.150 | −.227 |
| Waist: Hip | .220 | .182 | .211 |
| HOMAIR | −.182 | .018 | −.173 |
| QUICKI | .265 | −.101 | .256 |
| FISI | −.182 | .017 | −.430 |
| Insulin (pmol/L) | −.178 | .061 | −.242 |
| Blood Glucose (mmol/L) | −.134 | .200 | −.081 |
| FFA (mM) | .244 | −.87 | .235 |
| IL-6 (mg/dL) | .413* | −.063 | .012 |
| SNAT2 (A/U) | .146 | −.376* | −.095 |
| LAT1 (A/U) | −.138 | .043 | −.175 |
Values are R values obtained by Pearson’s correlation coefficient to measure the strength and direction of correlation between variables with significance (two-tailed) indicated by * P < 0.05 or **P < 0.01.
Table 3.
Fasting and Post-prandial Phenylalanine Metabolic Clearance Rates Correlation Analysis.
| Variable | Metabolic Clearance Rate (MCR) Basal(mL.min−1.kg−1) | Metabolic Clearance Rate (MCR) 120 min(mL.min−1.kg−1) | Metabolic Clearance Rate (MCR) 300min(mL.min−1.kg−1) |
|---|---|---|---|
| Plasma IGF-1 (ng/mL) | −.011 | −.102 | .137 |
| Muscle IGFR (A/U) | .282 | .156 | −.080 |
| Muscle IP6K1 (A/U) | −.054 | −.163 | −.080 |
| p/t Akt473 (A/U) | −.225 | −.251 | .242 |
| p/t Akt308 (A/U) | .006 | .128 | .347 |
| Body Fat (%) | .006 | .192 | .024 |
| Lean Body Mass (g) | −.298 | −.266 | −.190 |
| BMI (kg/m2) | −.213 | −.016 | −.051 |
| Waist: Hip | .143 | .132 | .125 |
| HOMAIR | −.196 | .009 | −.065 |
| QUICKI | .193 | −.023 | .070 |
| FISI | −.197 | .007 | −.308 |
| Insulin (pmol/L) | −.189 | .017 | −.059 |
| Blood Glucose (mmol/L) | −.116 | .056 | −.111 |
| FFA (mM) | .059 | .333 | .061 |
| IL-6 (mg/dL) | .110 | .176 | .152 |
| SNAT2 (A/U) | −.184 | −.028 | −.146 |
| LAT1 (A/U) | −.164 | −.050 | −.299 |
Values are R values obtained by Pearson’s correlation coefficient to measure the strength and direction of association between variables with significance (two-tailed) indicated by *P < 0.05 and **P < 0.01.
Acknowledgements
We would like to thank University of Roehampton Sport and Exercise Science Research Centre (SESRC) technicians, Tom Reeve and Alison Carlisle, for their support with the project and organising safe transport of muscle and plasma samples.
Funding Sources
This work was partly supported by the National Pork Board [grant numbers #14-205, 2016 and #16-012, 2016].
Abbreviations used:
- Rd
rate of disappearance
- IGF-1
insulin like growth factor 1
- IP6K1
inositol hexakisphosphate kinase 1
- IRS-1
insulin receptor substrate 1
- IGFR
insulin like growth factor receptor
- mTORC1
mechanistic target of rapamycin complex 1
- mTOR
mechanistic target of rapamycin
- FFA
free fatty acids
- BMI
body mass index
- HOMAIR
homeostatic model assessment of insulin resistance
- MPS
muscle protein synthesis
- PH
pleskstrin homology
- PIP3
phosphatidylinositol 3,4,5-trisphosphate
- Akt
protein kinase B
- LAT1
large neutral amino acid transporter-1
- SNAT2
sodium dependent neutral amino acid transporter-2
- OW
overweight
- OB
obese
Footnotes
Conflict of Interest Statement
There are no conflicts of interests to disclose.
References
- 1.Golay A, Swislocki A, Chen Y, Jaspan JB & Reaven GM (1986). Effect of obesity on ambient plasma glucose, free fatty acid, insulin, growth hormone, and glucagon concentrations. The Journal of Clinical Endocrinology & Metabolism, 63(2) pp.481–484. [DOI] [PubMed] [Google Scholar]
- 2.Stumvoll M, Goldstein BJ & van Haeften TW (2005). Type 2 diabetes: Principles of pathogenesis and therapy. The Lancet, 365(9467) pp.1333–1346. [DOI] [PubMed] [Google Scholar]
- 3.DeFronzo RA & Tripathy D (2009). Skeletal muscle insulin resistance is the primary defect in type 2 diabetes. Diabetes Care, 32(2) pp.S163. [DOI] [PMC free article] [PubMed] [Google Scholar]
- 4.Svanberg E, Zachrisson H, Ohlsson C, Iresjo BM & Lundholm KG (1996). Role of insulin and IGF-I in activation of muscle protein synthesis after oral feeding. The American Journal of Physiology, 270(4 Pt 1) pp.614. [DOI] [PubMed] [Google Scholar]
- 5.Greenhaff PL, Karagounis LG, Peirce N, Simpson EJ, Hazell M, Layfield R, Wackerhage H, Smith K, Atherton P & Selby A (2008). Disassociation between the effects of amino acids and insulin on signaling, ubiquitin ligases, and protein turnover in human muscle. American Journal of Physiology-Endocrinology and Metabolism, 295(3) pp.604. [DOI] [PMC free article] [PubMed] [Google Scholar]
- 6.Dickinson JM, Fry CS, Drummond MJ, Gundermann DM, Walker DK, Glynn EL, Timmerman KL, Dhanani S, Volpi E & Rasmussen BB (2011). Mammalian target of rapamycin complex 1 activation is required for the stimulation of human skeletal muscle protein synthesis by essential amino acids–. The Journal of Nutrition, 141(5) pp.856–862. [DOI] [PMC free article] [PubMed] [Google Scholar]
- 7.Dickinson JM, Drummond MJ, Fry CS, Gundermann DM, Walker DK, Timmerman KL, Volpi E & Rasmussen BB (2013). Rapamycin does not affect post-absorptive protein metabolism in human skeletal muscle. Metabolism, 62(1) pp.144–151. [DOI] [PMC free article] [PubMed] [Google Scholar]
- 8.Beals JW, Sukiennik RA, Nallabelli J, Emmons RS, Van Vliet S, Young JR, Ulanov AV, Li Z, Paluska SA & De Lisio M (2016). Anabolic sensitivity of post-prandial muscle protein synthesis to the ingestion of a protein-dense food is reduced in overweight and obese young adults, 2. The American Journal of Clinical Nutrition, 104(4) pp.1014–1022. [DOI] [PubMed] [Google Scholar]
- 9.O’Neill BT, Lauritzen HP, Hirshman MF, Smyth G, Goodyear LJ & Kahn CR (2015). Differential role of insulin/IGF-1 receptor signaling in muscle growth and glucose homeostasis. Cell Reports, 11(8) pp.1220–1235. [DOI] [PMC free article] [PubMed] [Google Scholar]
- 10.Bhandari R, Juluri KR, Resnick AC & Snyder SH (2008). Gene deletion of inositol hexakisphosphate kinase 1 reveals inositol pyrophosphate regulation of insulin secretion, growth, and spermiogenesis. Proceedings of the National Academy of Sciences of the United States of America, 105(7) pp.2349–2353. [DOI] [PMC free article] [PubMed] [Google Scholar]
- 11.Chakraborty A, Koldobskiy MA, Bello NT, Maxwell M, Potter JJ, Juluri KR, Maag D, Kim S, Huang AS & Dailey MJ (2010). Inositol pyrophosphates inhibit akt signaling, thereby regulating insulin sensitivity and weight gain. Cell, 143(6) pp.897–910. [DOI] [PMC free article] [PubMed] [Google Scholar]
- 12.Naufahu J, Elliott B, Markiv A, Dunning-Foreman P, McGrady M, Howard D, Watt P & Mackenzie RW (2018). High intensity exercise decreases IP6K1 muscle content & improves insulin sensitivity (SI2*) in glucose intolerant individuals. The Journal of Clinical Endocrinology & Metabolism, 103(4) pp.1479–1490. [DOI] [PubMed] [Google Scholar]
- 13.van Loon LJ, Saris WH, Verhagen H, & Wagenmakers AJ (2000). Plasma insulin responses after ingestion of different amino acid or protein mixtures with carbohydrate. The American journal of clinical nutrition, 72(1) pp. 96–105. [DOI] [PubMed] [Google Scholar]
- 14.Alfadda AA, Masood A, Al-Naami MY, Chaurand P, & Benabdelkamel H (2017). A proteomics based approach reveals differential regulation of visceral adipose tissue proteins between metabolically healthy and unhealthy obese patients. Molecules and cells, 40(9), 685. [DOI] [PMC free article] [PubMed] [Google Scholar]
- 15.Halton TL, & Hu FB (2004). The effects of high protein diets on thermogenesis, satiety and weight loss: a critical review. Journal of the American College of Nutrition, 23(5), 373–385. [DOI] [PubMed] [Google Scholar]
- 16.Beals JW, Mackenzie RW, van Vliet S, Skinner SK, Pagni BA, Niemiro GM, Ulanov AV, Li Z, Dilger AC & Paluska SA (2017). Protein-rich food ingestion stimulates mitochondrial protein synthesis in sedentary young adults of different BMIs. The Journal of Clinical Endocrinology & Metabolism, 102(9) pp.3415–3424. [DOI] [PubMed] [Google Scholar]
- 17.Grossmann J, Roschitzki B, Panse C, Fortes C, Barkow-Oesterreicher S, Rutishauser D & Schlapbach R (2010). Implementation and evaluation of relative and absolute quantification in shotgun proteomics with label-free methods. Journal of Proteomics, 73(9) pp.1740–1746. [DOI] [PubMed] [Google Scholar]
- 18.Mi H, Muruganujan A, Casagrande JT, & Thomas PD (2013). Large-scale gene function analysis with the PANTHER classification system. Nature protocols, 8(8) pp. 1551. [DOI] [PMC free article] [PubMed] [Google Scholar]
- 19.Ishihama Y, Oda Y, Tabata T, Sato T, Nagasu T, Rappsilber J & Mann M (2005). Exponentially modified protein abundance index (emPAI) for estimation of absolute protein amount in proteomics by the number of sequenced peptides per protein. Molecular & Cellular Proteomics: MCP, 4(9) pp.1265–1272. [DOI] [PubMed] [Google Scholar]
- 20.Gastaldelli A, Coggan AR, & Wolfe RR (1999). Assessment of methods for improving tracer estimation of non-steady-state rate of appearance. Journal of Applied Physiology, 87(5) pp.1813–1822. [DOI] [PubMed] [Google Scholar]
- 21.Bergman RN (1989). Toward physiological understanding of glucose tolerance: minimal-model approach. Diabetes, 38(12) pp.1512–1527. [DOI] [PubMed] [Google Scholar]
- 22.Friedman JE, Lemon PW, & Finkelstein JA (1990). Effect of exercise and obesity on skeletal muscle amino acid uptake. Journal of applied physiology, 69(4), 1347–1352. [DOI] [PubMed] [Google Scholar]
- 23.Liebau F, Jensen MD, Nair KS, & Rooyackers O (2014). Upper-body obese women are resistant to post-prandial stimulation of protein synthesis. Clinical Nutrition, 33(5) pp. 802–807. [DOI] [PMC free article] [PubMed] [Google Scholar]
- 24.Ghoshal S, Zhu Q, Asteian A, Lin H, Xu H, Ernst G, Barrow JC, Xu B, Cameron MD & Kamenecka TM (2016). TNP [N2-(m-trifluorobenzyl), N6-(p-nitrobenzyl) purine] ameliorates diet induced obesity and insulin resistance via inhibition of the IP6K1 pathway. Molecular Metabolism, 5(10) pp.903–917. [DOI] [PMC free article] [PubMed] [Google Scholar]
- 25.Morton RW, Oikawa SY, Wavell CG, Mazara N, McGlory C, Quadrilatero J, Baechler BL, Baker SK & Phillips SM (2016). Neither load nor systemic hormones determine resistance training-mediated hypertrophy or strength gains in resistance-trained young men. Journal of Applied Physiology, 121(1) pp.129–138. [DOI] [PMC free article] [PubMed] [Google Scholar]
- 26.Gran P & Cameron-Smith D (2011). The actions of exogenous leucine on mTOR signalling and amino acid transporters in human myotubes. BMC Physiology, 11(1) pp.10. [DOI] [PMC free article] [PubMed] [Google Scholar]
- 27.Drummond MJ, Fry CS, Glynn EL, Timmerman KL, Dickinson JM, Walker DK, Gundermann DM, Volpi E & Rasmussen BB (2011). Skeletal muscle amino acid transporter expression is increased in young and older adults following resistance exercise. Journal of Applied Physiology, 111(1) pp.135–142. [DOI] [PMC free article] [PubMed] [Google Scholar]
- 28.Hodson N, Brown T, Joanisse S, Aguirre N, West DW, Moore DR, Baar K, Breen L & Philp A (2017). Characterisation of L-type amino acid transporter 1 (LAT1) expression in human skeletal muscle by immunofluorescent microscopy. Nutrients, 10(1) pp.23. [DOI] [PMC free article] [PubMed] [Google Scholar]
- 29.Matthews DE (2007). An overview of phenylalanine and tyrosine kinetics in humans. The Journal of Nutrition, 137(6) pp.1555. [DOI] [PMC free article] [PubMed] [Google Scholar]
- 30.Chang TW, & Goldberg AL (1978). The metabolic fates of amino acids and the formation of glutamine in skeletal muscle. Journal of Biological Chemistry, 253(10) pp.3685–3693. [PubMed] [Google Scholar]
- 31.Rothwell SW, Poth M, McIver H, Ayika C, Eidelman O, Jozwik C, & Pollard HB (2011). Plasma Proteomic Signature in Overweight Girls Closely Correlates with Homeostasis Model Assessment (HOMA), an Objective Measure of Insulin Resistance. Human Genomics and Proteomics: HGP, 2011, 323629. [DOI] [PMC free article] [PubMed] [Google Scholar]
- 32.Pellis L, van Erk MJ, van Ommen B, Bakker GC, Hendriks HF, Cnubben NH, … & Wopereis S (2012). Plasma metabolomics and proteomics profiling after a post-prandial challenge reveal subtle diet effects on human metabolic status. Metabolomics, 8(2) pp.347–359. [DOI] [PMC free article] [PubMed] [Google Scholar]


