

Abstract
Background:
Few studies have used nationally representative data to describe dietary trends and the related cardiometabolic mortality burden in China. Thus, we aimed to characterize the trends in disease-related dietary factors as well as their associated disease burden among Chinese adults from 1982 to 2012.
Methods:
We conducted a comparative risk assessment including a nationally representative sample of 204,802 adults aged 20 years or older from the 1982, 1992, 2002 and 2010–2012 China National Nutrition (and Health) Surveys.
Findings:
The overall population attributable fraction (PAF) of mortality from cardiovascular disease and type 2 diabetes that was associated with suboptimal dietary quality was 62.2% in 1982, 57.9% in 1992, 56.2% in 2002 and 51.0% in 2010–2012, which accounted for 21.6%, 16.6%, 17.6% and 20.8% of the total mortality in China during each respective survey year. The estimated number of cardiometabolic deaths associated with suboptimal dietary intakes was 1.07 million in 1982, 0.93 million in 1992, 1.18 million in 2002 and 1.51 million in 2010–2012. Of all the dietary factors, high sodium intake (PAF%=17.3%), low fruit consumption (PAF%=11.5% ) and low marine omega-3 fats (9.7%) were associated with the largest numbers of estimated cardiometabolic deaths in 2010–2012.
Interpretation:
We observed an improvement in several dietary factors in China in the past several decades. However, the current levels of these factors remain suboptimal. Poor diet quality is estimated to be associated with a substantial proportion of mortality from heart disease, stroke, and type 2 diabetes in China.
Keywords: China, diet quality, heart disease, stroke, diabetes, disease burden
Introduction
In the past several decades, dietary patterns in China have undergone rapid changes.1 In China, suboptimal diet is one of the leading causes of mortality2 and chronic diseases, including diabetes and cardiovascular disease3,4. From 1990 through 2010, combined dietary factors including the over-consumption of sodium and inadequate intake of fruit, whole grains, nuts, and seeds, were the top risk factors for disability-adjusted life years in China2. Although it is clear that dietary patterns are related to the chronic disease burden in China, there is a lack of information on trends in consumption of individual foods and nutrients and the cardiometabolic disease burdens associated with these dietary factors, based on nationally representative data. Previous studies using the China Health and Nutrition Surveys, which were administered in only nine provinces and not nationally-representative, observed a modest improvement in multiple dietary pattern components.3,4 However, the surveys indicated that overall dietary quality was still inadequate for optimal health and disease prevention in China. Using data from the 1982, 1992, 2002 and 2010–2012 CNNSs, the current study was aimed to comprehensively describe the dietary transition and related cardiometabolic mortality burden, at a national level among Chinese adults from 1982 to 2012. Additionally, we examined the population-wide increases in mean body mass index and blood pressure that occurred over three decades, as important risk factors for cardiometabolic mortality.6
Methods
Study population and sampling
Data for this study were obtained from the 1982, 1992, 2002 and 2010–2012 CNNSs which were nationally representative cross-sectional studies conducted by the Chinese Center for Disease Control and Prevention to assess the health and nutrition of Chinese civilians.5 All four surveys had similar designs, used comparable sampling methods and collected comparable data from household visits, dietary interviews, body measurements, and laboratory tests.
The survey design and methods have been described in detail previously.5 In brief, the surveys covered 27, 30, 31, and 31 provinces (including autonomous regions and centrally-administered municipalities), in 1982, 1992, 2002 and 2010–2012, respectively. A stratified and multi-stage cluster random sampling method was applied in all four surveys. The 1982, 1992, 2002 and 2010–2012 CNNS recruited 28,124, 100,201, 247,464 and 188,622 participants, respectively, with response rates of 87.9% in 2002 and 76.5% in 2010–2012. The 1982 and 1992 response rates were not recorded. For the current analysis, we limited the study sample to adults aged 20 years or over with dietary intake data, which resulted in sample sizes of 39,008, 58,316, 52,426 and 55,052 participants in 1982, 1992, 2002 and 2010–2012, respectively.
Data collection and measurements
All four CNNSs followed comparable frame of organization and investigator training procedure (Appendix Figure 1). Dietary information was collected for 5 days in 1982 by trained investigators who weighed all available foods in participants’ home at the beginning of the first day, recorded (weighed if necessary) all new foods brought into the homes during the 5 days and weighed all leftovers at the end of the fifth day to calculate all foods consumed by participants for those 5 days. In the 1992, 2002 and 2010–2012 surveys, diet was assessed using 3 consecutive days (including 2 weekdays and 1 weekend) of 24-hour dietary recalls in addition to weighing household cooking oil and condiments. For each dietary recall day, investigators went to the participants’ home and helped to record food intake during the last 24-hours. Investigators also weighed the household cooking oil and condiments at the beginning and end of each 24-hour dietary survey (Appendix). Nutrient intakes were calculated using the China Food Composition Tables (FCT)7–9, which are continuously updated with commonly consumed foods and changes in nutrient composition. Specifically, FCT-19917 was used for dietary data from the 1982 and 1992 CNNSs; and FCT-20028/20049 was used for dietary data from the 2002 and 2010–2012 CNNSs. We evaluated energy adjusted dietary intakes for each dietary factor using the residual method10 to 2000 kcal/day, except for polyunsaturated fatty acids (PUFA), which were calculated as a percentage of total energy intake. To estimate the proportion of participants meeting or exceeding national dietary recommendations, we applied the recommendation criteria for food intakes (g/1000kcal) from 2016 Chinese Dietary Guidelines and criteria of nutrients from the Chinese Dietary Reference Intakes (Appendix Table 1).11 Fasting body weight, height and blood pressure were measured by trained investigators (Appendix).
Comparative risk assessments
We applied population-level comparative risk assessments (CRA)12 to estimate the number and proportion of cardiometabolic deaths that would have been prevented in the period of analysis if the distribution of a specific dietary risk factor exposure had been changed to a hypothetical alternative distribution, while holding other risk factors constant. We examined the effects of suboptimal intakes of 12 dietary factors individually and collectively. For the analysis, we separated the participants into 28 groups by sex, urbanization (urban or rural) and age at measurement (20–29, 30–39, 40–49, 50–59, 60–69, 70–79 or ≥80 years). The method of CRA is described in detail in the Appendix.
Statistical analysis
All CNNSs were designed to provide accurate estimates of nutritional status in the Chinese population according to sex, age, and level of economic development. We calculated the mean (standard deviation) of each risk factor by sex, age group and urban/rural status for each CNNS year. Applying the post-stratification population sampling weights derived for the dietary surveys from the sampling probability of the 1980, 1990, 2000 and 2010 Chinese population aged 20 years or above (based on census data), we estimated nationally representative population levels for intakes of foods and nutrients. To quantify time trends of the risk factors, our regression models included the year of each survey as a continuous variable.
Assuming a causal relationship between each risk factor and cardiometabolic mortality, we calculated the population attributable fraction (PAF)12 to estimate the proportional reduction in cardiometabolic deaths that would occur if each risk factor’s exposure were reduced to an alternative optimal level. These methods are described in detail in the Appendix.
All statistical analyses were conducted using SAS software, version 9.4 (SAS Institute, Cary, NC).
Role of the funding source
The study’s sponsors had no role in study design, data collection, analysis, interpretation, or write-up. Prof. He and Ding had full access to all study data. All lead authors and correspondent authors had final responsibility for the decision to submit for publication. All authors contributed to the research, commented on the manuscript drafts, and agreed to submit the final draft for publication.
Results
Across the four CNNSs, 204,802 participants aged 20 years or over had complete dietary intake data (Table1). Compared to the 1982 survey sample, the 2010–2012 sample consisted of higher proportions of older adults and urban residents and lower proportions of younger adults and rural residents, reflecting increasing trends of aging and urbanizationin in China (Appendix Table 3).
Table 1.
Sociodemographic distribution of participants in the 1982, 1992, 2002 and 2010–2012 China National Nutrition Surveys
| China National Nutrition Surveys | ||||
|---|---|---|---|---|
| 1982 | 1992 | 2002 | 2010–2012 | |
| Total | 39008 | 58316 | 52426 | 55052 |
| Age group (years) | ||||
| 20–34 | 17668 (45.3) | 22436 (38.5) | 13651 (26.0) | 8742 (15.9) |
| 35–49 | 10178 (26.1) | 18960 (32.5) | 18584 (35.4) | 16882 (30.7) |
| 50–64 | 7787 (20.0) | 11807 (20.2) | 13790 (26.3) | 18806 (34.2) |
| 65–79 | 2995 (7.7) | 4484 (7.7) | 5835 (11.1) | 9444 (17.2) |
| 80 or older | 380 (1.0) | 629 (1.1) | 566 (1.1) | 1178 (2.1) |
| Sex (%) | ||||
| Male | 19386 (49.7) | 28010 (48.0) | 24709 (47.1) | 25278 (45.9) |
| Female | 19622 (50.3) | 30306 (52.0) | 27717 (52.9) | 29773 (54.1) |
| Living area (%) | ||||
| Urban | 13744 (35.2) | 17633 (30.2) | 17530 (33.4) | 27471 (49.9) |
| Rural | 25264 (64.8) | 40683 (69.8) | 34896 (66.6) | 27581 (50.1) |
The average daily energy intake was 2,783 kcal/day in 1982 survey, which was much higher than 2,064 kcal/day in 2010–2012 survey. In 1982, carbohydrates contributed over four-fifths (80.8%) of the study population’s total energy intake, which was higher than in the 1992, 2002 and 2010–2012 samples for which carbohydrates contributed 74.4%, 62.8% and 55.9% of total energy intake, respectively. Meanwhile, energy contribution from fat was 12.0% in 1982, but was much higher (32.3%) in the 2010–2012 survey, Table 2.
Table 2.
Mean consumption of key dietary components among Chinese adults aged 20 years or over in the China National Nutrition Surveys: 1982, 1992, 2002 and 2010–2012
| China National Nutrition Surveys | Changes 1982–2012§ | |||||
|---|---|---|---|---|---|---|
| 1982 | 1992 | 2002 | 2010–2012 | Mean | % | |
| Energy intake (kcal) | 2783 (22) | 2638 (16) | 2271 (23) | 2064 (27) | −719 | −25.8% |
| Protein (%E) | 7.2 | 9.6 | 10.8 | 11.8 | 4.6 | 63.9% |
| Fat (%E) | 12.0 | 16.0 | 26.4 | 32.3 | 20.3 | 169.2% |
| Carbohydrate (%E) | 80.8 | 74.4 | 62.8 | 55.9 | −24.9 | −30.8% |
| Disease burden related factors* | ||||||
| Sodium (g) | 6.5 (0.2) | 6.3 (0.1) | 5.9 (0.1) | 5.2 (0.1) | −1.3 | −20.0% |
| Marine omega-3 fatty acid (mg) | 1.2(0.1) | 2.0(0.2) | 2.5(0.3) | 3.6(0.3) | 2.4 | 200.0% |
| Fruit (g) | 17.0(4.5) | 22.8(3.2) | 31.5(2.7) | 39.3(3.2) | 22.3 | 131.2% |
| Whole grains (g) | 91.0(11.9) | 24.6(3.8) | 21.4(3.3) | 14.6(1.5) | −76.4 | −83.9% |
| Nuts (g) | 1.2(0.3) | 1.8(0.3) | 3.2(0.3) | 3.4(0.2) | 2.2 | 183.3% |
| PUFA (%E) | 2.9(0.1) | 4.2(0.1) | 7.1(0.2) | 8.6(0.2) | 5.7 | 196.6% |
| Total vegetables (g) | 330(16) | 267(7) | 257(7) | 248(5) | −82 | −24.8% |
| Processed meat (g) | 2.0(0.6) | 1.8(0.2) | 2.9(0.5) | 3.6(0.3) | 1.6 | 80.0% |
| Red meat (g) | 18.2(1.6) | 42.2(1.6) | 55.5(2.7) | 64.4(2.7) | 46.2 | 253.8% |
| Refined grains (g) | 407(8) | 388(4) | 323(5) | 304(4) | −103 | −25.5% |
| Low-fat dairy products (g) | 0.1(0.1) | 0.1(0.0) | 0.4(0.1) | 0.1(0.0) | 0.0 | - |
| Sugar-sweetened beverage (g) | 0.0(0.1) | 0.3(0.0) | 1.9(0.3) | 12.0(4.3) | 11.9 | - |
| Other dietary guideline** related factors | ||||||
| Egg (g) | 4.2(0.4) | 13.5(0.6) | 23.8(1.1) | 23.5(0.8) | 19.3 | 461.9% |
| Fish, shellfish and other seafood (g) | 4.4(0.6) | 26.0(1.7) | 31.5(3.1) | 23.0(2.1) | 18.6 | 422.7% |
| Total dairy products (g) | 16.8(6.2) | 10.5(1.4) | 27.0(2.9) | 23.1(1.8) | 6.3 | 37.5% |
| Soybeans (g) | 7.1(0.7) | 7.2(0.5) | 10.9(0.7) | 9.8(0.4) | 2.7 | 38.0% |
| Dark color vegetables (g) | 71.8(6.7) | 92.2(4.7) | 87.2(4.8) | 80.5(3.4) | 8.7 | 12.1% |
| Saturated fatty acid (%E) | 3.3(0.2) | 4.4(0.1) | 6.6(0.2) | 7.4(0.1) | 4.0 | 121.2% |
| Alcohol (g) | 1.0(0.2) | 0.0(0.4) | 1.4(0.3) | 1.6(0.2) | 0.6 | 60.0% |
| Vegetable oil for cooking (g) | 9.6(0.6) | 15.8(0.6) | 29.6(1.2) | 33.8(1.0) | 24.2 | 252.1% |
| Animal fat for cooking (g) | 4.0(0.4) | 4.6(0.4) | 6.3(1.0) | 4.3(0.6) | 0.3 | 7.5% |
Food groups selected based on evidence from the most recent meta-analyses and systematic reviews and defined based on 2016 Chinese Dietary Guidelines
Food groups in the guidelines included fruit (fresh fruit, excluding canned fruit and dried fruit), whole grains (grain foods with fiber/carbohydrate ratio ≥0.1, such as corn), refined grains (grain foods with fiber/carbohydrate ratio <0.1, such as white rice and refined wheat flour products), nuts (peanuts, tree nuts and seeds), processed meat (bacon, ham, sausage, meat processed outside household), red meat (pork, beef, lamb), sugar-sweetened beverage (carbonated drinks, fruit drinks, sweetened tea), low fat dairy products (fat values per 100g milk equivalence < 2g), dark color vegetables (spinach, carrot, green pepper, chives).
All Ps for trend <0.05, regression models included the year of each survey as a continuous variable.
Sodium and refined grain intake decreased by 20.0% and 25.5%, respectively; consumption of marine omega-3 fatty acids, fruits, nuts, and PUFA also increased moderately, Table 2. However, during the same time period, consumption of whole grains and vegetables decreased and consumption of red meat, processed meat, and sugar-sweetened beverages increased. When examining other dietary factors included in the Chinese Dietary Guidelines, we observed relatively large increases in the consumption of eggs, fish, and vegetable oils, Table 2.
The proportion of adults consuming the minimum recommended amounts of fruits and dairy products was <10%, with a slightly increasing trend from 1982 to 2012 (Figure 1). Over 80% and 90% of the population exceeded the maximum recommended amount of refined grain and sodium intakes. From 1982–2012, there was a significant decreasing trend in the proportion of Chinese adults who met the minimum recommendations for whole grains and vegetables, and an increasing trend in the proportion exceeding the maximum recommended calories from meat and saturated fat, Figure 1.
Figure 1: Proportion of Chinese adults meeting (A) or exceeding (B) Chinese National dietary recommendations* in the China National Nutrition Surveys 1982–2012.
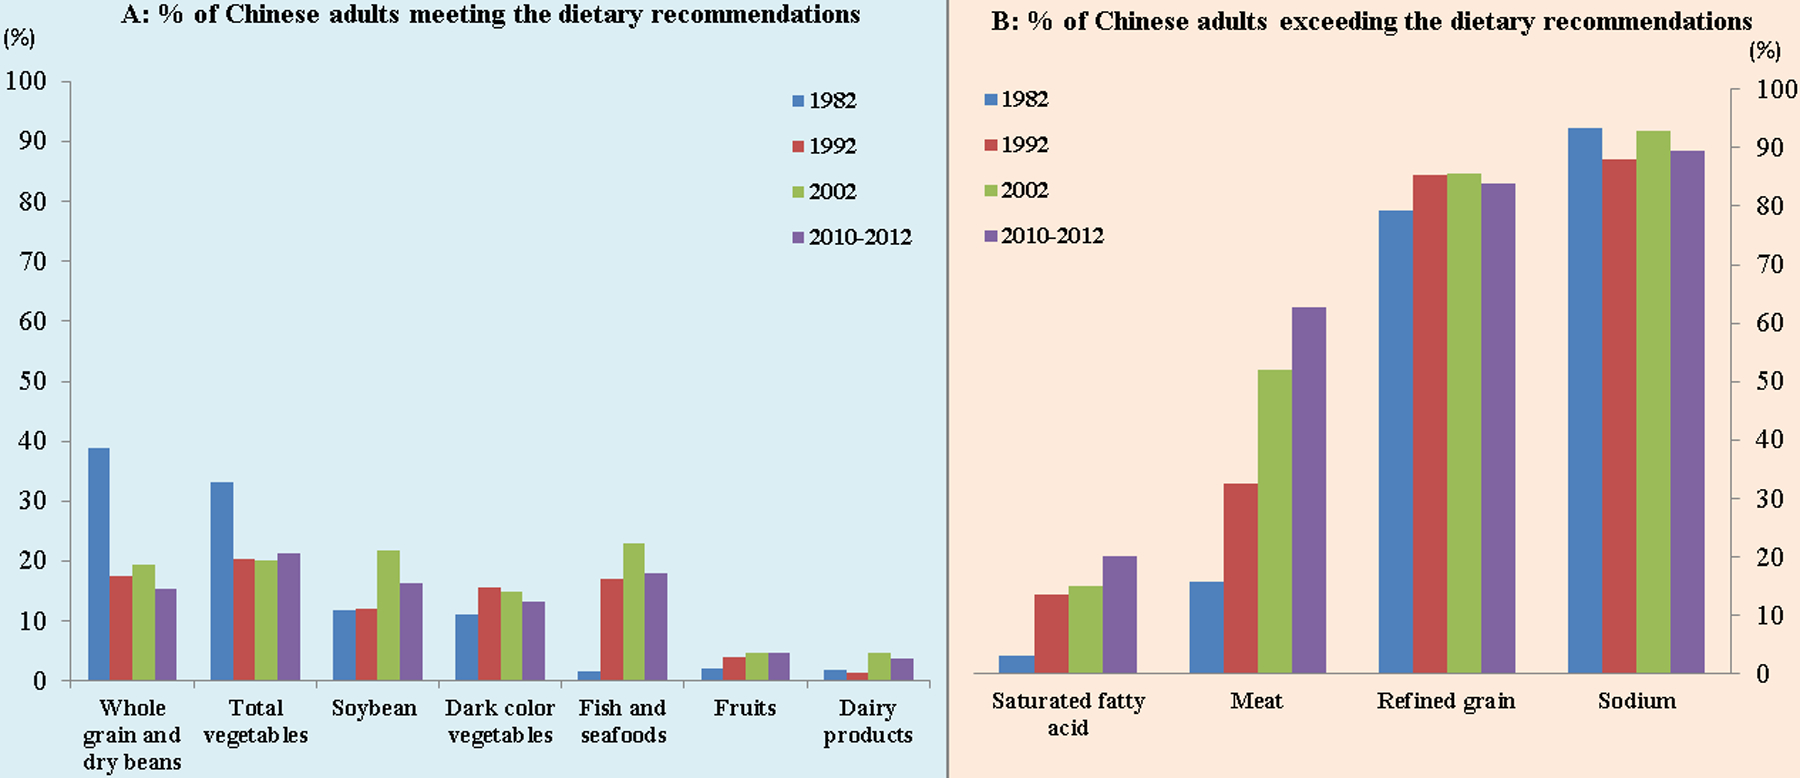
*Standards according to Chinese national dietary recommendations: Whole grain and dry bean: ≥20g/1000kcal; Total vegetable : ≥180g/1000kcal; Soybean: ≥ 10g/1000kcal; Dark color vegetable: ≥90g/1000kcal; Fish and seafoods: ≥25g/1000kcal; Fruit: ≥110g/1000kcal; Dairy products: ≥100g/1000kcal; Saturated fatty acid: <10%E; Refined grain:≤100g/1000kcal; Meat: ≤25g/1000kcal; Sodium: ≤1g/1000kcal
High sodium intake was the leading dietary risk factor for cardiometabolic mortality and was associated with a PAF of 27.0% in 1982, which was 17.3% in 2010–2012 (Figure 2). Low intakes of fruits, marine omega-3 fat, vegetables, whole grains, and nuts were also important risk factors for cardiometabolic mortality in China, with a PAF of 11.5%, 9.7%, 7.3%, 8.1% and 8.2%, respectively, in 2010–2012. High intakes of red meat, processed meat, refined grains, and SSBs and low intakes of low-fat dairy products were also associated with cardiometabolic mortality, Figure 2. Suboptimal levels of all 12 dietary factors combined were associated with 1.07, 0.93, 1.18 and 1.51 million cardiometabolic deaths in 1982, 1992, 2002 and 2010–2012, respectively, accounting for 62.2%, 57.9%, 56.2% and 51.0% of all cardiometabolic deaths; those death events accounted for 21.6%, 16.6%, 17.6% and 20.8% of total death in China, for each respective survey year, Figure 3.
Figure 2.
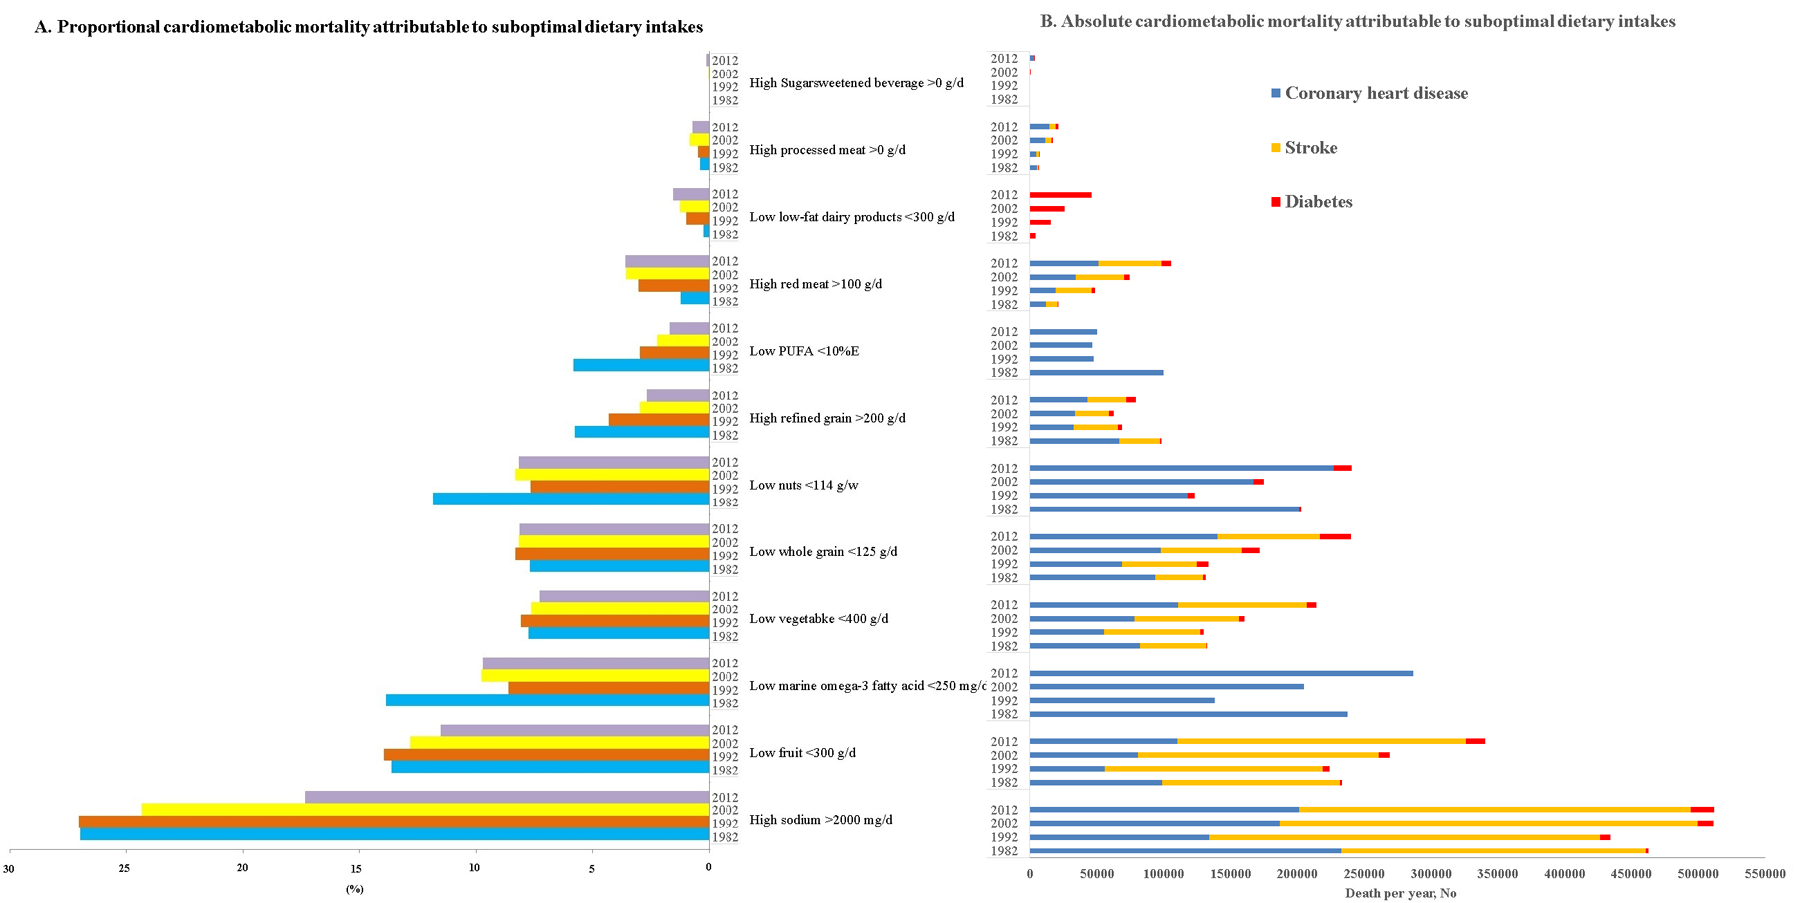
Absolute and proportional cardiometabolic disease mortality associated with suboptimal dietary intake of individual foods and nutrients among Chinese adults 1982–2012
Figure 3.
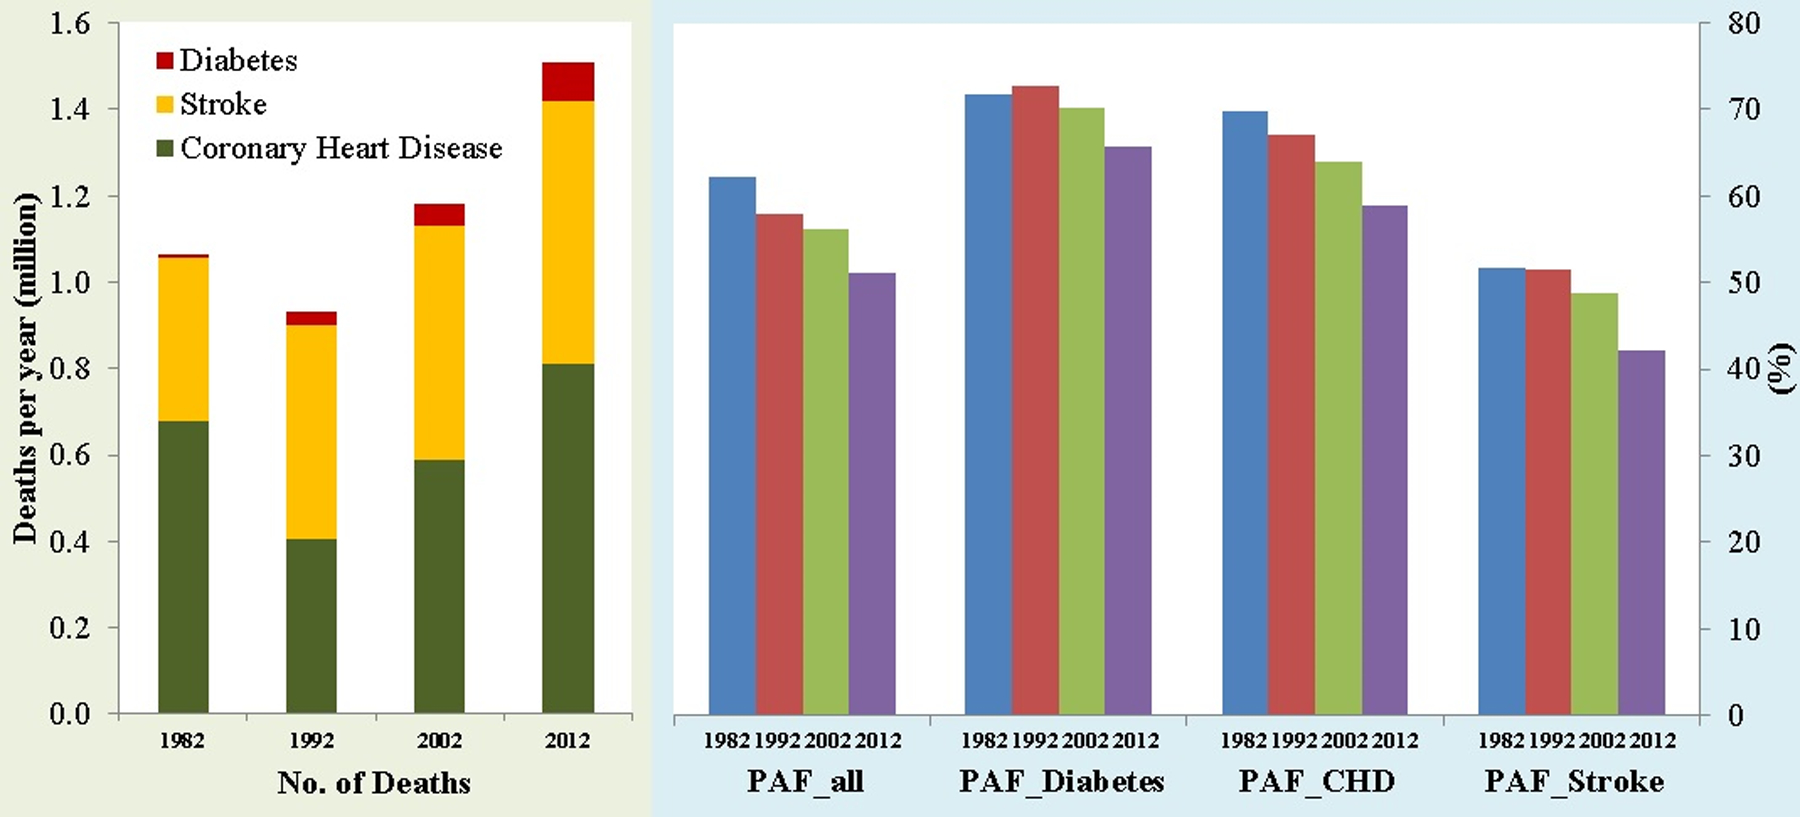
Absolute and proportional cardiometabolic disease mortality associated with overall suboptimal dietary habits among Chinese adults 1982–2012
The mean BMI in China was 21.1kg/m2 in 1982 and 23.9 kg/m2 in 2010–2012, with an average increase rate of around one BMI unit per decade and an increasingly overweight prevalence across all age groups, Figure 4A. The average systolic blood pressure increased from 115 mmHg in 1982 to 123 mmHg in 2010–2012, with increasing prevalence among all age groups over 40 years (Figure 4B). These shifts resulted in dramatic increases in the number of overweight Chinese adults (Figure 4C) and the number with hypertension (Figure 4D). In 1982, 0.07 million cardiometabolic deaths were attributable to high BMI and 0.77 million were attributable to high systolic blood pressure. By 2012, the number of deaths attributable to high BMI and systolic blood pressure had increased to 0.33 million and 1.11 million, respectively (Figure 4E & 4F).
Figure 4.
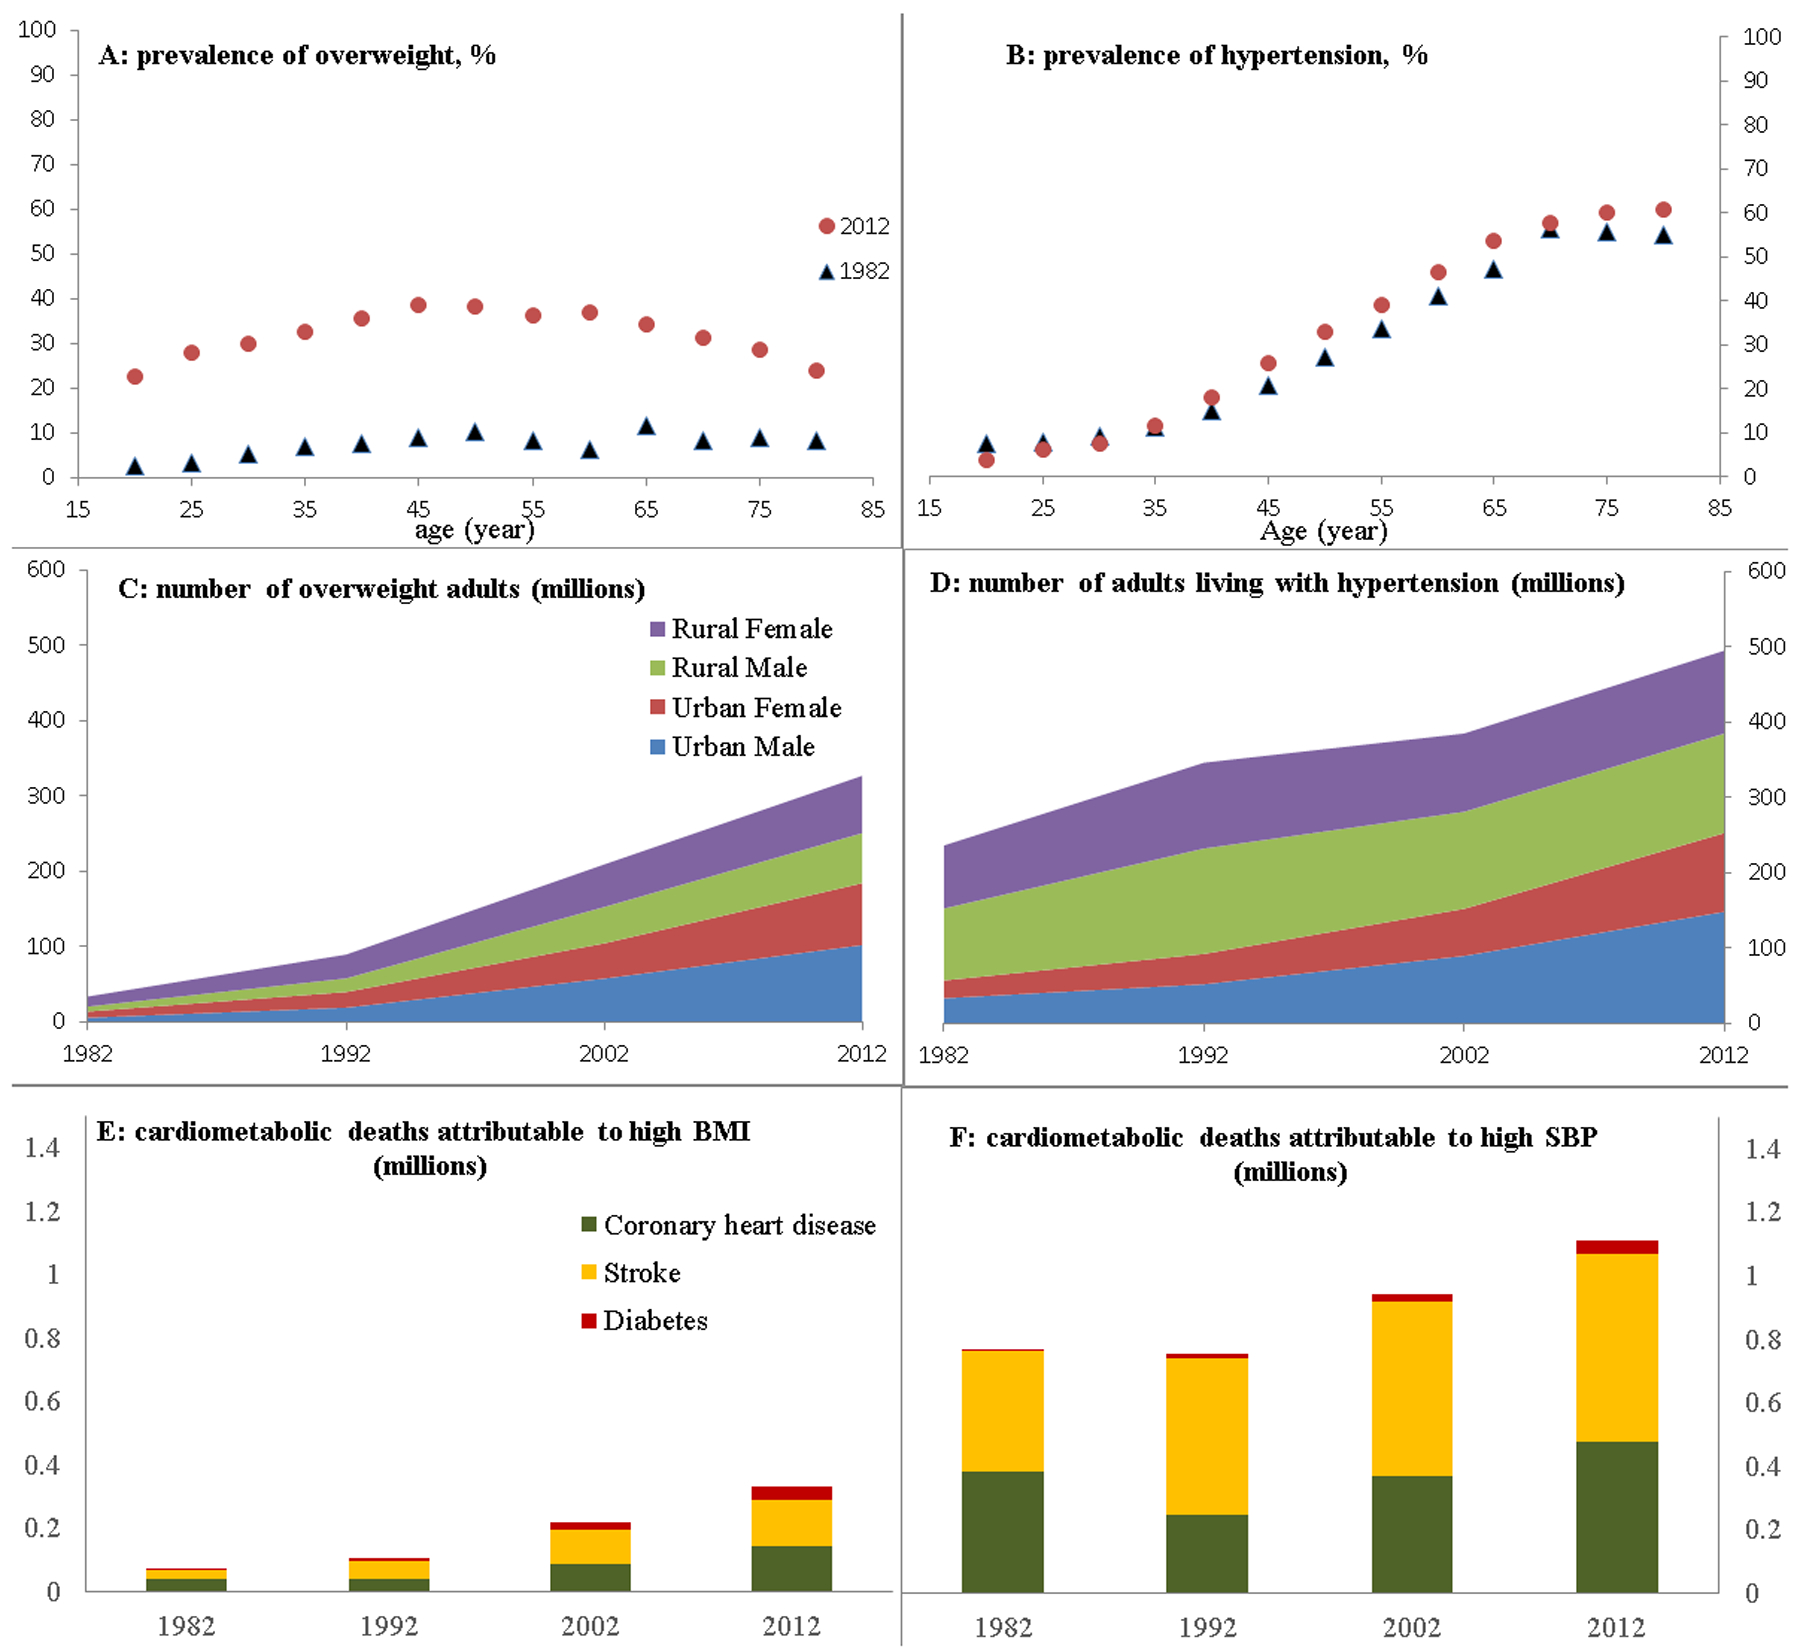
Prevalence of overweight/obesity and hypertension and the associated cardiometabolic mortality burden in the Chinese population 1982–2012
Discussion
Using a comparative risk assessment model and nationally representative dietary data, we comprehensively estimated the number of cardiometabolic deaths related to suboptimal dietary habits among Chinese adults from 1982 to 2012, taking into account population growth and aging. According to the CNNSs, some aspects of Chinese dietary patterns improved from 1982 to 2012. There was a relatively large improvement in the PAF of a combination of 12 dietary factors associated with cardiometabolic mortality, which decreased from 62.2% in 1982 to 51.0% in 2010–2012. Although this improvement in diet may have slowed the rapid increase in cardiometabolic deaths occurring in China, the absolute number of cardiometabolic deaths still increased substantially from 1982 to 2012. During the same time period, the population BMI distribution and systolic blood pressure distribution both shifted towards the right, increasing on average by 2.8 kg/m2 and by 8 mmHg, respectively. In 2010–2012, an estimated 0.33 million and 1.11 million cardiometabolic deaths were attributable to high BMI and systolic blood pressure, respectively.
Despite the observed dietary improvements, our study indicates that in China, suboptimal dietary factors were associated with 51% of all cardiometabolic deaths in 2010–2012 (and these cardiometabolic deaths accounted for 20.8% of total deaths); which is greater than that in the US, where 45.4% of cardiometabolic deaths were attributable to suboptimal diet in 2012.6 Worldwide in 2016, suboptimal diet was the second-leading risk factor for DALYs and deaths, accounting for 9.6% of all DALYs and 18.8% of all deaths.13 In the US, suboptimal diets are associated with more all-cause deaths than any other risk factors.14 In China, dietary factors are also the leading risk factor for morbidity and mortality, accounting for 16.3% of disability-adjusted life-years (DALYs) and 30.6% of all-cause deaths in 2010.2 Compared to the proportion of all-cause deaths due to dietary factors estimated in the GBD-China 20102, our estimate (20.8%) was lower, because we only estimated the cardiometabolic deaths while the GBD-China 2010 also included other causes of death, such as cancer. Additionally, in our combined group of dietary factors, we chose not to include some foods and nutrients that the GBD-China collaborators included, such as fiber, to avoid potential overlap with other dietary risk factors such as whole grains.
We observed notable improvement in several dietary factors, including increases in marine omega-3 fat, fruit, nuts, and PUFA, and decreases in sodium and refined grains. Total energy intake decreased substantially from 1982 to 2012, largely reflecting a dramatic decrease in physical activity levels accompanied by rapid urbanization. Despite some dietary improvements, we observed a Westernization of dietary patterns which included decreased vegetable and whole grain intakes, and increased red meat, processed meat, SSB, saturated fat, and alcohol intakes. These dietary changes led to a dramatic change in macronutrient composition of Chinese diet from a very high carbohydrate diet to a relatively high fat diet. Previous studies have reported similar trends in the Chinese population, showing increased consumption of animal-based diets1 and transitioning to dietary patterns similar to Western patterns.15 The Westernization of dietary patterns in China, together with sedentary lifestyles and other obesogenic factors16,17 likely offset the protective effects from dietary improvements and contributed to the increase in the prevalence of obesity and hypertension in China.
Concerted efforts are needed to improve dietary quality in light of the increasing trends in BMI and blood pressure and the high burden of cardiometabolic disease in China. Improvement in diet quality and reducing unhealthy dietary behaviors should be promoted at local and national levels and be supported by public policies in China. Intervention programs and policies that have been successful in other countries can be adapted to the unique characteristics of the food system and culture in China. Greater adherence to the Chinese Dietary Guidelines, along with their visual representation (the Chinese Food Pagoda) has been associated with a lower mortality risk, especially for cardiometabolic mortality, in Chinese men and women.18 Adherence to a healthier dietary pattern has also been associated with a lower mortality risk in Koreans, Japanese and Singapore Chinese.19–21 Compared with Japan and Korea, the average consumption levels that we observed in China were much lower for fish, marine omega-3 fatty acid, and fruit and were higher in vegetables and PUFA. We also found that the Chinese population had lower intakes of SSBs and processed meat than Japanese or Koreans. China, Japan and Korea all had higher sodium intake levels than the overall world average level.22
The current study has a number of strengths. Using the most recent nationally representative data available, it provides an up-to-date description of dietary patterns in Chinese adults. To our knowledge, this study is the first population-level analysis of the association between cardiometabolic mortality and overall dietary patterns in China, using the comparative risk assessment method. It is also the first to incorporate population aging and growth in a time-trend analysis of the cardiometabolic mortality burden. Previous disease burden estimations included events at only one time point which reflected changes in PAFs but ignored population aging and growth.3,4 In the current study, we accounted for population aging and growth by estimating cardiometabolic mortality events using the cardiometabolic rate combined with the Chinese population census data in 1980, 1990, 2000 and 2010. We also accounted for demographic data including age, sex, and urban or rural living area. Additionally, our findings are generalizable to the Chinese adult population as a whole because we used nationally representative cardiometabolic death and dietary intake data.
Several limitations should also be considered when interpreting our results. First, the risk factors’ etiological effects on cardiometabolic mortality were mainly derived from meta-analyses of studies conducted in Western populations, although when possible we did prioritize meta-analyses in Asian populations.23 However, the observational studies included in these meta-analyses adjusted for potential confounding variables, therefore the associations likely represent underlying physiological mechanisms connecting diet and cardiometabolic diseases, which are generally similar across different populations. Future estimations are warranted when additional meta-analyses from Asian, specifically Chinese, populations become available. Second, we cannot draw conclusions about causality from our study, because our estimation of the cardiometabolic mortality burden is based on the theoretical ideal level of each individual risk factor, in combination with the effect size for each factor estimated from meta-analyses of observational cohort studies. Our estimation based on the comparative risk assessment model cannot prove that changes in these dietary factors would reduce cardiometabolic mortality risk in the way that we estimated. Third, our estimation of dietary intake was mainly based on 3-day 24-hour dietary recalls, and thus measurement error is inevitable. To reduce measurement errors and selection bias from different age group or urban/rural areas, we took the average of three 24-hour dietary recalls and used the stratum-specific mean intakes, adjusted for total energy intake. Fourth, as death certificates were a major source of cause-of-death ascertainment, when interpreting our results it is important to consider that the way physicians complete death certificates or assign death causes is based on available information and may be subject to potential bias,24 especially for deaths outside of the hospital, which might result in bias in estimating the total number of cardiometabolic deaths. Finally, we were not able to stratify according to geographic locations, which warrants further studies as various geographic locations in China have substantial differences in dietary patterns and disease patterns.25
In conclusion, using four nationally representative dietary surveys in China conducted from 1982 to 2012, we observed several improvements in dietary intakes including decreased sodium and increased fruit, nut, marine omega-3 fatty acid, and PUFA intakes; however, the current consumption patterns for these factors remain suboptimal. We also observed a rapid Westernization of the Chinese diet including increases in consumption of red meat, processed meat, and SSBs. A combination of 12 dietary risk factors was associated with 62.2% of all cardiometabolic deaths in 1982. This PAF improved to 51% in 2010–2012 (accounting for 20.8% of total deaths). Despite this improvement, the cardiometabolic disease burden associated with dietary factors remains alarmingly high, which underscores the need for public health nutrition strategies to improve diet quality in China.
Supplementary Material
Research in context.
Evidence before this study
We conducted literature searches in PubMed for studies published up to January 31, 2019, using the following key terms: (“stroke” or “diabetes” or “cardiovascular disease” or “heart disease”), and “mortality burden” and “China” and (“food” or “nutrition” or “diet”), with no language restrictions. We also searched references listed in the identified papers. Several papers, including our previous publications, examined the diabetes or cardiovascular disease burdens associated with the dietary transition in China. However, the samples in these studies were not nationally representative and did not consider population growth. Some of the papers we identified did estimate disease burdens associated with lifestyle factors at a national level; however, they examined burdens of total mortality and overall disability-adjusted life years, rather than cardiometabolic disease. The Global Burden of Disease Study indicated that dietary factors are the leading risk factor for morbidity and mortality in China, accounting for 16.3% of disability-adjusted life-years (DALYs) and 30.6% of all-cause deaths in 2010. However, there is a lack of information on trends in consumption of individual foods and nutrients and the cardiometabolic disease burdens associated with these dietary factors, based on nationally representative data in China.
Added value of this study
Using a comparative risk assessment model and nationally representative dietary data from the China National Nutrition Surveys (CNNSs), we comprehensively estimated the number of cardiometabolic deaths related to suboptimal dietary habits among Chinese adults in 1982, 1992, 2002 and 2010–2012, taking into account population growth and aging. We found that the population attributable fraction of a combination of 12 dietary factors associated with cardiometabolic mortality decreased from 62.2% in 1982 to 51.0% in 2010–2012. However, the absolute number of cardiometabolic deaths increased substantially from 1982 to 2012. During the same time period, the population average of BMI and systolic blood pressure increased by 2.8 kg/m2 and 8 mmHg, respectively, which was associated with an estimated 0.33 million and 1.11 million cardiometabolic deaths. To our knowledge, this study is the first population-level analysis of the association between cardiometabolic mortality and overall dietary patterns in China, using the comparative risk assessment method. It is also the first to incorporate population aging and growth in a time-trend analysis of the cardiometabolic mortality burden and provide an updated description of Chinese adult dietary patterns based on the most recent nationally representative data available.
Implications of all the available evidence
Taken together, the available evidence indicates that dietary transitions are significantly associated with the chronic disease burden in China. Despite some modest improvements over the past few decades, diet quality is still suboptimal. Based on nationally representative data from 1982 to 2012, the Chinese population showed several dietary improvements, including decreased sodium and increased fruit, nut, marine omega-3 fatty acid, and poly-unsaturated fatty acid intakes; however, the current consumption patterns for these factors remain suboptimal. Over the same time period, the Chinese diet underwent a rapid Westernization, including increases in consumption of red meat, processed meat, and sugar-sweetened beverages. Although the proportion of the cardiometabolic disease burden attributable to suboptimal diets has decreased over the past few decades, the burden remains alarmingly high, which underscores the need for policy and public health nutrition strategies to improve diet quality in China.
Acknowledgement:
The authors thank all the team members and participants involved in the China National Nutrition Surveys. For this study, the authors also used data freely available online from the China Public Health Statistical Yearbook and the National Population Census Datasets. Special thanks to Dr. Goodarz Danaei from Harvard T. H. Chan School of Public Health who provided us help in the statistical method and data analysis.
The 1982 CNNS was supported by the Major Program of National Medical and Health Research. The China Ministry of Health provided special funding support to the 1992 CNNS, which was organized by the Ministry of Health, Ministry of Agriculture, Ministry of Public Security and National Bureau of Statistics. The 2002 CNNS was supported by the Ministry of Health and the Ministry of Science and Technology in China (2001-DEA30035, 2003-DIA6N008), UNICEF, WHO, Unilever China, and Danone Nutrition Institute China. The 2010-2012 CNNS was supported by the Special Fund for Health-Scientific Research in the Public Interest (No. 20120212) from the National Health and Family Planning Commission of the People’s Republic of China. Dr. Wang was supported by a postdoctoral fellowship granted by the American Heart Association (16POST31100031).
Funding: The nutrition surveys were supported by the Ministry of Health and the Ministry of Science and Technology in China (2001-DEA30035, 2003-DIA6N008, No. 20120212).
Footnotes
Declaration of Conflict Interest
Dr. Hu reported receiving research support from the California Walnut Commission and honoraria for lectures from Metagenics and Standard Process and honoraria from Diet Quality Photo Navigation, outside the submitted work. Dr. Li reported receiving research support from the California Walnut Commission.
REFERENCES
- 1.Ezzati M, Riboli E. Behavioral and dietary risk factors for noncommunicable diseases. N Engl J Med. 2013;369:954–964. [DOI] [PubMed] [Google Scholar]
- 2.Yang G, Wang Y, Zeng Y et al. Rapid health transition in China, 1990–2010: findings from the Global Burden of Disease Study 2010. Lancet. 2013;381:1987–2015. [DOI] [PMC free article] [PubMed] [Google Scholar]
- 3.Li Y, Wang DD, Ley SH et al. Time trends of dietary and lifestyle factors and their potential impact on diabetes burden in China. Diabetes Care 2017;40:1685–1694. [DOI] [PMC free article] [PubMed] [Google Scholar]
- 4.Li Y, Wang DD, Ley SH ET AL. Potential impact of time trend of lifestyle factors on cardiovascular disease burden in China. J Am Coll Cardiol. 2016;68:818–833. [DOI] [PMC free article] [PubMed] [Google Scholar]
- 5.He Y, Zhao W, Lai J et al. Data Resource Profile: China National Nutrition Surveys. Int J Epidemiol. 2019. January 23. doi: 10.1093/ije/dyy289. [Epub ahead of print]. [DOI] [PubMed] [Google Scholar]
- 6.Micha R, Peñalvo JL, Cudhea F, Imamura F, Rehm CD, Mozaffarian D. Association between dietary factors and mortality from heart disease, stroke, and type 2 diabetes in the United States. JAMA. 2017;317:912–924. [DOI] [PMC free article] [PubMed] [Google Scholar]
- 7.Wang G China Food Composition Table 1991. Beijing: China’s Medical Publishing House; 1991. [Google Scholar]
- 8.Yang Y, Wang G, Pan X. China Food Composition Table 2002. Beijing: Beijing Medical University Publishing House; 2002. [Google Scholar]
- 9.Yang Y, Wang G, Pan X. China Food Composition 2004. Beijing: Beijing Medical University Publishing House; 2005. [Google Scholar]
- 10.Willett WC. Correction for the effects of measurement error In: Nutritional Epidemiology. 3rd ed Oxford, England: Oxford University Press; 2013: 287–304. [Google Scholar]
- 11.The Chinese Nutrition Society. Chinese Dietary Guidelines 2016. People’s Health Publishing House; Beijing, 2016. [Google Scholar]
- 12.Danaei G, Ding EL, Mozaffarian D, et al. The preventable causes of death in the United States: comparative risk assessment of dietary, lifestyle, and metabolic risk factors. PLoS Med. 2009;6:e1000058. [DOI] [PMC free article] [PubMed] [Google Scholar]
- 13.GBD 2016 Risk Factors Collaborators. Global, regional, and national comparative risk assessment of 84 behavioural, environmental and occupational, and metabolic risks or clusters of risks, 1990 –2016: a systematic analysis for the Global Burden of Disease Study 2016. Lancet. 2017; 390:1345–1422. [DOI] [PMC free article] [PubMed] [Google Scholar]
- 14.US Burden of Disease Collaborators, Mokdad AH, Ballestros K, et al. The state of US health, 1990–2016: burden of diseases, injuries, and risk factors among US states. JAMA. 2018;319:1444–1472. [DOI] [PMC free article] [PubMed] [Google Scholar]
- 15.Batis C, Sotres-Alvarez D, Gordon-Larsen P, Mendez MA, Adair L, Popkin B. Longitudinal analysis of dietary patterns in Chinese adults from 1991 to 2009. Br J Nutr. 2014;111:1441–1451. [DOI] [PMC free article] [PubMed] [Google Scholar]
- 16.Hu FB. Diet, Nutrition, and Obesity In eds. Hu F. Obesity Epidemiology. Oxford University press; 2018: 275–300. [Google Scholar]
- 17.Adair LS, Gordon-Larsen P, Du SF, Zhang B, Popkin BM. The emergence of cardiometabolic disease risk in Chinese children and adults: consequences of changes in diet, physical activity and obesity. Obes Rev. 2014;15 Suppl 1:49–59. [DOI] [PMC free article] [PubMed] [Google Scholar]
- 18.Yu D, Zhang X, Xiang YB et al. Adherence to dietary guidelines and mortality: a report from prospective cohort studies of 134,000 Chinese adults in urban Shanghai. Am J Clin Nutr. 2014;100:693–700. [DOI] [PMC free article] [PubMed] [Google Scholar]
- 19.Cho Y, Cudhea F, Park JH et al. Estimating change in cardiovascular disease and diabetes burdens due to dietary and metabolic factors in Korea 1998–2011: a comparative risk assessment analysis. BMJ Open. 2016;6:e013283. [DOI] [PMC free article] [PubMed] [Google Scholar]
- 20.Okada E, Nakamura K, Ukawa S et al. The Japanese food score and risk of all-cause, CVD and cancer mortality: the Japan Collaborative Cohort Study. Br J Nutr. 2018;120:464–471. [DOI] [PubMed] [Google Scholar]
- 21.Neelakantan N, Koh WP, Yuan JM, van Dam RM. Diet-quality indexes are associated with a lower risk of cardiovascular, respiratory, and all-cause mortality among Chinese adults. J Nutr. 2018;148:1323–1332. [DOI] [PMC free article] [PubMed] [Google Scholar]
- 22.Imamura F, Micha R, Khatibzadeh S, et al. , on behalf of the Global Burden of Diseases Nutrition and Chronic Diseases Expert Group (NutriCoDE). Dietary quality among men and women in 187 countries in 1990 and 2010: a systematic assessment. Lancet Glob Health 2015; 3: e132–142. [DOI] [PMC free article] [PubMed] [Google Scholar]
- 23.Schwingshackl L, Schwedhelm C, Hoffmann G et al. Food groups and risk of all-cause mortality: a systematic review and meta-analysis of prospective studies. Am J Clin Nutr. 2017;105:1462–1473. [DOI] [PubMed] [Google Scholar]
- 24.Zhou M, Wang H, Zhu J et al. Cause-specific mortality for 240 causes in China during 1990–2013: a systematic subnational analysis for the Global Burden of Disease Study 2013. Lancet. 2016;387:251–272. [DOI] [PubMed] [Google Scholar]
- 25.He Y, Ma G, Zhai F et al. Dietary patterns and glucose tolerance abnormalities in Chinese adults. Diabetes Care. 2009;32:1972–1976. [DOI] [PMC free article] [PubMed] [Google Scholar]
Associated Data
This section collects any data citations, data availability statements, or supplementary materials included in this article.