Abstract
In this paper, we report a fiber-optic pressure sensor fabricated by three-dimensional (3D) printing of glass using direct laser melting method. An all-glass fiber-housing structure is 3D printed on top of a fused silica substrate, which also serves as the pressure sensing diaphragm. And an optical fiber can be inserted inside the fiber housing structure and brought in close proximity to the diaphragm to form a Fabry-Perot interferometer. The theoretical analysis and experimental verification of the pressure sensing capability are presented.
Index Terms-: Three-dimensional printing, All-glass pressure sensor, fiber optics, Extrinsic Fabry-Perot interferometer
I. Introduction
Pressure monitoring is of great interests in various important applications where pressure of the environment usually provides real time information to understand and control the processes [1,2], such as oil and gas pipelines pressure metering [3], turbines [4] and downhole pressure monitoring [5]. Pressure monitoring in many cases is under harsh environments, like, high temperature, time-varying aqueous environments. As such, it is desirable in harsh environments for pressure sensors to be capable of operating at high temperatures (e.g., 500 °C) and immune to surrounding environments. Optical fiber sensors have been widely investigated over the last several decades for pressure sensing. Over the years, various optical fiber sensors have been proposed and demonstrated for pressure sensing, such as fiber interferometers [6–8], fiber Bragg gratings [9–11], whispering gallery mode optical resonators [12] and micro-bending sensors [13]. Generally, these optical devices have a compact size, high sensitivity, fast response, immunity to electromagnetic interference (EMI), and promising broad applications.
Fiber-optic extrinsic Fabry-Perot interferometer (EFPI) is among the popular choices for pressure monitoring, owing to its advantages of high spatial resolution and independence to polarization changes [6,8,14,15]. A typical EFPI pressure sensor uses a diaphragm as the sensing element. Pressure induced diaphragm’s deformation generates the change of interferometer’ s optical path difference (OPD). And the change of OPD is monitored by the interferometer with high sensitivity and high resolution. In recent years, both fiber inline EFPI sensors and assembly-based EFPI sensors have been reported for pressure monitoring. In general, the sensitivity and pressure range of assembly-based sensors is easy to be adjusted by tuning the dimension of the diaphragm. While at the same time, typically, there exists the mismatch of coefficients of thermal expansion (CTE) between different materials (e.g., glass and bonding materials), resulting in the large temperature cross-sensitivity and sometimes limitations in working temperatures. Comparatively, Assembly-free fiber inline EFPI sensors have a compact size and improved mechanical robustness, thanks to various micromachining techniques [6,14,16]. In our previous work, an all-glass fiber inline EFPI pressure sensor was fabricated by a femtosecond laser [6], which was capable of working at high temperatures up to 700°C, with small temperature cross-sensitivity. However, the pressure sensitivity was relatively low because of the dimension of the diaphragm. Therefore, generally, there are trade-offs between high pressure sensitivity, low temperature cross-sensitivity, high temperature operating point and mechanical robustness.
Recently, three-dimensional (3D) printing technology has been demonstrated as a powerful approach for the fabrication of sensors [17–20]. This technique offers great flexibility and simplicity to produce desired 3D structures. Meanwhile, 3D printing process can incorporate with other processes to realize an integrated smart structure. Various 3D printed sensors have been proposed and demonstrated [18,20]. In general, 3D printed structures serve as a sensing part or mechanical supporting platform. However, due to the properties of the printing materials, which are typically polymer or metal materials, 3D printed sensors rarely survive in high temperature environments. Recently, a 3D printed ceramic part with embedded sapphire optical fiber has been reported for high temperature applications [21]. And a fused silica additive manufacturing method [22], proposed by Kotz et al, was successfully applied to create transparent fused silica components. Components created from both printing processes show high thermal resistance. However, 3D printed fused silica/ceramic parts with high temperature sensing capabilities have not been reported yet.
Here we present an all-glass EFPI pressure sensor fabricated by Three-dimensional (3D) printing of fused silica technique. In our previous work, we reported the extrusion-based 3D printing of ceramics [23] and glass [24] technique. And in this paper, the extrusion-based 3D printing of transparent glass assisted with CO2 laser direct melting fabrication process is employed to fabricate sensing structures. The 3D printing of glass technique allows rapid fabrication of a fiber housing and diaphragm integrated part with flexible dimension tuning capability. Optical fiber is brought in close proximity to the diaphragm to form the FPI cavity. And optical fiber is fixed with the help of CO2 laser irradiation. Simulation and pressure test of the sensor are presented. Meanwhile, the temperature dependence of the all-glass sensor is studied.
II. Fabrication and simulation of the all-glass pressure sensor
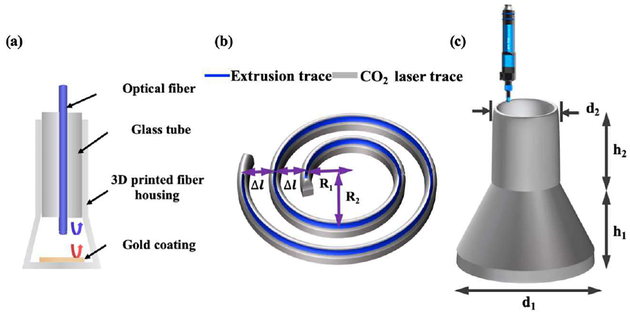
Figure 1(a) schematically illustrates the structure of the proposed sensor. The proposed sensor is composed of a fiber housing structure on top of a diaphragm and a single mode fiber (SMF). To fabricate the sensor, 3D printing of glass process is conducted for a fiber housing structure printing [24]. The fiber housing structure consists of a cone shape and a tube structure on its top. Firstly, a cone structure is printed on a thin fused silica substrate (Corning 7980, with a dimension of 10 × 10 × 0.5 mm), which also serves as the pressure sensing diaphragm. During the printing process, the cone shape structure is printed until the decreasing radius is small enough for a glass tube to be inserted and fixed. Then printing process continues with the fixed radius to form a tube structure. The cone structure enhances the flexibility for diaphragm dimension tuning, to help realize sensors with adjustable pressure measurement sensitivity and range. And the tube structure makes the perpendicular alignment of glass tube to the diaphragm easy. After the printing of fiber housing structure, the inner surface of diaphragm is gold coated with the help of sputter coating machine, for diaphragm’s optical reflection enhancement. Then, glass tube is inserted and the gap between tube and fiber housing structure are filled with fused silica paste, which is melted by CO2 laser processing.
Fig. 1.
(a) Schematic of the pressure sensor. (b) Schematic diagram of the process flow for one single printing layer. Glass paste is extruded following the extrusion trace and then CO2 laser irradiation going through the CO2 laser trace will be conducted for paste melting and fusing. (c) 3D model for the fiber housing structure.
Besides, optical fiber is inserted into the glass tube and brought in proximity to the diaphragm to form the Fabry-Perot cavity. Finally, CO2 laser irradiation is conducted for tube and optical fiber fixing.
During the 3D printing process, for each printing layer, fused silica paste is extruded at controlled flowrate through an extruder (eco-Pen300, Preeflow) with circular nozzle first. And CO2 laser irradiation (with a wavelength of 10.6 μm, ti100W, Synrad) is used to heat the paste with optimized output power, spot size and scanning speed. With the help of laser processing, fused silica paste is quickly melted and fused both in the printing layer and between the adjacent layers. Figure 1(b) shows the extrusion trace and CO2 laser irradiation trace. It is noticed that the extrusion trace is in a spiral shape. Considering the extruded paste width, each adjacent trace of the spiral is separated with the same distance l to avoid paste overlaps or paste gaps. After 40 seconds time delay, CO2 laser irradiation follows the same trace as the extrusion trace. In addition, extra path is designed for the irradiation process, as shown in Figure 1(b). With this optimized laser irradiation trace setting, fused silica pastes at the starting and ending point of the spiral will be under the same heating profile from CO2 laser irradiation as the pastes in middle of the spiral. The next printing layer will be processed 40 seconds after the laser heating process. With this setup for each printing layer, Figure 1(c) shows the printing model of fiber housing structure. l, d1, d2 and h1, h2 represents the separation between two traces, diameters of bottom and top layer, heights of the hollow cone and tube structures, respectively. And the values were optimized and set to be 0.4 mm, 7.3 mm, 4.2 mm, 1.5 mm and 3 mm respectively.
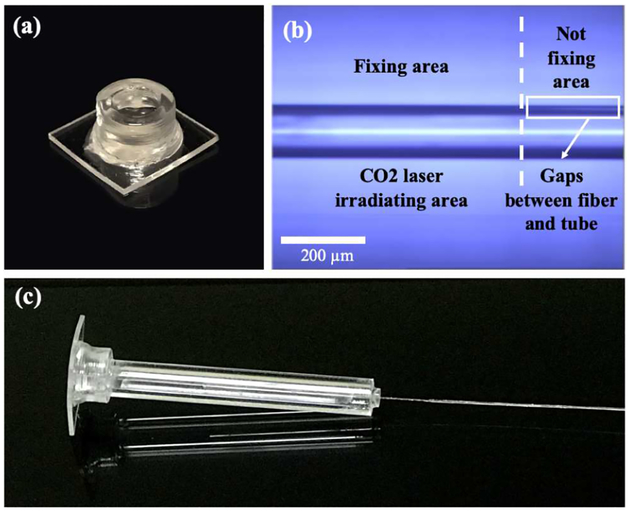
Figure 2(a) shows the printed transparent fused silica fiber housing structure on top of a fused silica substrate. The substrate, which also performed the pressure sensing function, was fused together with the printed glass to form an integrated part, ensuring the good mechanical robustness of the structure.
Fig. 2.
(a) photo of the 3D printed fiber housing structure, (b) microscope image showing that optical fiber is fixed inside the tube with the help of CO2 laser irradiation through cylindrical lens. No gap can be found at the laser irradiation area. (c) Photo of the assembled all-glass pressure sensor.
Besides, gold sputter coating (Desk V, Denton) was deposited onto the inner surface of the diaphragm with the thickness of ~20 nm, to enhance the light reflection as well as the immunity of the sensor to variations in surrounding media. Additionally, a fused silica tube with outer diameter (OD) of 4 mm was inserted into the printed structure and the gap between them was filled with fused silica paste. Laser irradiation was in progress for paste melting and fusing. Finally, a cleaved single mode fiber (SMF) was inserted into the tube and brought into the designated position to form the FPI. During this process, a monitoring system was used to acquire the spectra, which consisted of an optical spectrum analyzer (AQ6370D, Yokogawa), fiber coupler and broadband light source (Agilent 83437A). Then CO2 laser irradiation with ZnSe cylindrical lens was processed to deform the tube and eliminate the gap between tube and optical fiber. The CO2 laser was set to 30 W and scanned one time with a speed of 2mm/s in a direction perpendicular to the fiber placement. As shown in Figure 2(b), no gap existed in the laser irradiation area (left part of Fig. 2(b)). Moreover, gaps between tube and SMF is clearly shown in the unirradiated area (right part of Fig. 2(b)). Figure 2(c) shows the assembled all-glass pressure sensor.
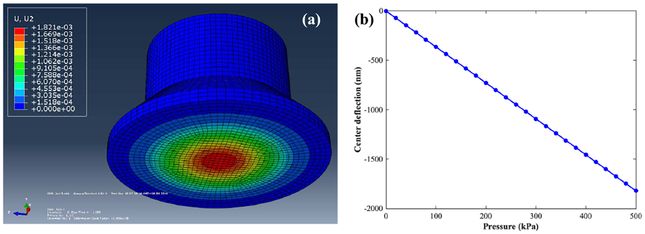
When the sensor is exposed to external pressure, deflection of the fiber housing structure can be modeled and analyzed using a finite element method, with the parameters set the same as the parameters shown in Fig. 1(c). Figure 3(a) shows the deflection distribution of the proposed structure in Abaqus when it is under the external pressure of 0.5 MPa. The majority of the simulated structure is in blue, indicating that no deflection is observed. And the largest deflection (in red) is located at the center of the diaphragm, which is 1.821μm. Figure 3(b) shows the center deflection under pressure change. A linear relationship is observed, and the slope of the fitted line is calculated as the simulated pressure sensitivity, which is estimated as 3.6 nm/kPa.
Fig. 3.
(a) Simulation results from Abaqus showing the deflection distribution of the fiber housing structure under external pressure of 0.5 MPa. (b) Center deflection of the diaphragm in response to external pressure change.
Through the simulation, only diaphragm is sensitive to external pressure change. As such, the pressure sensitivity for a circular diaphragm can be also described as [6]:
| (1) |
where a and h are the radius and thickness (in μm) of the diaphragm. E and μ are the Young’ s modulus and Poisson’ s ratio of the diaphragm. When the diaphragm is exposed to external pressure P, the deflection of the diaphragm is given by:
| (2) |
III. Experimental results of the fabricated pressure sensor
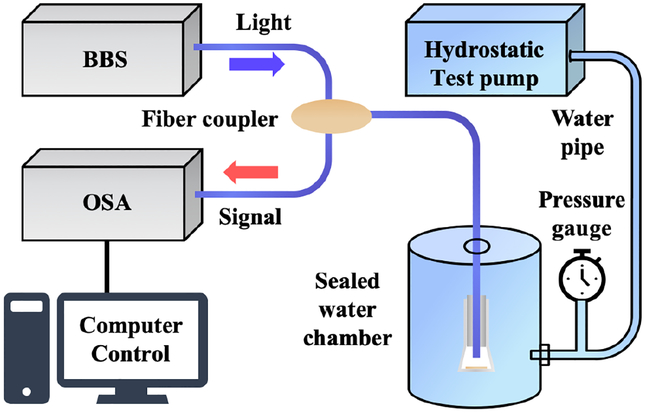
The pressure sensitivity of the fabricated sensor was characterized. As shown in Fig. 4, the sensor was sealed in a sealed water chamber, where the hydrostatic pressure was supplied using a hydrostatic test pump and monitored with a commercial pressure gauge (with 0.5% measurement accuracy). The light from a broadband light source was injected into the sensor through a fiber coupler and reflected interference spectra were detected via the OSA and recorded for every 20 kPa increasement from 0 to 0.5 MPa.
Fig. 4.
Schematic of the experiment setup to test the pressure measurement capability of the all-glass FPI sensor.
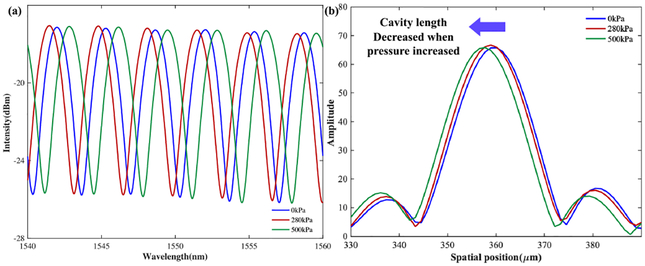
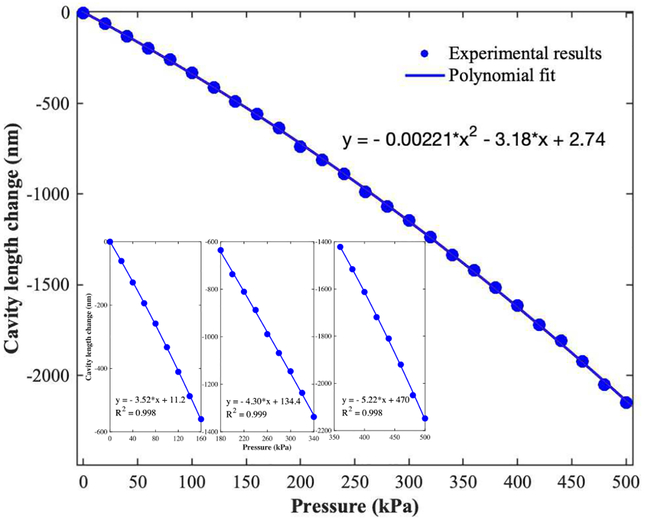
Figure 5(a) shows the spectra of the sensor when exposed to external pressures of 0 kPa, 200 kPa and 500 kPa, respectively. Figure 5(b) plots the FFT of the spectra in Fig. 5(a). Three main frequency components with different spatial position are represented by three peaks in Fig. 5(b). When pressure increased, the peak position shifted left, meaning that the cavity length decreased, which agreed well with the simulation results. And cavity length change of the sensor as a function of the external pressure was plotted in Fig. 6. Under 0.5 MPa pressure change, a cavity length change of 2148.7 nm was observed. The response curve shown in Fig. 6 was nonlinear in the large pressure range. As such, a second order polynomial fit was used to correlate the relation between the cavity length change and applied pressure. It is noticed that the linear term coefficient is much larger than the coefficient of second order term. Therefore, the linear term dominated, and the coefficient of the linear term was calculated as the averaged pressure sensitivity, to be 3.18 nm/kPa. Additionally, considering the changing slope in the large pressure test range, the cavity length change in relation to pressure variation was plotted into three separated small pressure ranges, which were 0 to 160 kPa, 180 to 340 kPa and 360 to 500 kPa, respectively, as shown in the insets of Fig. 6. A linear fit was applied to the three separated regions and sensitivities were calculated to be 3.52 nm/kPa, 4.30 nm/kPa and 5.22 nm/kPa, with the coefficients of determination (or the R-squared values) of the curve fittings being 0.998, 0.999 and 0.998, respectively. The sensitivity shows the trend of improvement when the sensor was exposed to larger external pressures.
Fig. 5.
(a) Spectra shift in response to external pressure changes. (b) FFT results of the sensor spectra. When external pressure increased, the cavity length decreased.
Fig. 6.
Pressure-induced cavity length change of the pressure sensor. Insets: Cavity length change with respect to the pressure change in the range of 0 to 160 kPa, 180–340 kPa and 360 to 500 kPa, respectively.
Besides, the radius of the diaphragm could be calculated from the cavity length change using Eq. (2). The calculated diaphragm radius was 3.80 mm, which was close to the proposed radius of 3.65 mm. The small difference between experimental results and simulation results was related to the sensor fabrication process. As shown in Fig. 1(b), during the 3D printing process, for each printing layer, due to the spiral-shape extrusion process, the area inside the printing trace was not a perfect circle. While in equation calculation and model simulation, the radius applied was the value of R1 in Fig. 1(b). But the size of the printed diaphragm should be in the range of a circle with radius between R1 and R2, which was 3.65 mm and 3.85 mm. As such, the printed structure matched the designed model in dimensions, showing the small shrinkage of the all-glass part fabricated by this 3D printing of glass based on direct laser melting method.
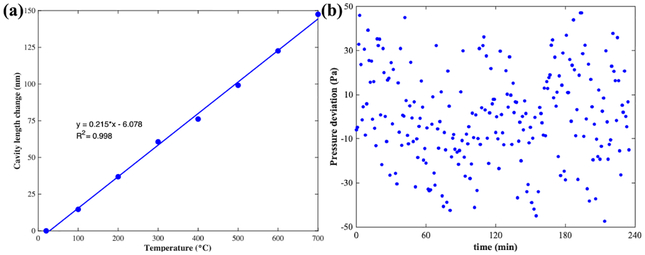
To demonstrate the feasibility as a high temperature pressure sensor and study its temperature dependence, the pressure sensor was measured in an electrical tubular furnace and the interference spectra were monitored as the temperature varied programmatically from room temperature 20°C to 700°C. As the temperature increased, the cavity length increased, as shown in Fig. 7(a). Linear regression was applied to fit the response curve and the slope was calculated as the temperature sensitivity, which was estimated to be 0.215 nm/°C. And the cavity length change was mainly induced by the thermal expansion of the cavity. Taken the sensor’s cavity length of 359386.0 nm into consideration, the thermal expansion ratio of the cavity was calculated to be 5.9824×10⁻⁷/°C, which was close to the thermal expansion coefficient (CTE) of fused silica glass of 5.5×10⁻⁷/°C. The difference between the two values could be related to the sealed air cavity expansion under higher temperature environments, and slightly porous glass structure during 3D printing process. Nevertheless, the sensor showed the low temperature dependence and its capability of working in high temperature environments. Based on the measurement results, the temperature-pressure cross-sensitivity is found to be 67.6 Pa/°C.
Fig. 7.
(a) Cavity length change with respect to temperature change. (b) Measured pressure deviation in a period of 240 mins.
The stability of the pressure sensor was measured by continuously recording the sensor’ s cavity length for a period of 4 hours. To eliminate the influence of environmental changes, the sensor head was put in the sealed water chamber at room temperature, as shown in Fig. 4. The results are plotted in Figure 7(b). The standard deviation of the data within this period was found to be σ = 22.17 Pa. The resolution of the sensor was estimated to be 2σ = 44.34 Pa, which is equivalent to 95% confidence.
IV. Conclusion
In summary, an all-glass fiber-optic pressure sensor was fabricated by the three-dimensional printing based on direct laser melting method. The pressure sensor was made of fused silica material, and its fiber housing structure was fabricated by direct three-dimensional (3D) printing of glass on top of a fused silica substrate, which also served as the pressure sensing diaphragm. A cleaved single-mode fiber (SMF) fixed inside a glass tube was inserted into the fiber housing structure and brought in proximity to the diaphragm, to form the FPI. CO2 laser irradiation was applied in optical fiber fixing process. Test results showed that the pressure sensitivity and resolution were 3.18 nm/kPa and 44.34 Pa, respectively, which agreed well with the simulated results, showing that the printed sensor matched the 3D model, small shrinkage was observed, and the accuracy and precision of this 3D printing of glass method were high. Moreover, temperature dependence of the sensor has been tested up to 700 °C with low temperature sensitivity of 0.215 nm/°C, corresponding to the temperature-pressure cross-sensitivity of 67.6 Pa/°C. Based on this 3D printing of glass method, the diaphragm thickness and diameter can be designed to adjust the sensitivity and measurement range. Besides, the sensor can work in high temperature environments. It is believed that this all-glass fiber-optic pressure sensor is potentially useful for pressure measurement in high temperature harsh environments.
Acknowledgments
This research work was supported by National Institutes of Health under the contract NIH-P20-GM121342.
Biography
Qi Zhang received the B.S. degree in Electrical Engineering from University of Electronic Science and Technology of China, Chengdu, China, in 2014. He is currently pursuing the Ph.D. degree with the Department of Electrical and Computer Engineering, Clemson University. His research interests mainly focus on photonic and microwave sensors and instrumentation for applications in intelligent infrastructure and biomedical sensing.
Jincheng Lei is currently a Ph.D. candidate in electrical engineering from Clemson University, Clemson, South Carolina. He got his bachelor’s degree in materials science and engineering from South China University of Technology, Guangzhou, China, in 2013. His research mainly focuses on laser 3D microfabrication of ceramic and glass materials for application in photonic sensors and devices.
Yizheng Chen received the B.S. and master’s degree in civil engineering from Tongji University, Shanghai, China, in 2009 and 2011, respectively, and the Ph.D. degree in civil engineering from the Missouri University of Science and Technology, Missouri, USA, in 2017. His research interest is focused on optical fiber corrosion sensors.
Yongji Wu received the Bachelor of engineering degree in Electrical Engineering and Automation and master’ s degree in Control engineering from Harbin University of Technology, Harbin, China, in 2008 and 2015, respectively. His research interest is focused on optical fiber sensors.
Chuan Chen is an engineer of the Global Energy Interconnection Research Institute in Beijing, China.
Hai Xiao received the Ph.D. degree in Electrical Engineering from Virginia Tech, Blacksburg, VA, in 2000. From 2006 to 2013, he was an Associate Professor and then a Professor with the Department of Electrical and Computer Engineering, Missouri University of Science and Technology. His research interests mainly focus on photonic and microwave sensors and instrumentation for applications in energy, intelligent infrastructure, clean-environment, biomedical sensing /imaging, and national security.
Contributor Information
Qi Zhang, Holcombe Department of Electrical and Computer Engineering, Center for Optical Materials Science and Engineering Technologies, Clemson University, Clemson, SC 29634 USA..
Jincheng Lei, Holcombe Department of Electrical and Computer Engineering, Center for Optical Materials Science and Engineering Technologies, Clemson University, Clemson, SC 29634 USA..
Yizheng Chen, Holcombe Department of Electrical and Computer Engineering, Center for Optical Materials Science and Engineering Technologies, Clemson University, Clemson, SC 29634 USA..
Yongji Wu, Holcombe Department of Electrical and Computer Engineering, Center for Optical Materials Science and Engineering Technologies, Clemson University, Clemson, SC 29634 USA..
Chuan Chen, Global Energy Interconnection Research Institute, Beijing 102211, China..
Hai Xiao, Holcombe Department of Electrical and Computer Engineering, Center for Optical Materials Science and Engineering Technologies, Clemson University, Clemson, SC 29634 USA..
References
- [1].García I, Zubia J, Durana G, Aldabaldetreku G, Illarramendi MA, and Villatoro J, “Optical fiber sensors for aircraft structural health monitoring,” Sensors, vol. 15, no. 7, pp. 15494–15519, 2015. [DOI] [PMC free article] [PubMed] [Google Scholar]
- [2].Di Sante R, “Fiber optic sensors for structural health monitoring of aircraft composite structures: Recent advances and applications,” Sensors, vol. 15, no. 8, pp. 18666–18713, 2015. [DOI] [PMC free article] [PubMed] [Google Scholar]
- [3].Huang J, Zhou Z, Zhang D, and Wei Q, “A fiber bragg grating pressure sensor and its application to pipeline leakage detection,” Adv. Mech. Eng, vol. 2013, 2013. [Google Scholar]
- [4].Pulliam WJ, Russler PM, and Fielder RS, “High-temperature high-bandwidth fiber optic MEMS pressure-sensor technology for turbine-engine component testing,” Proc. SPIE, Fiber Opt. Sens. Technol. Appl. 2001, vol. 4578, no. May, pp. 229–238, 2002. [Google Scholar]
- [5].Fu HY et al. , “High pressure sensor based on photonic crystal fiber for downhole application,” Appl. Opt, vol. 49, no. 14, p. 2639, 2010. [Google Scholar]
- [6].Zhang Y, Yuan L, Lan X, Kaur A, Huang J, and Xiao H, “High-temperature fiber-optic Fabry–Perot interferometric pressure sensor fabricated by femtosecond laser,” Opt. Lett, vol. 39, no. 1, p. 17, 2013. [DOI] [PubMed] [Google Scholar]
- [7].Zhang Y, Huang J, Lan X, Yuan L, and Xiao H, “Simultaneous measurement of temperature and pressure with cascaded extrinsic Fabry–Perot interferometer and intrinsic Fabry–Perot interferometer sensors,” Opt. Eng, vol. 53, no. 6, p. 067101, 2014. [Google Scholar]
- [8].Zhu C, Chen Y, Zhuang Y, Fang G, Liu X, and Huang J, “Optical Interferometric Pressure Sensor Based on a Buckled Beam with Low-Temperature Cross-Sensitivity,” IEEE Trans. Instrum. Meas, vol. 67, no. 4, pp. 950–955, 2018. [Google Scholar]
- [9].Leal-Junior A, Frizera A, Díaz C, Marques C, Ribeiro M, and Pontes MJ, “Material features based compensation technique for the temperature effects in a polymer diaphragm-based FBG pressure sensor,” Opt. Express, vol. 26, no. 16, p. 20590, 2018. [DOI] [PubMed] [Google Scholar]
- [10].Zhang Q, Liu N, Fink T, Li H, Peng W, and Han M, “Fiber-optic pressure sensor based on π-phase-shifted fiber Bragg grating on side-hole fiber,” IEEE Photonics Technol. Lett, vol. 24, no. 17, pp. 1519–1522, 2012. [Google Scholar]
- [11].Holmes C, Carpenter LG, Gates JC, and Smith PGR, “Miniaturization of Bragg-multiplexed membrane transducers,” J. Micromechanics Microengineering, vol. 22, no. 2, 2012. [Google Scholar]
- [12].Yang Y, Saurabh S, Ward JM, and Nic Chormaic S, “High-Q, ultrathin-walled microbubble resonator for aerostatic pressure sensing,” Opt. Express, vol. 24, no. 1, p. 294, 2016. [DOI] [PubMed] [Google Scholar]
- [13].Berthold J, “Historical review of microbend fiber-optic sensors,” J. Light. Technol, vol. 13, no. 7, 1995. [Google Scholar]
- [14].Zhang Y, Huang J, Lan X, Yuan L, and Xiao H, “Simultaneous measurement of temperature and pressure with cascaded extrinsic Fabry–Perot interferometer and intrinsic Fabry–Perot interferometer sensors,” Opt. Eng, vol. 53, no. 6, p. 67101, 2014. [Google Scholar]
- [15].Wang X, Xu J, Zhu Y, Cooper KL, and Wang A, “All-fused-silica miniature optical fiber tip pressure sensor.,” Opt. Lett, vol. 31, no. 7, pp. 885–7, 2006. [DOI] [PubMed] [Google Scholar]
- [16].Liu J et al. , “Micro-cantilever-based fiber optic hydrophone fabricated by a femtosecond laser,” Opt. Lett, vol. 42, no. 13, p. 2459, 2017. [DOI] [PubMed] [Google Scholar]
- [17].Xu Y et al. , The Boom in 3D-Printed Sensor Technology, vol. 17, no.5 2017. [DOI] [PMC free article] [PubMed] [Google Scholar]
- [18].Guo SZ, Qiu K, Meng F, Park SH, and McAlpine MC, “3D Printed Stretchable Tactile Sensors,” Adv. Mater, vol. 29, no. 27, pp. 1–8, 2017. [DOI] [PMC free article] [PubMed] [Google Scholar]
- [19].Bhattacharjee N, Urrios A, Kang S, and Folch A, “The upcoming 3D-printing revolution in microfluidics,” Lab Chip, vol. 16, no. 10, pp. 1720–1742, 2016. [DOI] [PMC free article] [PubMed] [Google Scholar]
- [20].Manzanares Palenzuela CL and Pumera M, “(Bio)Analytical chemistry enabled by 3D printing: Sensors and biosensors,” Trends Anal. Chem, vol. 103, pp. 110–118, 2018. [Google Scholar]
- [21].Ghazanfari A, Li W, Leu MC, Zhuang Y, and Huang J, “Advanced ceramic components with embedded sapphire optical fiber sensors for high temperature applications,” Mater. Des, vol. 112, pp. 197–206, 2016. [Google Scholar]
- [22].Kotz F et al. , “Three-dimensional printing of transparent fused silica glass,” Nature, vol. 544, no. 7650, pp. 337–339, 2017. [DOI] [PubMed] [Google Scholar]
- [23].Hong Y et al. , “Fabricating ceramics with embedded microchannels using an integrated additive manufacturing and laser machining method,”J. Am. Ceram. Soc, vol. 102, no. 3, pp. 1071–1082, 2019. [Google Scholar]
- [24].Lei J, Hong Y, Zhang Q, Peng F, and Xiao H, “Additive Manufacturing of Fused Silica Glass Using Direct Laser Melting,” CLEO Appl. Technol, no. AW31–4, pp. 4–5, 2019. [Google Scholar]


