

Abstract
In 2010, Arizona experienced an unusually early and severe outbreak of West Nile virus centered in the southeast section of Maricopa County. Entomological data was collected before and during the outbreak, from May 25 through July 31, using the CO2-baited light trap monitoring system maintained by the Maricopa County Vector Control. In the outbreak area the most abundant species in the Town of Gilbert and in the area covered by the Roosevelt Water Conservation District (RWCD) was Cx. quinquefasciatus which was 75.1% and 71.8% of the total number of mosquitoes collected respectively. Vector Index (VI) profiles showed that the abundance of infected Cx. quinquefasciatus peaked prior to human cases, suggesting that this species was involved in the initiation of the outbreak. In contrast the VI profiles for Cx. tarsalis were consistently low suggesting limited involvement in initiating and sustaining transmission. Taken together, the higher abundance and the VI profiles strongly suggest that Cx. quinquefasciatus was the primary vector for this outbreak. The VI profiles consistently showed that the abundance of infected mosquitoes peaked one to two weeks before the peaks of human cases suggesting that VI could have successfully been utilized to predict the WNV outbreak in Maricopa County, AZ, 2010.
Keywords: West Nile virus (WNV), Phoenix, Arizona, Vector Index, IR, Mosquito Density
Introduction
West Nile Virus (WNV), a mosquito-borne virus in the family Flaviviridae, is maintained in an enzootic transmission cycle involving primarily Culex mosquitoes and birds (Hayes 1989, Turell et al. 2005). Humans and other mammals are dead-end hosts, though infected humans can develop a febrile illness that may result in encephalitis, meningitis, and infrequently, death (Hayes et al. 2005). WNV was introduced into the USA in 1999 (Nash et al. 2001, Novello 2000), and within 6 years rapidly spread throughout the USA (Dauphin et al. 2004, Kramer et al. 2008). After 2005, the ecology of WNV changed from widespread, high levels of transmission to one characterized by focal and sporadic epidemics of disease (Lindsey et al. 2010). In Arizona, WNV was first detected in a pool of mosquitoes collected in Cochise County early August, 2003, with a total of 13 human cases reported in the state (MCDPH 2007). The biggest WNV outbreak in Arizona was in 2004 when 391 human cases were reported to the Centers for Disease Control and Prevention (CDC) (CDC 2012). From 2003 to 2010, a total of 1,039 human cases were reported in Arizona, with more than 100 cases recorded each year during 2004, 2005, 2006, 2008, and 2010 (CDC 2012). One area with recurring WNV disease outbreaks since 2005 is Maricopa County (Lindsey et al. 2010). WNV transmission in Maricopa County is characterized by focal, seasonal outbreaks of human disease in areas of high risk; the majority of cases occur in late summer in the southeast section of Maricopa County, including the cities of Chandler, Tempe, Mesa, and the Town of Gilbert (Lindsey et al. 2010). In 2010, this area experienced an unusually early and severe outbreak of human WNV disease focused around the Town of Gilbert: by early July, case counts had exceeded the total for all of 2009 (Gibney et al. 2012). Routine entomological surveillance by Maricopa County Environmental Services Vector Control Division collected data allowing quantification of mosquito abundance and WNV infection rate in mosquitoes before, during and after the outbreak. We performed a retrospective analysis of this surveillance data to attempt to understand the entomological parameters associated with this outbreak. Furthermore, because previous attempts at predicting human WNV disease outbreaks have been limited with respect to spatial scale-either by lacking resolution or the ability to cross multiple scales (Sugumaran et al. 2009; Vazquez-Prokopec et al. 2010; Winters et al. 2010), we quantified the ability of entomologic data to predict the outbreak at multiple spatial scales.
Methods
Study area
The study area was Maricopa County, an area of approximately 23,890 km2 (9,224 mi2) in south-central Arizona. It encompasses over 14 cities, 11 towns and 18 communities such as Glendale, Phoenix, Scottsdale, Peoria, Chandler, Mesa, and Tempe. The study area consisted of the outbreak area and a control area. The outbreak area was the south east section of Maricopa County, an area of approximately 2,654 km2 (1,220 mi2) that includes the cities of Chandler, Mesa, Queen Creek and Tempe, and the Town of Gilbert. Particular attention was given to the Roosevelt Water Conservation District (RWCD), a narrow area (162 km2) in the middle of the outbreak area because of the widespread use of flood irrigation in residential areas. The control area consisted of the remaining area lying within Maricopa County but outside the outbreak area (Figs. 1a and b).
Fig. 1.
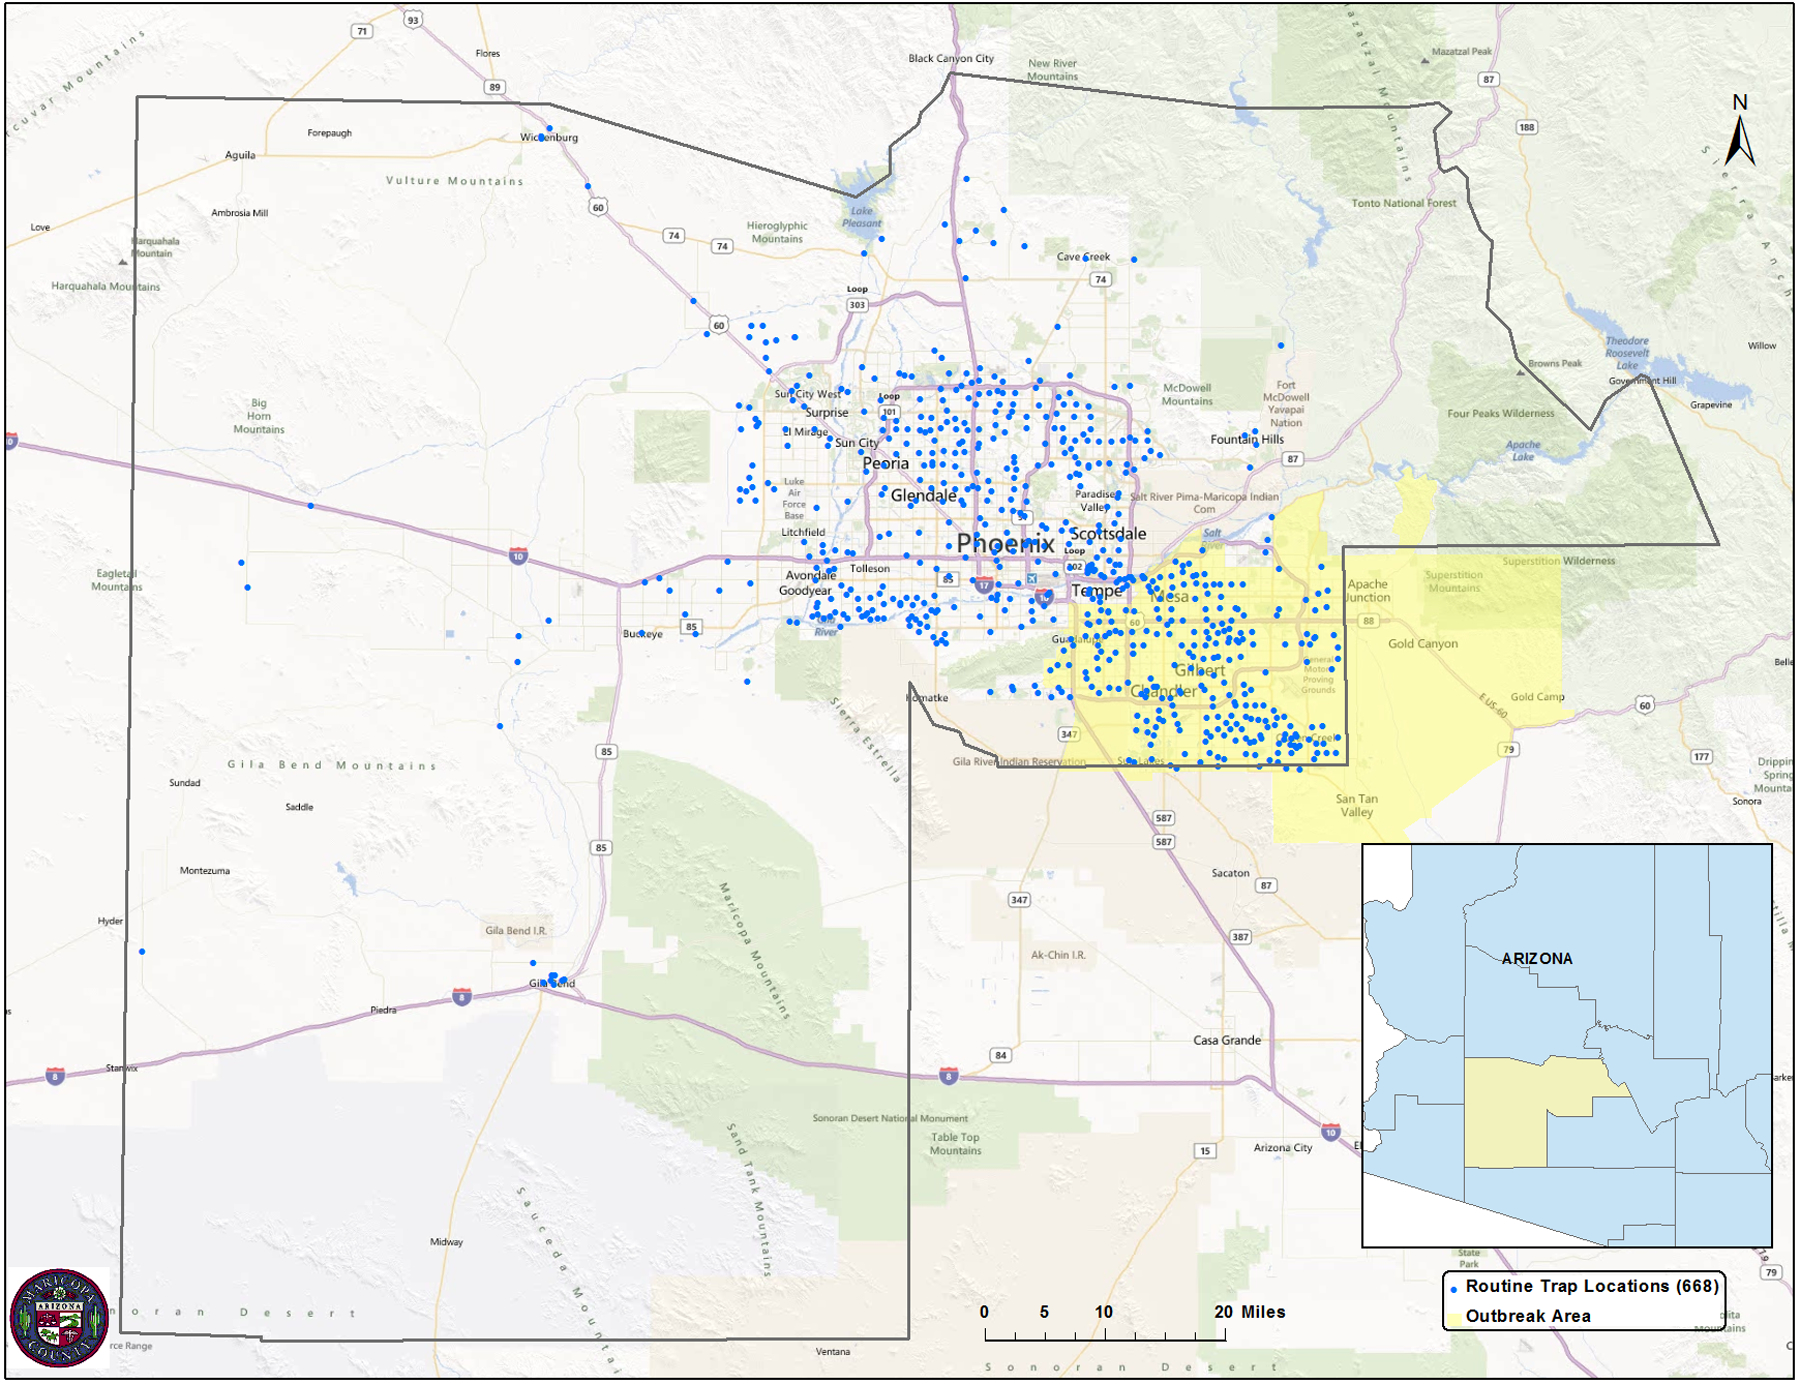
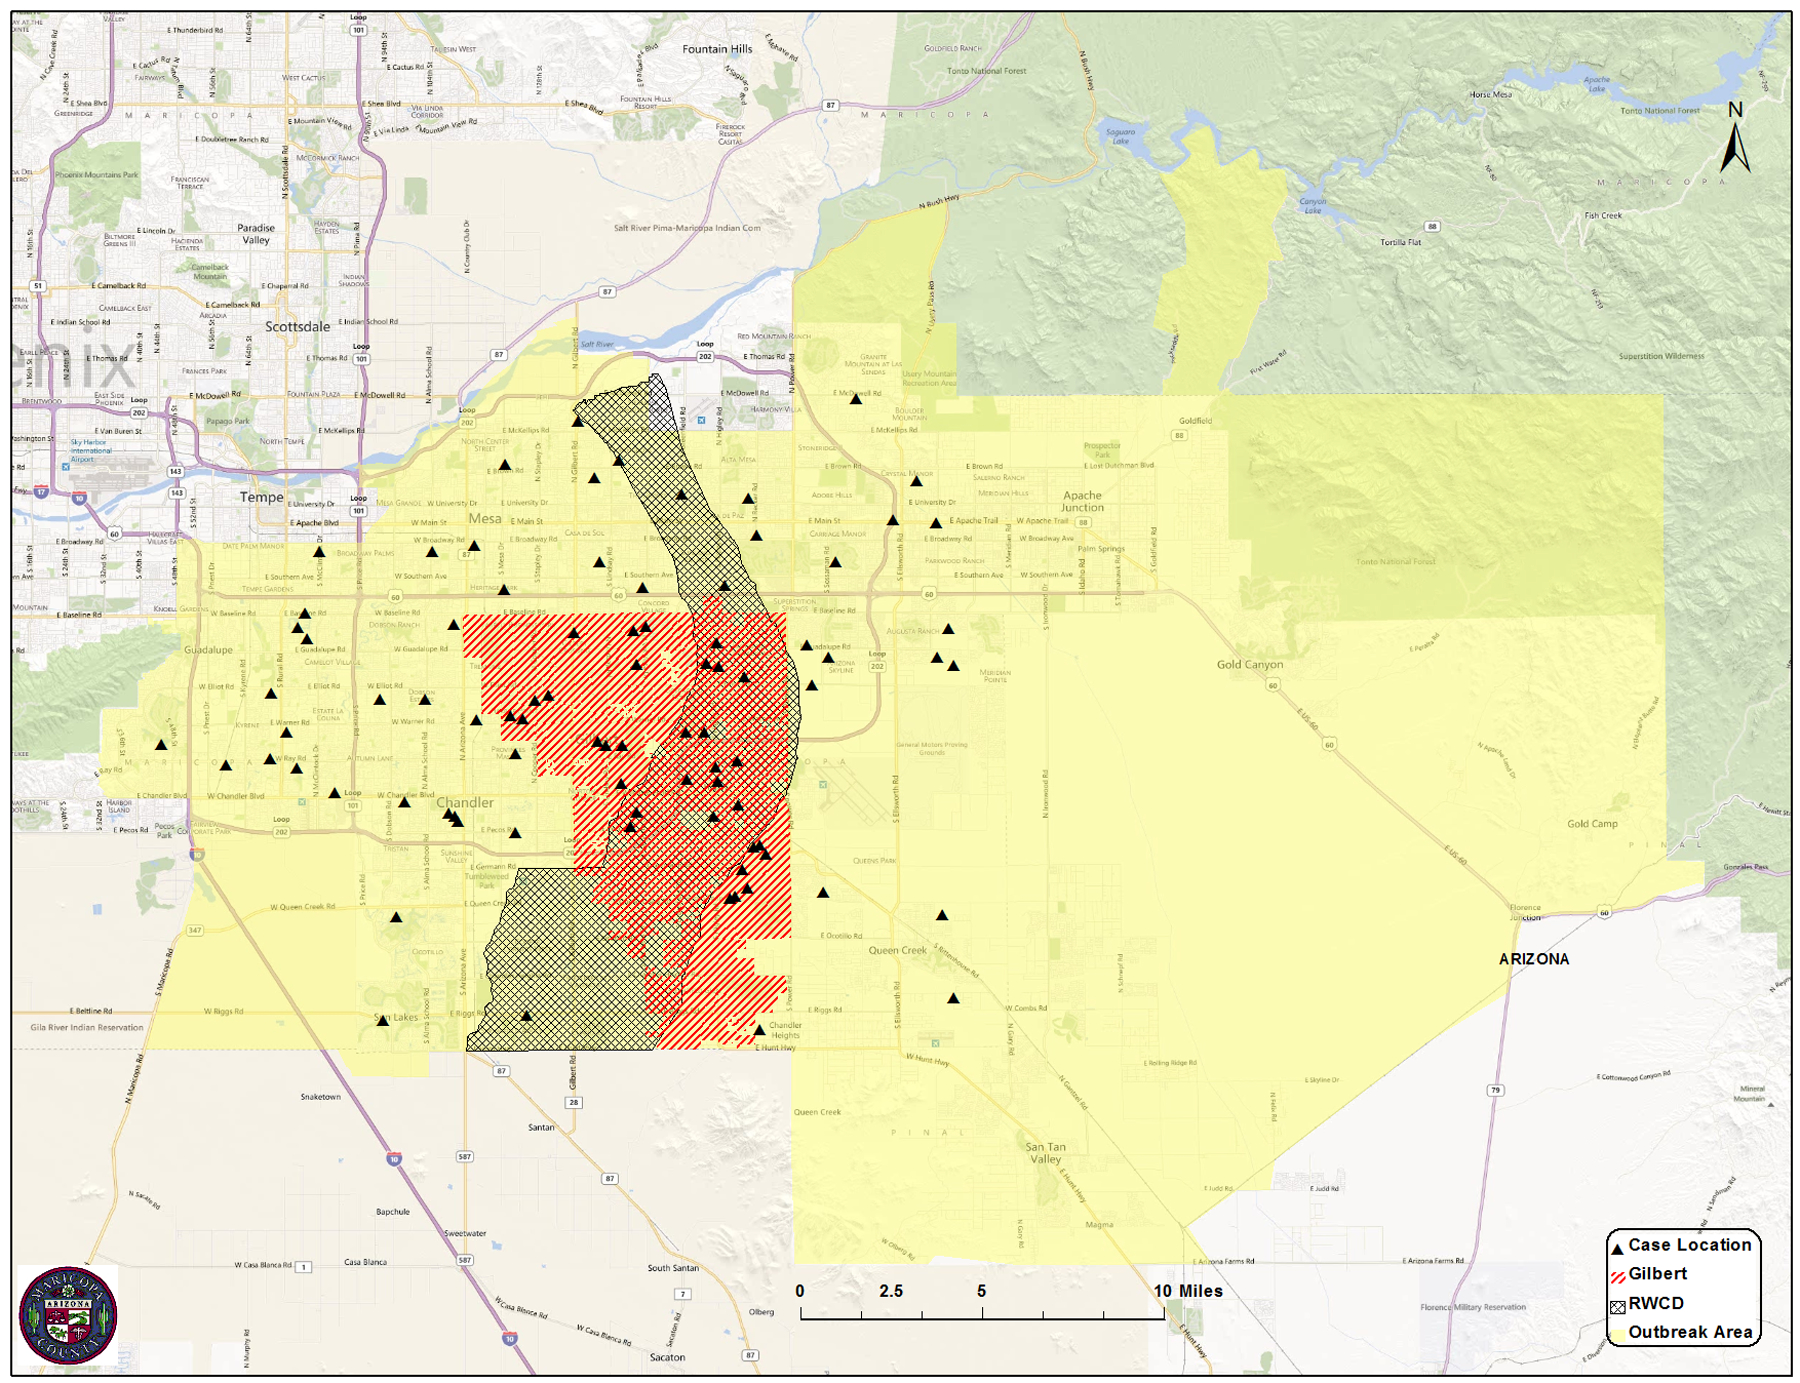
Map of Maricopa County, AZ, showing the location of the outbreak area and routine mosquito traps for Maricopa County Vector Control (Fig. 1a), as well as the Town of Gilbert, RWCD, and location of the human cases within the outbreak Area (Fig. 1b).
Mosquito collections
Mosquitoes were collected using CO2-baited CDC light traps (BioQuip, Rancho Dominquez, CA) at 303 collecting sites routinely maintained by Maricopa County Environmental Department Vector Control Division. The trap sites were distributed throughout Maricopa County and included 131 sites in the outbreak area, 22 in the Town of Gilbert and 23 in RWCD (Fig. 1a, Table 2). To minimize capture of non-target nocturnal arthropods, light bulbs were removed from the traps and only CO2 was used as an attractant. Mosquitoes were collected from each trap once each week, one trap night a week, from May 25 through July 30, 2010 (referred to hereafter as the study period). Trapping was conducted on 37 nights during the period, resulting in a total of 11,211 trap nights. All mosquitoes were identified to species using the keys of Darsie and Ward (2005) and separated by species, sex, collection date and location prior to screening for WNV. Culex quinquefasciatus and Cx. tarsalis females were placed into pools of up to 50 individuals each, by species date and location. All pools were tested for WNV antigen using the RAMP® WNV Test (Response Biomedical, Vancouver, BC) (Burkhalter et al. 2006); RAMP values ≥300 were considered positive for WNV, following the protocol used by Maricopa County. The geographic location of each trap was provided by Maricopa County, and ArcGIS 10.0 (ESRI, Redlands, CA) was used to assign each trap to the appropriate area for subsequent analysis
Table 2.
Culex mosquito density, infection rates and vector indices in Maricopa County, AZ, May 23–July 31.
| Number of Mosquito collecting sites | Human disease incidence, per 100,000 Population | Density1 | Infection Rate (95% CI)2 | Vector Index3 | |
|---|---|---|---|---|---|
| Control Area | 172 | 0 | |||
| Cx. quinquefascaitus | 0.8 | 5.2 (2.3 – 10.2) | 0.004 | ||
| Cx. tarsalis | 0.7 | 5.4 (2.7 – 9.8) | 0.006 | ||
| Combined | 1.5 | 5.3 (3.2 – 8.4) | 0.010 | ||
| Outbreak Area | 131 | 4.5 | |||
| Cx. quinquefascaitus | 27 | 16.3 (12.7 – 20.6) | 0.052 | ||
| Cx. tarsalis | 16 | 14.5 (10.5 – 19.6) | 0.037 | ||
| Combined | 43 | 24.7 (19.9 – 30.4) | 0.087 | ||
| Gilbert | 22 | 12.9 | |||
| Cx. quinquefascaitus | 92 | 24.0 (17.4 – 32.7) | 0.211 | ||
| Cx. tarsalis | 50 | 30.0 (19.2 – 49.0) | 0.156 | ||
| Combined | 142 | 25.8 (19.7 – 33.5) | 0.361 | ||
| RWCD | 23 | N/A | |||
| Cx. quinquefascaitus | 23 | 28.5 (19.0 – 42.4) | 0.151 | ||
| Cx. tarsalis | 13 | 27.6 (14.8 – 51.9) | 0.120 | ||
| Combined | 36 | 28.7 (20.7 – 40.2) | 0.277 | ||
Number of mosquitoes collected per trap per night
In number of mosquitoes positive for WNV, per 1000 tested
In number of mosquitoes positive for WNV, per trap night
Entomological indices and calculations
Three entomological indices were derived and evaluated for their value in predicting WNV cases. Culex tarsalis and Cx. quinquefasciatus density is expressed as the number of females collected per trap night and was determined by dividing the total number of females of the species collected within a geographic area by the number of trap nights conducted during the study period. The infection rate (IR) of WNV in the mosquito populations was computed as the Maximum Likelihood Estimate of the proportion of WNV-infected mosquitoes in pooled samples (Chiang and Reeves 1962, CDC 2011); it is expressed as the number of mosquitoes positive for WNV per thousand tested. The Vector Index (VI) is an estimate of the density of WNV-infected mosquitoes collected per trap night, and is the product of the vector density (number collected per trap night) and the infection rate (expressed as a proportion) for a given species (Nasci et al. 2005, Jones et al, 2011). Vector Indices expressing the average number of infected mosquitoes collected per trap night, per week were calculated by week for each species and a combined VI was calculated by summing the species VIs for each week as an index of the total number of infected Culex mosquitoes collected per trap night per week.
Data Comparisons and Analysis
To examine geographic differences in WNV dynamics during the study period, Cx. quinquefasciatus and Cx. tarsalis densities, IR and VI were calculated in the outbreak area and compared with those outside the outbreak area. In addition comparisons were made between the entire outbreak area, Town of Gilbert and RWCD. To determine the temporal association between WNV infection rates in mosquitoes and disease onset in humans, species-specific and combined weekly IR and VI were calculated for the outbreak area, the Town of Gilbert and RWCD and plotted against the onset week of human cases in each area. To determine if increases in human WNV infections were preceded by a rise in IR or VI, Spearman’s correlation coefficients were calculated using the weekly number of human cases and the WNV infection indices 1 week, 2 weeks, and 3 weeks prior to the week of symptom onset for human case. Spearman rank correlation P values were calculated using SAS 9.2 (Cary, NC); the correlation matrix of the Spearman’s correlation coefficients was executed using R.
Results
Mosquito collections
A total of 81,931 mosquitoes representing at least 5 species were collected in the study area from 5/25/10 to 7/29/10 (Table 1). The most abundant species was Psorophora (Grabhamia) columbiae (Dyar & Knab) comprising 74.3% of the total collections in the study area. The second was Culex (Culex) quinquefasciatus (Say) (20%), the third Aedes (Aedimorphus) vexans (Meigen) (2.9%) and the fourth Culex (Culex) tarsalis (Coquillett) (2.8%). During the same period 19,449 mosquitoes were collected in the Town of Gilbert. The most abundant species was Cx. quinquefasciatus (75.1%) followed by Ps. columbiae (17.9%), Cx. tarsalis (5.6%) and Ae. vexans (1.4%). A total of 17,679 mosquitoes were collected in RWCD and the most abundant species was Cx. quinquefasciatus (71.8%) followed by Ps. columbiae (18.2%), Cx. tarsalis (5.6%) and Ae. vexans (4.4%). Of the two common WNV vectors, Cx. quinquefasciatus was the most abundant collected in the CO2-baited traps; in the Town of Gilbert Cx. quinquefasciatus was 13.3 times higher than Cx. tarsalis, and 12.9 times higher in RWCD.
Table 1.
Number and percentages of mosquitoes collected in East Valley, Maricopa County, Arizona, from 5/25/10 to 7/29/10.
| Species | Study Area | Gilbert | Water District X |
|---|---|---|---|
| Ps. columbiae | 60,856 (74.3%) | 3,481 (17.9%) | 3,218 (18.2%) |
| Cx. quinquefasciatus | 16,398 (20%) | 14,605 (75.1%) | 12,689 (71.8%) |
| Ae. vexans | 2,399 (2.9%) | 267 (1.4%) | 787 (4.4%) |
| Cx. tarsalis | 2,270 (2.8%) | 1,096 (5.6%) | 985 (5.6%) |
| Ae. aegypti | 7 (0.01%) | 0 (0%) | 0 (0%) |
| An. spps | 0 (0%) | 0 (0%) | 0 (0%) |
| Cx. spps | 1 (0.001%) | 0 (0%) | 0 (0%) |
| Totals | 81,931 | 19,449 | 17,679 |
Vector density
From May 23 through July 31, 2010 a total of 4,640 female Culex mosquitoes was collected from 6,364 trap nights conducted at 172 locations in the control area, and 3,157 female Culex mosquitoes were collected from 4,847 trap nights conducted at 131 trap locations within the outbreak area. Culex quinquefasciatus and Cx. tarsalis densities, as well as the combined Culex densities for the geographic areas within Maricopa County, are listed in Table 2. All density measurements for Culex mosquitoes (Cx. quinquefasciatus, Cx. tarsalis, and combined Culex densities) within the outbreak area were at least 23 times higher than in the control area. Of note, the highest density recorded was the combined Culex density in the Town of Gilbert, at 142 mosquitoes per trap per night; this was 95 times higher than the combined Culex density in the control area. Similarly, both the Cx. quinquefasciatus and Cx. tarsalis densities were highest within the Town of Gilbert (92 and 50 mosquitoes per trap per night, respectively), though the Cx. quinquefasciatus densities were approximately twice that of Cx. tarsalis throughout the study area.
Infection rate
The Cx. quinquefasciatus, Cx. tarsalis, and combined Culex IRs for the geographic areas within Maricopa County over the entire study period are listed in Table 2. All measures of Culex IRs were at least 3 times higher within the outbreak area, the Town of Gilbert, and RWCD, than they were outside the outbreak area. The highest IR measured was 30.0 positive Cx. tarsalis per 1000 tested (3% of the population), in the Town of Gilbert, and was 6 times higher than the season total Cx. tarsalis IR outside the outbreak area. The Cx. quinquefasciatus IR was higher in the outbreak area and RWCD than the Cx. tarsalis IR, though the differences between the two species were small.
Vector Index
The season total VIs for the different geographic areas within the study area (Maricopa County) are listed in Table 2. The Cx. quinquefasciatus, Cx. tarsalis, and combined Culex VIs for the outbreak area, the Town of Gilbert, and RWCD ranged from 6 to 53 times higher than those in the control area. The highest VI recorded was the combined Culex VI in the Town of Gilbert, at 0.361 WNV-positive mosquitoes per trap night. Of note, the Cx. quinquefasciatus and Cx. tarsalis VIs were highest in the Town of Gilbert. The Cx. quinquefasciatus VI was higher than that of Cx. tarsalis in both the Town of Gilbert and RWCD.
Correlation of WNV infection indices with human case onset dates
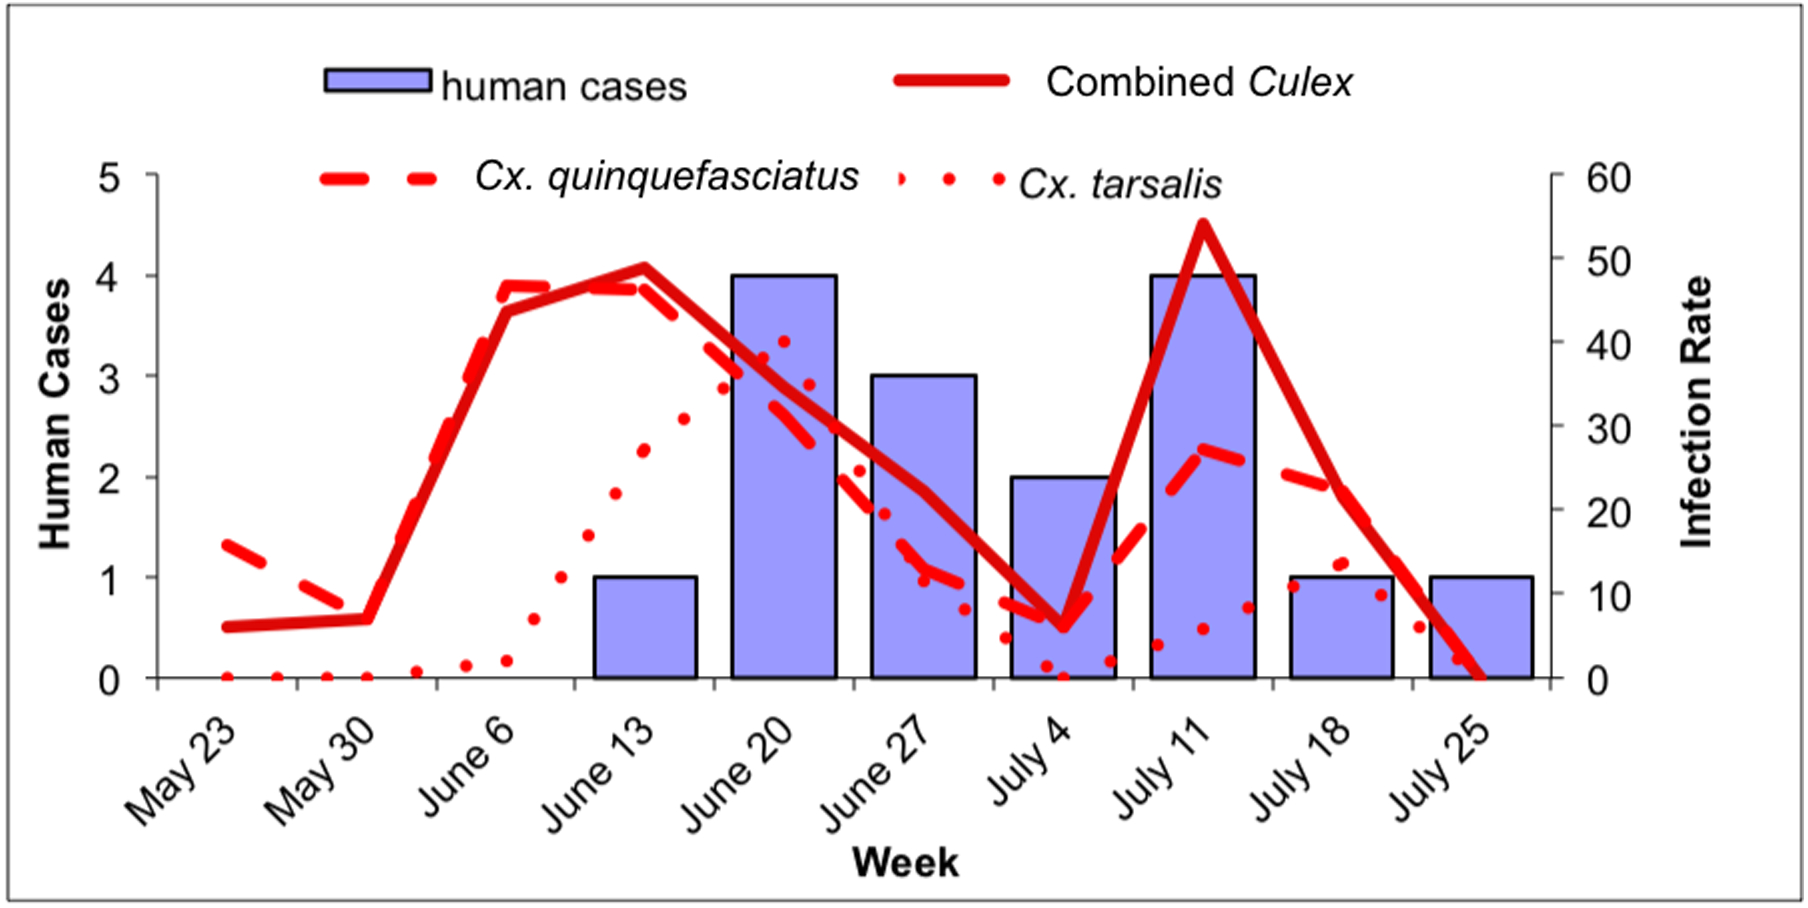
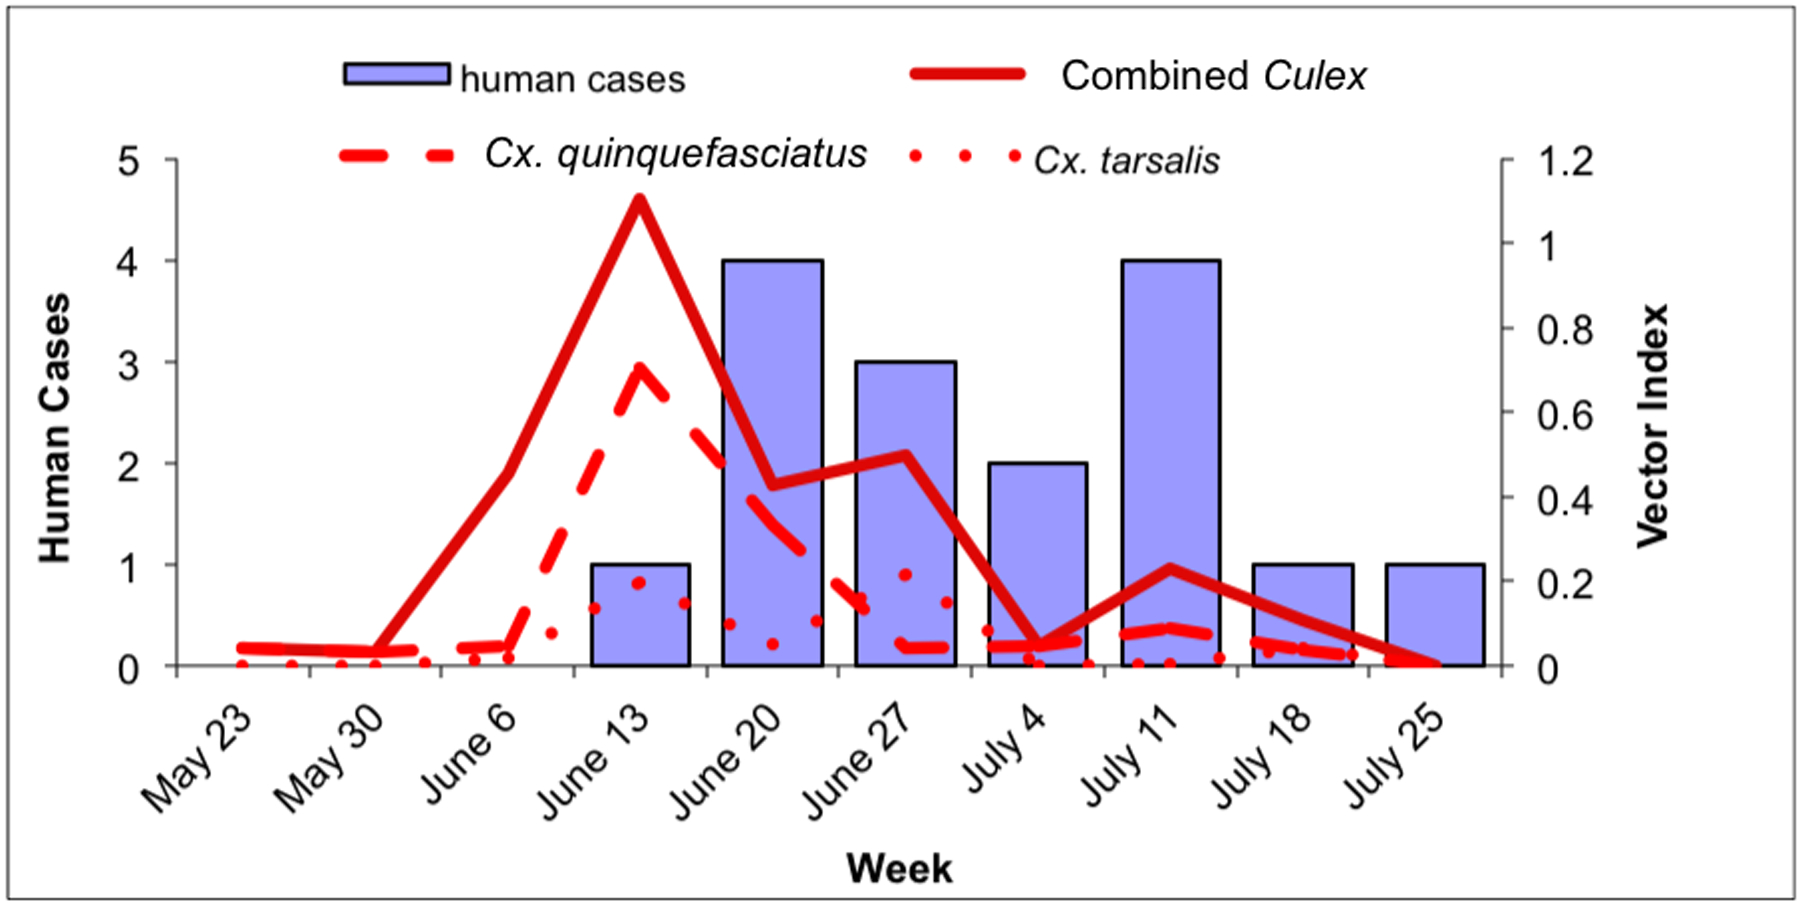
The temporal associations of the Cx. quinquefasciatus, Cx. tarsalis, and combined Culex IRs and VIs with human case onset are shown in Figs. 2–4. Data for each index (IR, VI) are shown separately for the Town of Gilbert and RWCD within outbreak area (Fig. 2), Town of Gilbert (Fig. 3), and RWCD (Fig. 4).
Fig. 2.
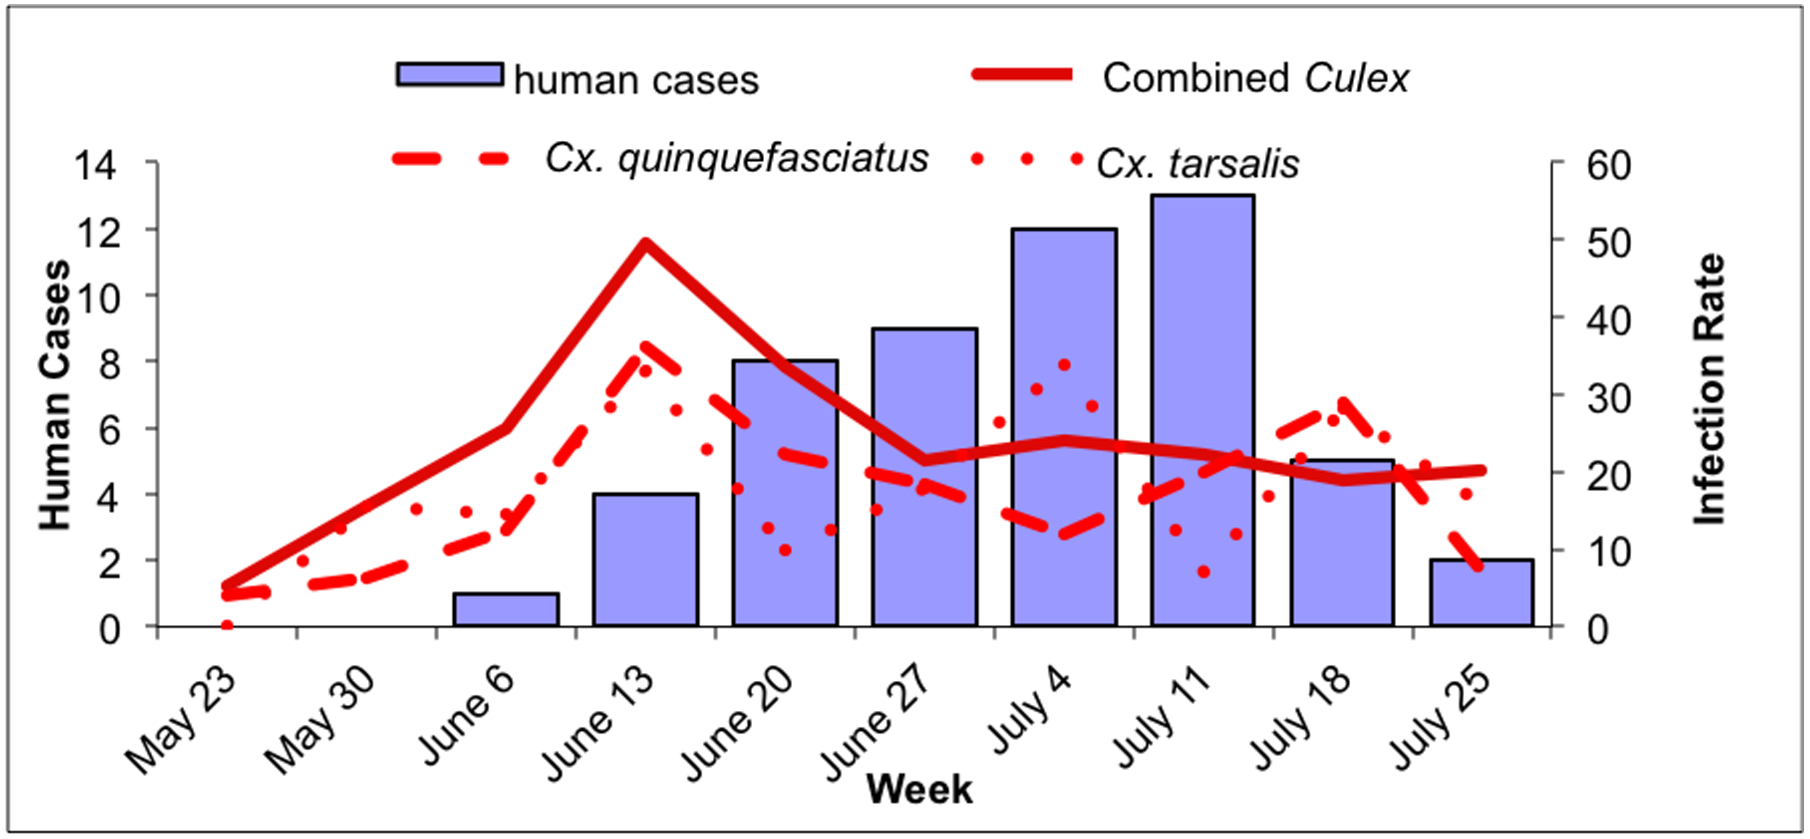
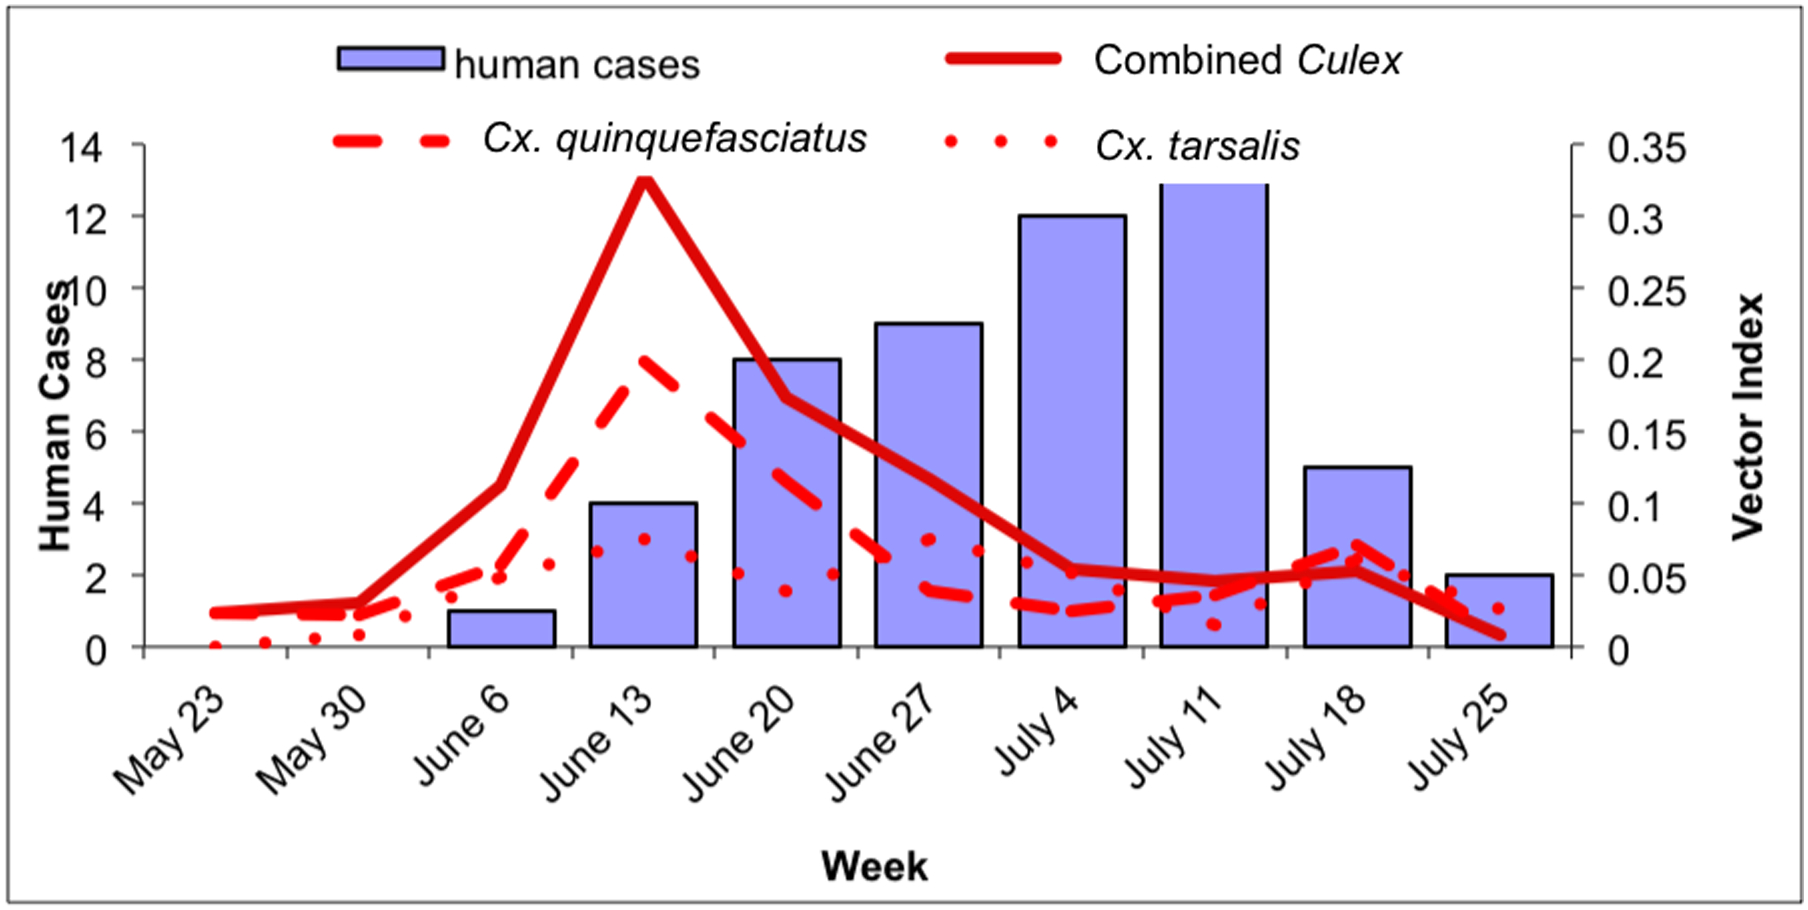
Culex WNV indices and human cases within the outbreak area, May 23–July 31. 2a: Culex IR (positive mosquitoes per 1000 tested) and human cases in the outbreak area. Solid line: combined Culex IR; dashed line: Cx. quinquefasciatus IR; dotted line: Cx. tarsalis IR. 2b: Culex VI (estimate of WNV-infected mosquitoes collected per trap night) and human cases in the outbreak area. Solid line: combined Culex VI; dashed line: Cx. quinquefasciatus VI; dotted line: Cx. tarsalis VI.
Fig. 4.
Culex WNV infection indices and human cases within RWCD, May 23–July 31. 4a: Culex maximum likelihood infection rate (IR; in positive mosquitoes per 1000 tested) and human cases in RWCD. Solid line: combined Culex IR; dashed line: Cx. quinquefasciatus IR; dotted line: Cx. tarsalis IR. 4b: Culex vector index (VI; in positive mosquitoes per trap night) and human cases in RWCD. Solid line: combined Culex VI; dashed line: Cx. quinquefasciatus VI; dotted line: Cx. tarsalis VI.
Fig. 3.
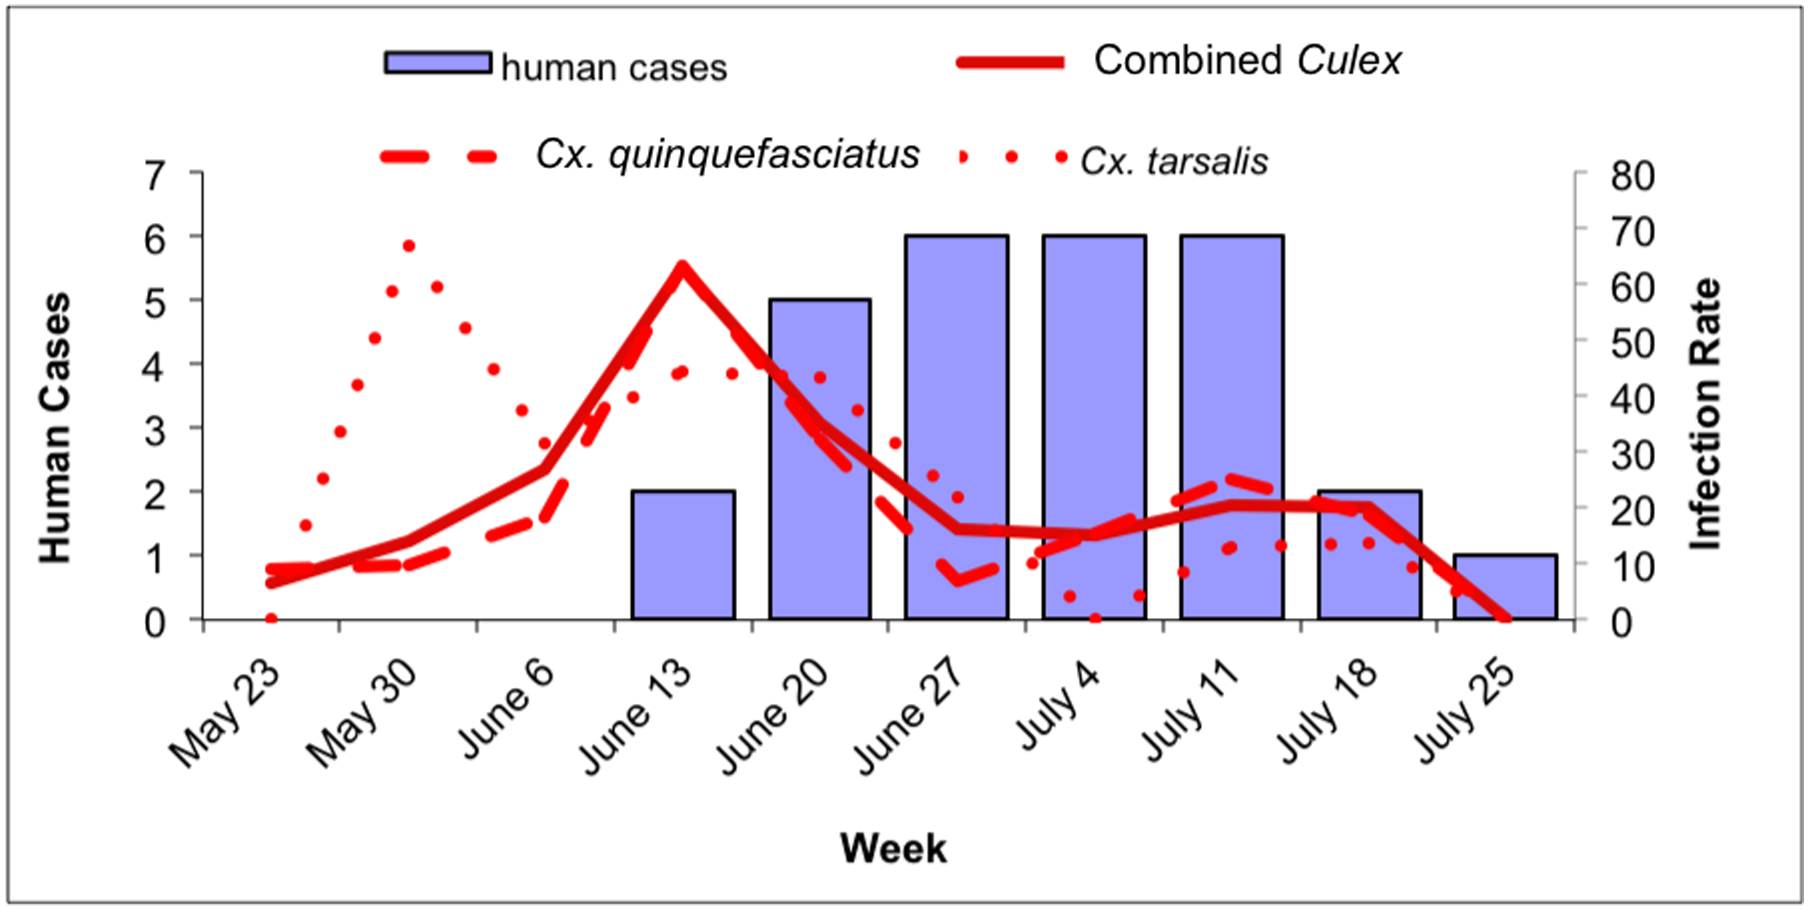
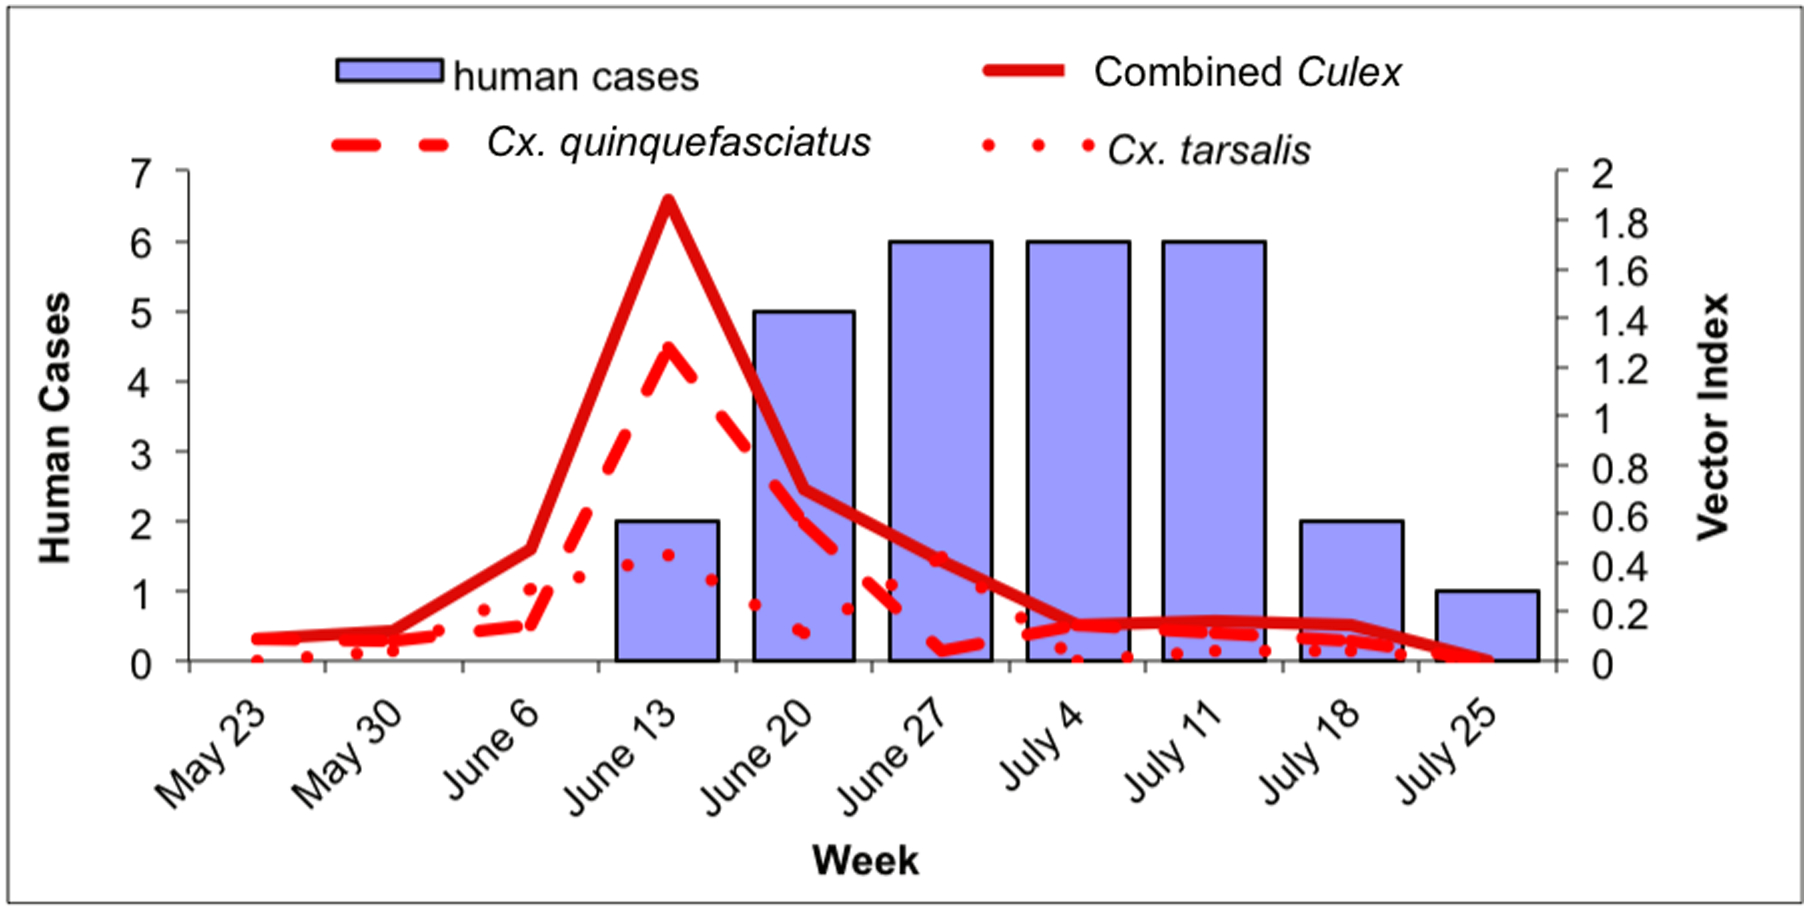
Culex WNV infection indices and human case onset within the city of Gilbert, May 23–July 31. 3a: Culex maximum likelihood infection rate (IR; in positive mosquitoes per 1000 tested) and human cases in Gilbert. Solid line: combined Culex IR; dashed line: Cx. quinquefasciatus IR; dotted line: Cx. tarsalis IR. 3b: Culex vector index (VI; in positive mosquitoes per trap night) and human cases in Gilbert. Solid line: combined Culex VI; dashed line: Cx. quinquefasciatus VI; dotted line: Cx. tarsalis VI.
Within the outbreak area, human cases of WNV disease peaked during the week of July 11 (Fig. 2a and b). Both the Cx. quinquefasciatus and combined Culex IR and VI peaked during the week of June 13, four weeks prior to the peak of human cases. In addition there was a minor peak for the Cx. quinquefasciatus IRs and VIs and the combined Culex VIs during the weeks of July 18, a week after the peak of human cases (Fig. 2a and b). Culex tarsalis IRs peaked three times during the weeks of June 13, July 4 and July 18. Similarly Cx. tarsalis VIs peaked three times peaked during the weeks of June 13, July 4 and June 27 and July 18, but these peaks were low compared to the VI peaks for Cx. quinquefasciatus (Fig. 2a and b).
Within the Town of Gilbert, human cases peaked during the week of June 27 and remained at that level through the week of July 11 (Fig. 3a and b). Culex quinquefasciatus IR and VI, and the combined Culex IR and VI peaked during the week of June 13, while the IR and VI for Cx. tarsalis were more variable: the IR peaked during the week of May 30, between the weeks of June 6 and June 20 and increased again during the weeks of July 11 and July 18. In contrast, there was no VI peak during the week of May 30 for Cx. tarsalis and the 2 peaks during the weeks of June 13 and June 27 were low compared to the VI peaks of Cx. quinquefasciatus (Figs. 3a and b).
Within RWCD, human WNV infection cases peaked during the week of June 20; cases declined for the following 2 weeks before peaking during the week of July 11 at the same level as during the initial peak (Fig. 4a and b). The weekly combined Culex IR within RWCD show a broad high activity period between the weeks of June 6 to June 27 and a peak during the week of July 11 (Fig. 4a). The weekly combined Culex VI had three peaks during the week of June 13, June 27 and July 11 (Fig. 4b). Culex quinquefasciatus IR closely mimicked that of the combined Culex IR; there was a broad high activity period between the weeks of June 6 and June 27 and a peak during the week of July 11 (Fig. 4a). However, the Cx. quinquefasciatus VI peaked during the week of June 13, a week before the first human peak and stayed low for the rest of the study period (Fig. 4b). Culex tarsalis IR had a broad period of high activity from June 13 to June 27, but this period was shorter than that of Cx. quinquefasciatus by two weeks (Fig. 4a). The Cx. tarsalis VI had two peaks during the weeks of June 13 and June 27 (Fig. 4b). However, the Cx. tarsalis VI were more than three times lower than the Cx. quinquefasciatus peak (Fig. 4b).
Results of analyses evaluating correlations among the indices and the number of human cases with onsets one, two and three weeks later are shown in Fig. 5a, b and c. All of the indices demonstrated significant correlations with human cases (Fig. 5a, b and c, Table 3) suggesting that all these indices could have been used to predict the outbreak. The highest correlation was between the combined Culex VI and the number of cases in the outbreak area (RWCD and Gilbert) with symptom onset two weeks later (Fig. 5a, b and c, Table 3). The highest correlation between Cx. quinquefasciatus infection indices and human cases was different for each area of the study (Fig. 5b) suggesting different WNV transmission dynamics between the areas. Nonetheless, the correlation coefficients between the VI and the total number of human cases with symptom onset dates two weeks later were highly significant (Table 3) which supports the conclusion that Cx. quinquefasciatus played a major role in the outbreak.
Fig. 5.
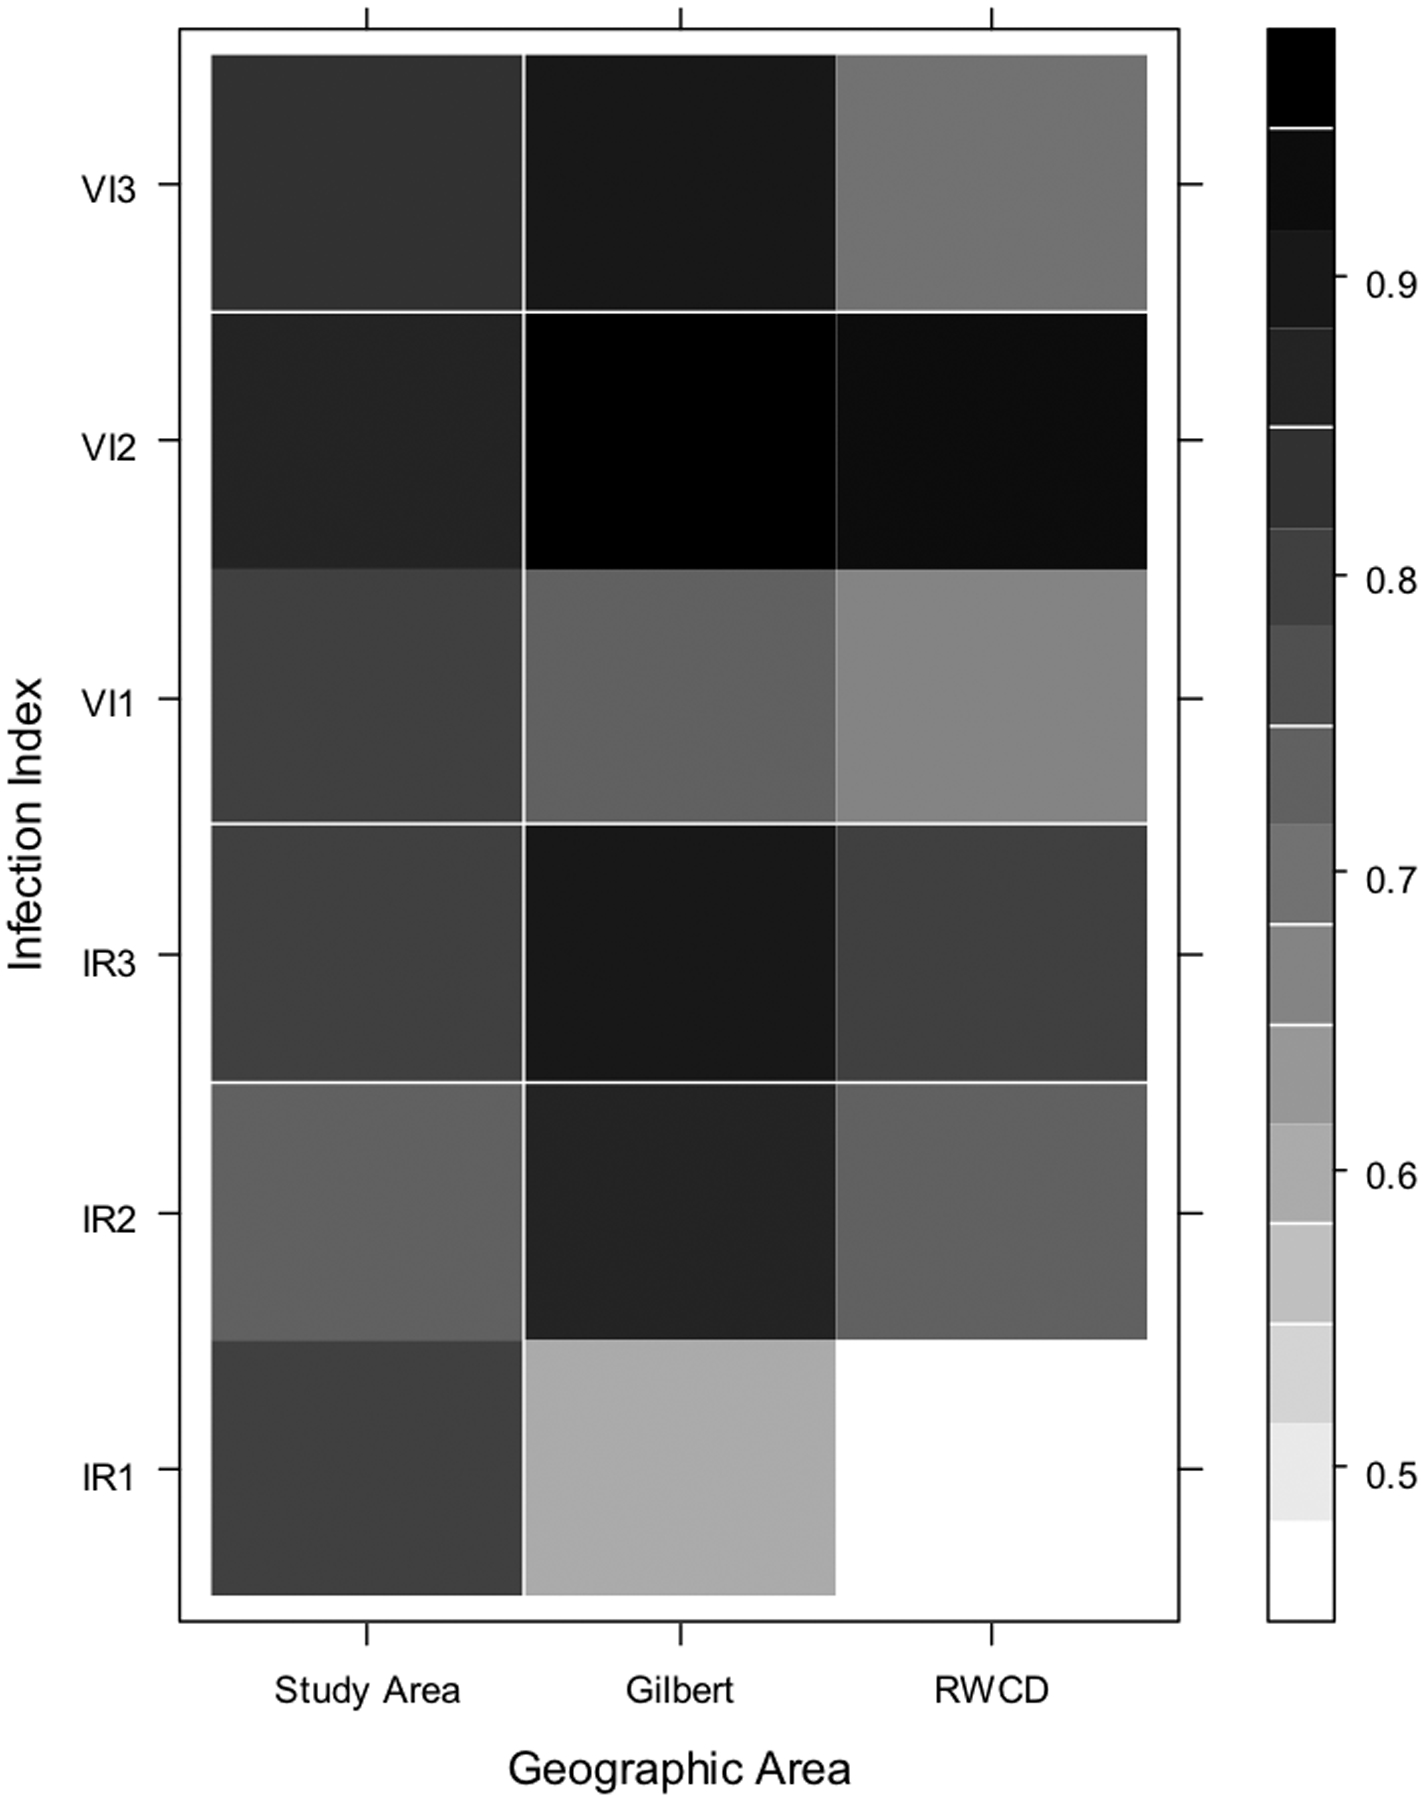
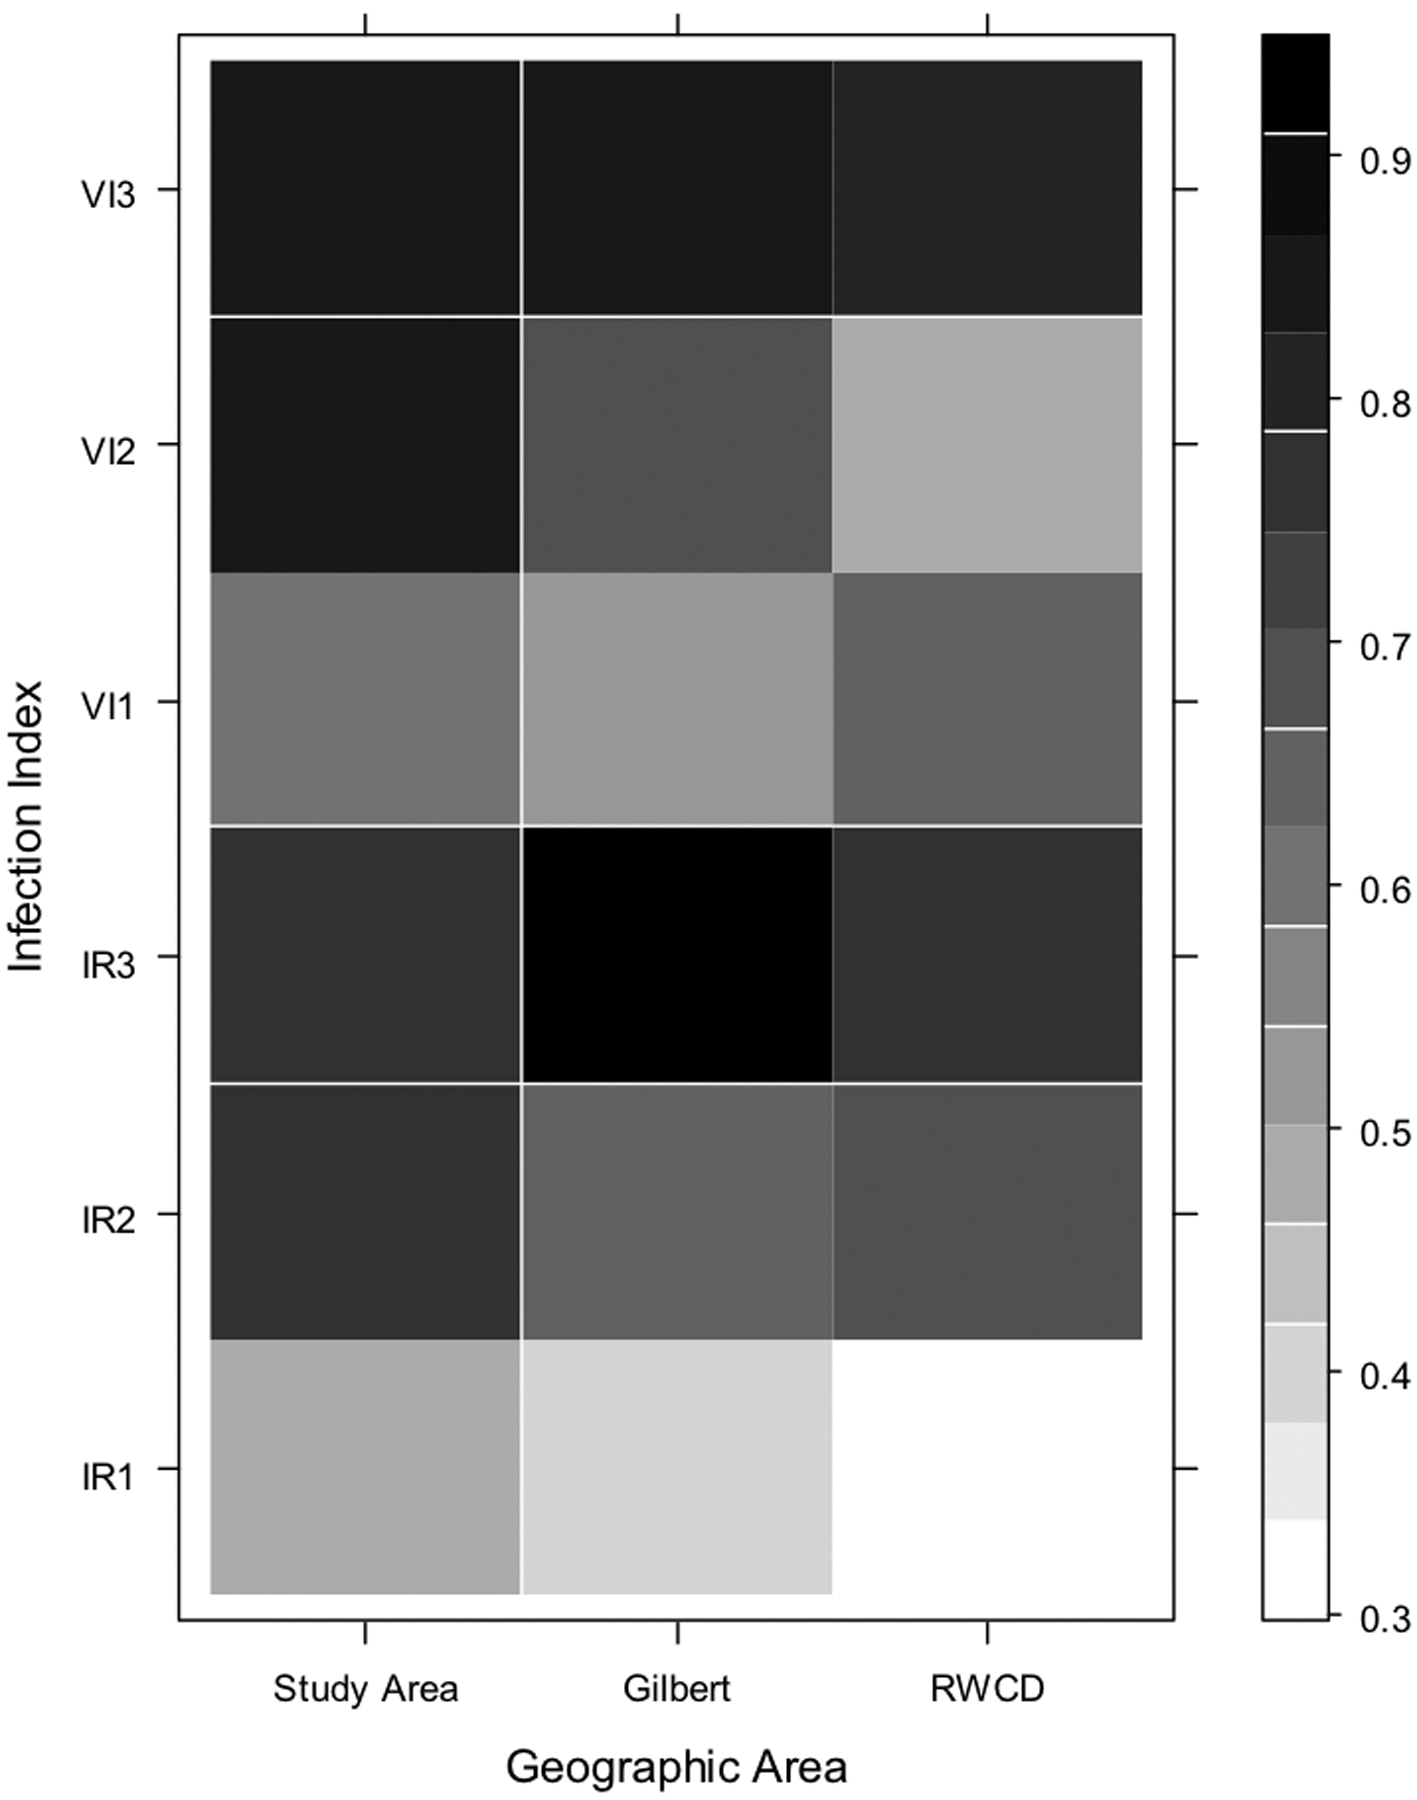
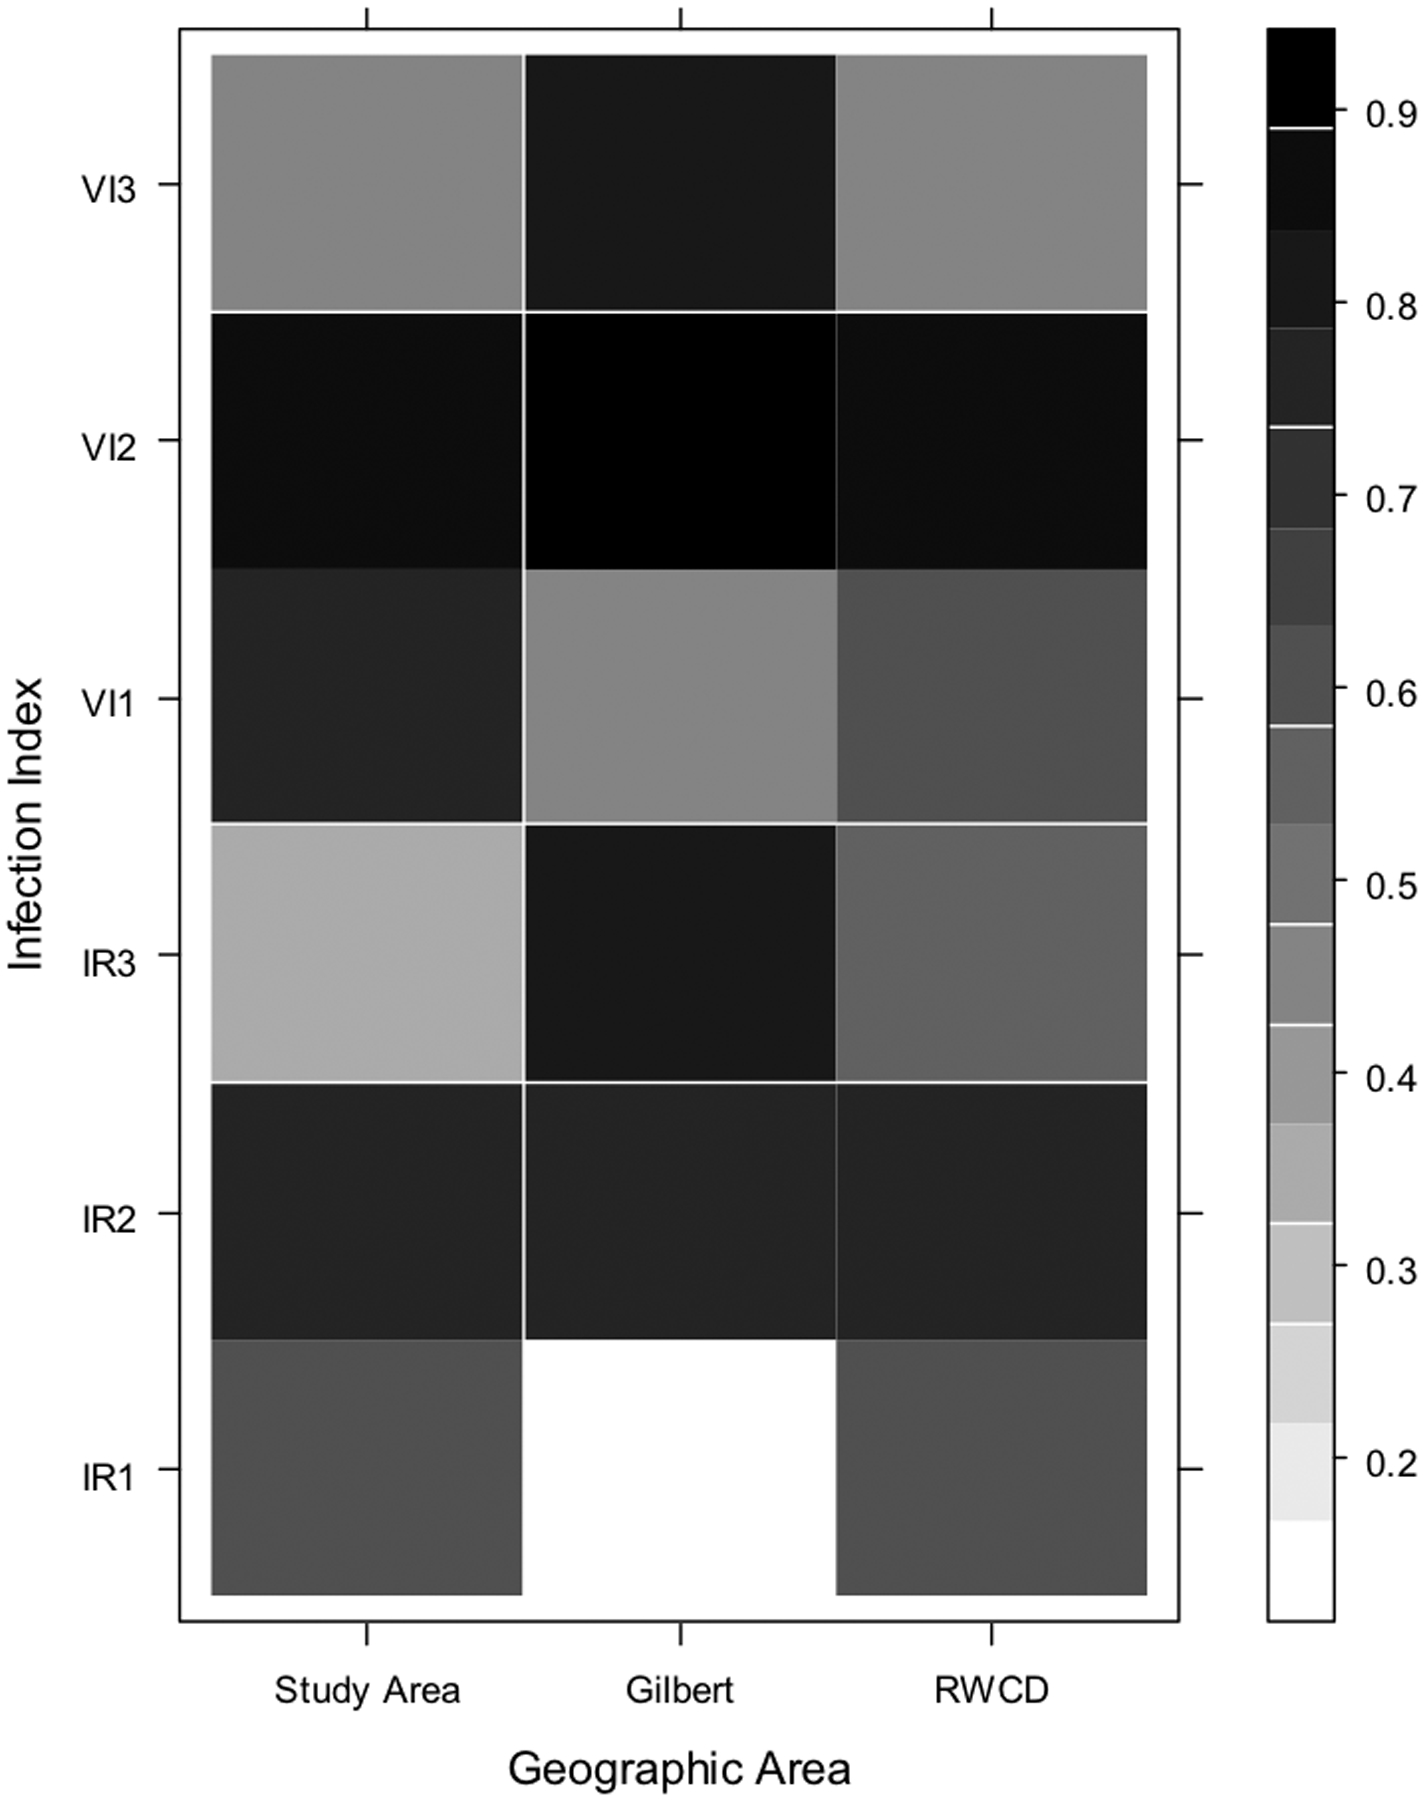
Correlation matrix showing the Spearman’s correlation coefficients for the number of human cases with onset occurring during each week of the study in each geographic area and the corresponding mosquito infection index at one, two, and three weeks prior to the weekly human cases. Geographic areas are on the X axis, and infection indices are on the Y axis; the numbers 1, 2, and 3 correspond to the index at one, two, and three weeks prior to human case onset date, respectively. The scale on the right of the graph represents different correlation coefficients: darker colored squares indicate a higher correlation coefficient. Fig. 5a: combined Culex species; Fig. 5b: Cx. quinquefasciatus; Fig. 5c: Cx. tarsalis.
Table 3.
Spearman rank correlation P values between human cases and mosquito indices 2 weeks prior to human disease onset date, by mosquito species and geographic location.
| Study Area | Gilbert | RWCD | |
|---|---|---|---|
| Vector index 2 weeks prior to symptom onset | |||
| Cx. quinquefascaitus | 0.0013 | 0.0322 | 0.141 |
| Cx. tarsalis | 0.0013 | 0.0005 | 0.0013 |
| Combined | 0.0008 | <0.001 | <0.001 |
| IR 2 weeks prior to symptom onset | |||
| Cx. quinquefascaitus | 0.0082 | 0.0473 | 0.0241 |
| Cx. tarsalis | 0.0155 | 0.0152 | 0.0148 |
| Combined | 0.0144 | 0.0018 | 0.0162 |
Discussion
The transmission dynamics of WNV are complex, owing to the multiple factors involved in the transmission cycle. Ecological factors (Brown 2008), environmental factors (Vazquez-Prokopek 2011), and vector behavior (Hamer 2009) have been among the many factors determined important in the transmission of WNV. As a consequence of this complex transmission ecology, predicting outbreaks of WNV disease in human populations has proved difficult. Nonetheless, the need to identify the timing and location of these outbreaks remains. This is because appropriately timed public health prevention measures applied to areas of high risk can theoretically be effective at mitigating outbreaks of WNV disease in human populations (Carney et al. 2011). Previous studies have identified entomological parameters and abiotic features associated with individual outbreaks (Nielsen et al. 2008, Reisen 2008a and b, Ruiz 2004, 2007), but they did not find a single factor that can consistently be used to predict outbreaks in humans across different ecological regions and spatial scales. The results presented here demonstrate that both the IR and the VI were able to predict the location of outbreaks of human WNV disease at a sub-county level at least two weeks prior to an increase in the number of cases during the outbreak in Phoenix, AZ in 2010. While relatively short, this may provide sufficient time to allow the implementation of more intensive public health prevention measures such as enhanced mosquito control and public education activities.
Our data suggests that the principal vector for this outbreak was Cx. quinquefasciatus based on two entomological parameters: relative abundance and infection rates. The estimated density of Cx. quinquefasciatus in the outbreak area during the study period was approximately 33 times higher than that in the control area. In addition, the density of Cx. quinquefasciatus in the study area was approximately 1.7 times higher than the density of Cx. tarsalis suggesting that Cx. quinquefasciatus was the most abundant WNV vector in the outbreak area. The densities of both Cx. quinquefasciatus and Cx. tarsalis in the control area were low suggesting an association between high mosquito densities in the study area and the WNV outbreak. High mosquito densities have previously been associated with arboviral disease outbreaks (Olson et al. 1979, Eldridge 2004) and often risk assessments involve estimating mosquito abundance (Tonn et al. 1969, Sheppard et al. 1969, Bang et al. 1981). The Breteau Index (BI) (Breteau 1954) for example, which is commonly used for risk assessment of Ae. aegypti-borne arboviral diseases, estimates adult Ae. aegypti abundance (Tun-Lin et al. 1996). However, the fact that Cx. quinquefasciatus was the most abundant WNV vector collected is not surprising since Cx. quinquefasciatus has been previously associated with outbreaks in residential areas (Nielsen et al. 2008) and especially in southern California (Kwan et al. 2012) where the climate and demographics are very similar to central Arizona.
Lastly, Cx. quinquefasciatus is the main species associated with the neglected pools in southwestern US (Reisen et al. 2008a). In 2010 alone Maricopa County Environmental Services Vector Control Division received 10,879 green pool complaints, of which 9,202 were investigated and 2,888 treated. The Maricopa County Environmental Services Vector Control Division responds to neglected pools on the basis of resident complaints and the true number and locations of neglected pools are not known. Because of this, the impact of neglected pools on the WNV outbreak is difficult to evaluate, but the large number of neglected pools investigated suggests that it was a contributing factor.
The temporal patterns in the indices consistently show that both IR and VI in Cx. quinquefasciatus peaked prior to human cases suggesting that this species was involved in the initiation of the outbreak. In contrast the VI profiles for Cx. tarsalis were flat and low suggesting limited involvement in initiating and sustaining transmission (Figs. 2b, 3b and 4b). Taken together, the higher abundance and the infection rate profiles strongly suggest that Cx. quinquefasciatus was the primary vector for this outbreak. Godsey et al. (2012) independently conducted entomological investigations during the outbreak in Arizona, 2010, and came to the same conclusion that Cx. quinquefasciatus was the primary vector. However, the surveillance data clearly suggest a role for Cx. tarsalis in the WNV transmission ecology of this area as a secondary vector and both Cx. quinquefasciatus and Cx. tarsalis were taken into account when considering entomological parameters associated with human disease.
The epicenter of the outbreak was in the southeastern section of Maricopa County, especially the area within the RWCD. The RWCD practices flood irrigation; the yards are flooded once every 13 days and often soon after mowing the lawns. The irrigation water often mixed with grass clippings may stand and ferment for several days in the Arizona heat creating extensive larval habitats for Cx. quinquefasciatus. Culex tarsalis is primarily associated with agricultural irrigation in rural areas and seldom associated with residential or urban areas (Reisen et al. 2008a). The extensive larval habitats presumably contributed to observed high population densities of Cx. quinquefasciatus and may have been a contributing factor to this outbreak. In the control area and many other areas outside RWCD, sprinkler and drip systems are the primary methods of irrigation used in residential areas. However, residential flood irrigation has been used for a long time without causing outbreaks and may have been only one contributing factor. The abundance of neglected pools in 2010 also may have contributed to the outbreak.
The trends of the IR and VI over the study period were different for Cx. quinquefasciatus and Cx. tarsalis. The IR trends profiles often varied independent of the human cases showing that IR was not the best index for predicting the WNV outbreak in the human population in Maricopa County, AZ in 2010. On the other hand, VI trends peaked one to two weeks before the peaks of human cases showing that VI was better for predicting the WNV outbreak in the human population in Maricopa County, AZ, 2010. Our observations are very similar to those by Kwan et al. (2012) who reported high and stable VI estimates 2 to 4 weeks before the onset of human cases in Los Angeles, CA for the period 2004 through 2010. Previously, Gu et al. (2008) argued that the commonly used entomological indices the Minimum Infection Rate (MIR) and IR have serious limitations especially when the infection rates are high or when the mosquito density is low. They suggested a composite index that estimates the density of infected mosquitoes similar to the entomological inoculation rate (EIR) (Beier et al. 1999) commonly used in malaria control programs. The VI is such a composite, in that it takes into account both the infection rates and the mosquito abundance and is estimates of the density of infected mosquitoes. Unlike the EIR, the VI does not include a factor describing the rate of contact of infected mosquitoes with humans. The observations we report in this paper and those by Kwan et al. (2012) show that the VI is a good predictor of human risk under field condition and some local health departments such as the city of Chicago (Jones et al. 2011) have adopted the VI as the primary risk assessment index.
We observed that the Cx. quinquefasciatus VIs contributed more to the combined VI than did the Cx. tarsalis VIs. This supports the hypothesis by Nasci et al. (2005) that the VI might be used to infer the relative contribution of individual species to transmission of WNV. The actual importance of Cx. tarsalis as a vector in this outbreak may have been greater than we observed due to its higher vector competence compared to Cx. quinquefasciatus (Riesen et al. 2008b). The vector risk index by Kilpatrick et al. (2005) may have helped shed more light on the relative importance of Cx. quinquefaciatus and Cx. tarsalis but blood meal identifications are not routinely conducted in mosquito surveillance programs and the data is not available to compute human feeding indices. However, we recommend that a number of factors, such as human blood-feeding habits, vector competence, and trapping bias, must be taken into account when attempting to use the VI in this capacity. Finally, the consistent association of the combined Culex measures with human cases, both in terms of location and timing , suggest that this is the most practical index to use when making decisions regarding implementation of WNV countermeasures.
References
- Bang YH, Bown DN, Onwubiko AO. 1981. Prevalence of larvae of potential yellow fever vectors in domestic water containers in south-east Nigeria. Bull World Health Organ 59: 107–114. [PMC free article] [PubMed] [Google Scholar]
- Beier JC, Killeen GF, Githure JI. 1999. Short report: entomologic inoculation rates and Plasmodium falciparum malaria prevalence in Africa. Am J Trop Med Hyg 61: 109–113. [DOI] [PubMed] [Google Scholar]
- Breteau H 1954. Yellow fever in French West Africa; an aspect of mass-preventive medicine. Bull World Health Organ 11: 453–481. [PMC free article] [PubMed] [Google Scholar]
- Brown HE, Childs JE, Diuk-Wasser MA, Fish D. 2008. Ecological factors associated with West Nile virus transmission, northeastern United States. Emerg Infect Dis 14:1539–1545. [DOI] [PMC free article] [PubMed] [Google Scholar]
- Burkhalter KL, Lindsay R, Anderson R, Dibernardo A, Fong W, Nasci RS. 2006. Evaluation of commercial assays for detecting West Nile virus antigen. J Am Mosq Control Assoc 22: 64–69. [DOI] [PubMed] [Google Scholar]
- CDC [Centers for Disease Control and Prevention]. 2011. Software for Mosquito Surveillance. [Internet]. Fort Collins, CO: CDC Division of Vector-Born Diseases; [accessed] June 21 2012 http://www.cdc.gov/ncidod/dvbid/westnile/software.htm [Google Scholar]
- CDC [Centers for Disease Control and Prevention]. 2012. West Nile Virus Statistics, Surveillance and Control Archives. [Internet]. Fort Collins, CO: CDC Division of Vector-Born Diseases; [accessed] June 21 2012 http://www.cdc.gov/ncidod/dvbid/westnile/surv&control_archive.htm [Google Scholar]
- Chiang CL, Reeves WC. 1962. Statistical estimation of virus infection rates in mosquito vector populations. Am J Hyg 75: 377–391. [DOI] [PubMed] [Google Scholar]
- Carney RM, Ahearn SC, McConchie A, Glasner C, Jean C, Barker C, Park B, Padgett K, Parker E, Aquino E, Kramer V. 2011. Early Warning System for West Nile Virus Risk Areas, California, USA. Emerg Infect Dis. 17:1445–1454. [DOI] [PMC free article] [PubMed] [Google Scholar]
- Darsie RF Jr. and Ward RA. 2005. Identification and Geographical Distribution of the Mosquitoes of North America, North of Mexico. Gainesville: University Press of Florida. [Google Scholar]
- Dauphin G, Zientara S, Zeller H, Murgue B. 2004. West Nile: worldwide current situation in animals and humans. Comp Immunol Microbiol Infect Dis 27:343–355. [DOI] [PubMed] [Google Scholar]
- Eldridge BF. 2004. Surveillance for arthropodborne diseases. In Eldridge and Edman eds Medical Entomology, Kluwer Academic Press, Dordrecht, The Netherlands, pp 645. [Google Scholar]
- Gibney KB, Colborn J, Baty S, Bunko Patterson AM, Sylvester T, Briggs G, Stewart T, Levy C, Komatsu K, MacMillan K, Delorey MJ, Mutebi JP, Fischer M, Staples JE. 2012. Modifiable risk factors for West Nile virus infection during an outbreak--Arizona, 2010. Am J Trop Med Hyg 86:895–901. [DOI] [PMC free article] [PubMed] [Google Scholar]
- Gu W, Unnasch TR, Katholi CR, Lampman R, Novak RJ. 2008. Fundamental issues in mosquito surveillance for arboviral transmission. Trans R Soc Trop Med Hyg 102: 817–822. [DOI] [PMC free article] [PubMed] [Google Scholar]
- Gujral IB, Zielinski-Gutierrez EC, LeBailly A, Nasci R. 2007. Behavioral risks for West Nile virus disease, northern Colorado, 2003. Emerg Infect Dis 13:419–425. [DOI] [PMC free article] [PubMed] [Google Scholar]
- Hamer GL, Walker ED, Brawn JD, Loss SR, Ruiz MO, Goldberg TL, Schotthoefer AM, Brown WM, Wheeler E, Kitron UD, 2008. Rapid amplification of West Nile virus: the role of hatch-year birds. Vector Borne Zoonotic Dis 8: 57–67. [DOI] [PubMed] [Google Scholar]
- Hayes CG. 1989. West Nile Fever In Monath TP ed. The arboviruses: Epidemiology and Ecology, Vol. 5 Boca Raton, FL: CRC Press: 59–88. [Google Scholar]
- Hayes EB, Sejvar JJ, Zaki SR, Lanciotti RS, Bode AV, Campbell GL. 2005. Virology, pathology, and clinical manifestations of West Nile virus disease. Emerg Infect Dis 11:1174–1179. [DOI] [PMC free article] [PubMed] [Google Scholar]
- Jones RC, Weaver KN, Smith S, Blanco C, Flores C, Gibbs K, Markowski D, Mutebi JP. 2011. Use of the vector index and geographic information system to prospectively inform West Nile virus interventions. J Am Mosq Control Assoc 27: 315–319. [DOI] [PubMed] [Google Scholar]
- Kilpatrick AM, Kramer LD, Campbell SR, Alleyne EO, Dobson AP, Daszak P, 2005. West Nile virus risk assessment and the bridge vector paradigm. Emerg Infect Dis 11: 425−−429. [DOI] [PMC free article] [PubMed] [Google Scholar]
- Kramer LD, Styer LM, Ebel GD. 2008. A global perspective on the epidemiology of West Nile virus. Ann Rev Entomol 53: 61–81. [DOI] [PubMed] [Google Scholar]
- Kwan JL, Park BK, Carpenter TE, Ngo V, Civen R, Reisen WK. 2012. Comparison of enzootic risk measures for predicting west nile disease, Los Angeles, California, USA, 2004–2010. Emerg Infect Dis 18: 1298–1306. [DOI] [PMC free article] [PubMed] [Google Scholar]
- Lindsey NP, Staples JE, Lehman JA, Fischer M. 2010. Surveillance for human West Nile virus disease - United States, 1999–2008. MMWR Surveill Summ 59: 1–17. [PubMed] [Google Scholar]
- MCDPH [Maricopa County Department of Public Health]. 2007. West Nile Virus Maricopa County 2003 & 2004. [Internet]. Phoenix, AZ: Maricopa County Department of Public Health; [accessed] June 20 2012 http://www.maricopa.gov/publichealth/Services/EPI/pdf/wnv/wnv03-04.pdf [Google Scholar]
- Nash D, Mostashari F, Fine A, Miller J, O’Leary D, Murray K, Huang A, Rosenberg A, Greenberg A, Sherman M, Wong S, Layton M. 2001. The outbreak of West Nile virus infection in the New York City area in 1999. N Engl J Med 344: 1807–1814. [DOI] [PubMed] [Google Scholar]
- Nasci RS, Doyle M, Biggerstaff BJ, LeBailly A. 2005. Calculation and application of a vector index (VI) reflecting the number of WN Virus infected mosquitoes in a population. In: 71st Annual Meeting of the American Mosquito Control Association; 2005 April 3–7; Vancouver, Canada: p 188 (http://www.colorado.gov/cs/Satellite?blobcol=urldata&blobheadername1=Content-Disposition&blobheadername2=Content-Type&blobheadervalue1=inline%3B+filename%3D%22Calculation+of+infected+mosquitoes+in+a+population+(CDC+poster).pdf%22&blobheadervalue2=application%2Fpdf&blobkey=id&blobtable=MungoBlobs&blobwhere=1251811806510&=true) accessed October 19, 2012)). [Google Scholar]
- Nielsen CF, Armijos MV, Wheeler S, Carpenter TE, Boyce WM, Kelley K, Brown D, Scott TW, Reisen WK. 2008. Risk factors associated with human infection during the 2006 West Nile virus outbreak in Davis, a residential community in northern California. Am J Trop Med Hyg 78:53–62. [PMC free article] [PubMed] [Google Scholar]
- Novello AC. 2000. West Nile virus in New York State: The 1999 outbreak and response plan for 2000. Viral Immunology 13: 463–467. [DOI] [PubMed] [Google Scholar]
- Olson JG, Reeves WC, Emmons RW, Milby MM. 1979. Correlation of Culex tarsalis population indices with the incidence of St. Louis encephalitis and western equine encephalomyelitis in California. Am J Trop Med Hyg 28: 335–343. [DOI] [PubMed] [Google Scholar]
- Reisen WK, Takahashi RM, Carroll BD, Quiring R. 2008a. Delinquent Mortgages, Neglected Swimming Pools, and West Nile Virus, California. Emerg Infect Dis 14: 1747–1749. [DOI] [PMC free article] [PubMed] [Google Scholar]
- Reisen WK, Barker CM, Reisen WK, Fang Y, Martinez VM. 2008b. Does variation in Culex (Diptera: Culicidae) vector competence enable outbreaks of West Nile virus in California? J Med Entomol 45:1126–1138. [DOI] [PubMed] [Google Scholar]
- Ruiz MO, Tedesco C, McTighe TJ, Austin C, Kitron UD. 2004. Environmental and social determinants of human risk during a West Nile virus outbreak in the greater Chicago area, 2002. Int J Health Geogr 3: 8–19. [DOI] [PMC free article] [PubMed] [Google Scholar]
- Ruiz MO, Walker ED, Foster ES, Haramis LD, Kitron UD. 2007. Association of West Nile virus illness and rban landscapes in Chicago and Detroit. Int J Health Geogr 6: 10–21. [DOI] [PMC free article] [PubMed] [Google Scholar]
- Sheppard PM, Macdonald WW, Tonn RJ. 1969. A new method of measuring the relative prevalence of Aedes aegypti. Bull World Health Organ 40: 467–468. [PMC free article] [PubMed] [Google Scholar]
- Sugumaran RLarson SR, DeGroote JP. 2009. Spatio-temporal cluster analysis of county-based human West Nile virus incidence in the continental United States. Int J Health Geogr 8: 43–62. [DOI] [PMC free article] [PubMed] [Google Scholar]
- Tonn RJ, Sheppard PM, Macdonald WW, Bang YH. 1969. Replicate surveys of larval habitats of Aedes aegypti in relation to Dengue haemorrhagic fever in Bangkok, Thailand. Bull World Health Organ 40: 819–829. [PMC free article] [PubMed] [Google Scholar]
- Tun-Lin W, Kay BH, Barnes A, Forsyth S. 1996. Critical examination of Aedes aegypti indices: correlations with abundance. Am J Trop Med Hyg 54: 543–547. [DOI] [PubMed] [Google Scholar]
- Turell MJ, Dohm DJ, Sardelis MR, Oguinn ML, Andreadis TG, Blow JA. 2005. An update on the potential of North American mosquitoes (Diptera: Culicidae) to transmit West Nile Virus. J Med Entomol 42:57–62 [DOI] [PubMed] [Google Scholar]
- Vazquez-Prokopec GM, Vanden Eng JL, Kelly R, Mead DG, Kolhe P, Howgate J, Kitron U, Burkot TR. 2010. The risk of West Nile Virus infection is associated with combined sewer overflow streams in urban Atlanta, Georgia, USA. Environ Health Perspect 118: 1382–1388. [DOI] [PMC free article] [PubMed] [Google Scholar]
- Winters AM, Eisen RJ, Delorey MJ, Fischer M, Nasci RS, Zielinski-Gutierrez E, Moore CG, Pape WJ, Eisen L. 2010. Spatial risk assessments based on vector-borne disease epidemiologic data: importance of scale for West Nile virus disease in Colorado. Am J Trop Med Hyg 82: 945–953. [DOI] [PMC free article] [PubMed] [Google Scholar]