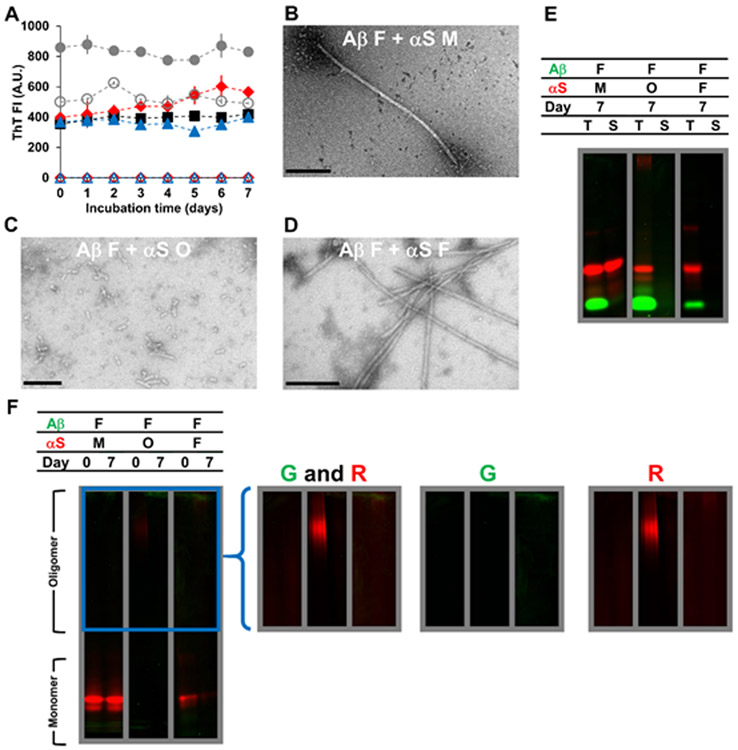
Figure 3.
Characterizations of Aβ fibrils (F) mixed with αS monomers (M), αS oligomers (O) or αS fibrils (F) incubated for 7 days at 37 °C, as examined by (A) ThT fluorescence, (B-D) TEM, and (E-F) in-gel fluorescence imaging of (E) SDS-PAGE and (F) native-PAGE. In (A-F), the concentration of Aβ fibrils was 70 μM. The concentrations of αS monomers and αS fibrils were 350 μM and that of αS oligomers was 17 μM. Concentrations of oligomers and fibrils were monomer-equivalent concentrations. In (A), the data on Aβ fibrils mixed with αS monomers (filled red diamonds), αS oligomers (filled blue triangles) and αS fibrils (filled gray circles) are shown along with those on αS monomers alone (empty red diamonds), αS oligomers alone (empty blue triangles) and αS fibrils alone (empty gray circles) taken from Figure S7A. The data on Aβ fibrils alone (filled black squares) taken from Figure S3A are also shown for comparison. Error bars: 1 standard deviation of triplicates. In (B-D), representative TEM images of mixtures containing (B) Aβ fibrils and αS monomers, (C) Aβ fibrils and αS oligomers and (D) Aβ fibrils and αS fibrils are shown with scale bars of 200 nm. In (E-F), samples contained HiLyte Fluor 488-labeled Aβ (green) and Alexa Fluor 647-labeled αS (red). Each panel was taken from a bigger gel image (see Figure S5) and reassembled for better presentation. In (E), T: total fraction and S: soluble fraction. In (F), the images in the right provide brighter upper portions of the native-PAGE gels – enclosed by a blue box in the left – obtained by renormalizing the brightness from the monomer to the oligomer bands, which often contained lower percentages of fluorophores. G: green channel and R: red channel.

