Significance Statement
Hypertension often occurs before renal function deteriorates in patients with autosomal dominant polycystic kidney disease (ADPKD), but it is unknown whether polycystin-1, the Pkd1 gene product, itself contributes to ADPKD hypertension. The authors examined this in mice with nephron-specific disruption of the Pkd1 gene without renal cysts. Compared with control mice, these knockout mice manifested reduced BP, enhanced natriuresis, decreased expression of Na+/K+/2Cl− cotransporter isoform 2 (NKCC2) protein, and increased urinary PGE2 excretion in response to a high salt diet. Blockade of cyclooxygenase-2 abolished the BP difference between Pkd1 knockout and control mice. These studies, apparently the first in vivo studies to describe a potential physiologic role for nephron polycystin-1, suggest that nephron polycystin-1 deficiency per se does not contribute to ADPKD-associated hypertension.
Keywords: nephron, polycystic kidney disease, blood pressure, epithelial sodium transport
Abstract
Background
Hypertension often occurs before renal function deteriorates in autosomal dominant polycystic kidney disease (ADPKD). It is unknown whether the Pkd1 gene product polycystin-1—the predominant causal factor in ADPKD—itself contributes to ADPKD hypertension independent of cystogenesis.
Methods
We induced nephron-specific disruption of the Pkd1 gene in 3-month-old mice and examined them at 4–5 months of age.
Results
Kidneys from the Pkd1 knockout mice showed no apparent renal cysts, tubule dilation, or increased cell proliferation. Compared with control mice, Pkd1 knockout mice exhibited reduced arterial pressure during high salt intake; this associated with an increased natriuretic, diuretic, and kaliuretic response during the first 2–3 days of salt loading. The lower arterial pressure and enhanced natriuresis during high salt loading in Pkd1 knockout mice were associated with lower urinary nitrite/nitrate excretion and markedly increased urinary PGE2 excretion, whereas GFR, plasma renin concentration, and urinary endothelin-1 excretion were similar between knockout and control mice. Kidney cyclooxygenase-2 protein levels were increased in Pkd1 knockout mice during high salt intake; administration of NS-398, a selective cyclooxygenase-2 inhibitor, abolished the arterial pressure difference between the knockout and control mice during high salt intake. Total kidney Na+/K+/2Cl− cotransporter isoform 2 (NKCC2) levels were greatly reduced in Pkd1 knockout mice fed a high salt diet compared with controls.
Conclusions
These studies suggest that nephron polycystin-1 deficiency does not itself contribute to ADPKD hypertension and that it may, in fact, exert a relative salt-wasting effect. The work seems to comprise the first in vivo studies to describe a potential physiologic role for nephron polycystin-1 in the absence of cysts, tubule dilation, or enhanced cell proliferation.
Hypertension occurs early in the clinical course of autosomal dominant polycystic kidney disease (ADPKD) and is often present before GFR is reduced.1,2 The pathogenesis of ADPKD-associated hypertension is not fully understood but has been related to several factors, including reduced renal blood flow and activation of the renin-angiotensin system due to cyst compression, vascular dysfunction due to impaired endothelial-dependent vasorelaxation, and enhanced sympathetic nervous system activity.2,3 The possibility has also been raised that defective renal polycystin-1, the Pkd1 gene product and predominant causative factor in ADPKD, may be involved in hypertension per se (i.e., independent of cyst formation). Studies addressing this issue have primarily analyzed cell lines or cells isolated from cystic kidneys, involve polycystic kidney disease models with mutation of genes other than Pkd1, and have yielded conflicting results.4–7 In an attempt to address this issue, Verschuren et al.8 recently developed a tamoxifen-inducible distal nephron (Cre recombinase under control of the kidney-specific cadherin [Ksp] promoter) Pkd1 gene-targeted mouse. These mice were given tamoxifen at postnatal days 18–20 and studied on a normal salt diet at days 40 or 47 postnatal. Distal nephron Pkd1 knockout (KO) mice had no detectable alternations in urinary Na+ excretion, although decreased serum Na+ concentration and reduced mRNA levels of the Na+/Cl− cotransporter (NCC) and the Na+/K+/2Cl− cotransporter isoform 2 (NKCC2) were observed (protein levels and BP were not measured). In addition, reduced serum Ca2+, Mg2+, and phosphate concentrations were noted. Importantly, Pkd1 KO mice had increased kidney weight, doubling of the renal cystic index, and dilated tubules. Hence, it remains unclear if polycystin-1 dysfunction, independent of cystogenesis, alters nephron Na+ excretion or BP. Consequently, we developed a mouse model of nephron-wide inducible Pkd1 gene KO that does not manifest evidence of cystogenesis and describe herein the effects of such gene targeting on renal function and BP.
Methods
Animal Care
All animal studies were conducted with the approval of the University of Utah Animal Care and Use Committee in accordance with the National Institutes of Health Guide for the Care and Use of Laboratory Animals.
Generation of Inducible Nephron-Specific Pkd1 KO Mice
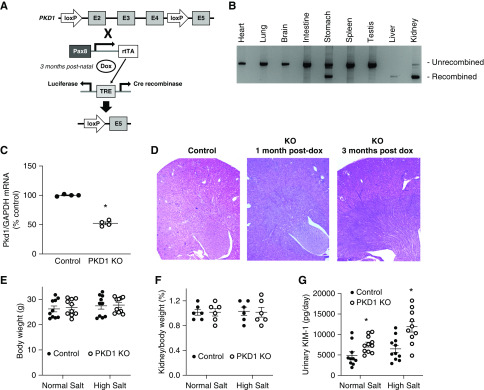
Nephron-specific Pkd1 KO mice were generated in a manner similar to that described previously (Figure 1A).9 Floxed Pkd1 mice have loxP sites flanking exons 2 and 4 of the Pkd1 gene and were provided by Gregory Germino while at the Johns Hopkins University.10 Floxed Pkd1 mice were bred with mice containing the Pax8-reverse tetracycline transactivator (rtTA; Pax8 promoter-rtTA confers nephron-specific targeting) and LC-1 transgenes (LC-1 transgene contains doxycycline/rtTA-inducible Cre recombinase and luciferase).11 Mice used in the studies were homozygous for the loxP-flanked Pkd1 gene and hemizygous for Pax8-rtTA and LC-1 transgenes. Doxycycline (2 mg/ml) was given in 2% sucrose drinking water to 3-month-old mice for 12 days (Pkd1 KO). Littermates of the same genotype and sex but without doxycycline treatment were used as controls. Control and Pkd1 KO mice aged 4–5 months (1:1 male:female) were studied.
Figure 1.
Nephron-specific Pkd1 gene targeting did not cause cyst formation or increased body weight at 3 months post knockout. (A) shows a schematic of the targeting strategy. (B) shows a representative organ panel (n=3) demonstrating unrecombined and recombinant bands. (C) shows relative renal Pkd1 mRNA content in control and Pkd1 KO mice (n=4). (D) shows kidney sections from control mice and Pkd1 KO mice 1 and 3 months after doxycycline treatment. (E and F) show body and kidney weights, respectively, for Pkd1 KO and control mice on normal and high salt diets (n=6–10 each data point). (G) shows urinary KIM-1 excretion in Pkd1 KO and control mice on normal and high salt diets (n=10 each data point). TRE, tetracycline response element. *P=0.05 KO versus control under same conditions.
Genotyping and Determination of Pkd1 Gene Recombination and mRNA Expression
Genotyping PCR was performed using tail DNA. The Pkd1 forward 5′-GGCTATAGGACAGGGATGACAT-3′ and reverse 5′-CATATTCCTCACCTGGGAACAG-3′ primers yielded a 294-bp product from the floxed Pkd1 gene and a 260-bp product from the wild-type allele. Pax8-rtTA forward 5′-CCATGTCTAGACTGGACAAGA-3′ and reverse 5′-CATCAATGTATCTTATCATGTCTGG-3′ primers yielded a 600-bp product, and LC-1 forward 5′-TCGCTGCATTACCGGTCGATGC-3′ and reverse 5′-CCATGAGTGAACGAACCTGGTCG-3′ primers yielded a 480-bp product.
To determine Pkd1 gene recombination, DNA was isolated from a variety of organs from Pkd1 KO mice, and PCR was performed using forward 5′-CGACCACCAAGCGAAACATC-3′ and reverse 5′-TCGTGTTCCCTTACCAACCCTC-3′ primers, which yielded a nonrecombined band of 1.9 kb and a recombined band of 850 bp. For mRNA determination, total kidney RNA from PKD1 KO and control mice was isolated (Quick-RNA MicroPrep Kit; Zymo Research, Irvine, CA) and reverse transcribed (High Capacity cDNA Reverse Transcription Kit; Applied Biosystems, Carlsbad, CA). PKD1 and glyceraldehyde-3-phosphate dehydrogenase (GAPDH) mRNA levels were determined by real-time PCR using the Taqman Gene Expression Assay (PKD1 probe: Mm00465434_m1; GAPDH probe: Mm99999915_g1; Applied Biosystems).
Histology and Ki67 Immunostaining
Pkd1 KO mice were euthanized at 1, 2, and 3 months postdoxycycline treatment. Kidneys were fixed in 10% formaldehyde overnight and embedded in paraffin, and 5-μm sections were obtained; kidneys were flushed with PBS prior to fixation for inflammatory cell staining studies. Hematoxylin and eosin staining was performed. Deparaffinized and rehydrated tissue sections were treated with sodium citrate (pH 6.0), washed, and blocked with 1% BSA in PBS for 1 hour followed by overnight incubation with primary antibody against Ki67, CD3, and F4/80 (Supplemental Table 1) at 4°C. Tissues were washed and incubated with secondary antibody (Alexa Fluor 488–conjugated donkey anti-rabbit IgG) for 1 hour at room temperature. Fluorescence images were captured using an Olympus microscope. Positive cells were counted in 30 separate fields from each kidney.
Metabolic Cage Studies
Chronic Dietary Salt Experiments
Mice were fed a normal Na+ diet (0.3% Na+; Micro-Stabilized Rodent Liquid Diet LD101; TestDiet, St. Louis, MO) for 7 days followed by a low Na+ diet (0.03% Na+; TestDiet) for 7 days and then, a high Na+ diet (3.2% Na+; TestDiet LD101 with added NaCl) for 7 days. On day 2 of normal and high Na+ diets, blood was collected for determination of plasma renin concentration (PRC) and plasma electrolytes. PRC was measured using an angiotensin-I enzyme immunoassay kit (Peninsula, San Carlos, CA). Plasma electrolytes, hemoglobin, and hematocrit were determined using an i-STAT EC8+ cartridge (Abbott, Chicago, IL) and by the University of Utah Pathology Core Laboratory.
Daily urine samples were collected using metabolic cages and centrifuged at 15,000 rpm for 15 minutes, and supernatants were stored at −80°C. Urinary Na+ and K+ were measured using the EasyVet analyzer (Medica, Bedford, MA). Urine osmolality was measured using an Osmett II (Precision System, Natick, MA). Urinary nitrite and nitrate (NOx), endothelin-1 (ET-1), PGE2, NE, epinephrine, prostacyclin, and kidney injury molecule-1 (KIM-1) excretion were determined during normal Na+ intake and after 2 days of high Na+ intake. Urine NOx was analyzed using the nitrate/nitrite colorimetric assay kit (780001; Cayman Chemical, Ann Arbor, MI). Urine ET-1 was assayed in acidified samples applied to activated SPE (C-18) cartridges (WAT023590; Waters, Milford, MA), eluted with methanol/0.05 M ammonium bicarbonate (80/20 vol/vol), and measured using the Quantikine enzyme immunoassay kit (DET100; R&D Systems, Minneapolis, MN). Enzyme immunoassays were used for determination of urinary PGE2 (514010; Cayman Chemical), catecholamines (KA1877; Abnova, Walnut, CA), prostacyclin (ADI-900–025; Enzo, Farmingdale, NY), and KIM-1 (ab213477; Abcam, Cambridge, MA).
Acute Salt Loading
Control and Pkd1 KO mice were given 1.5 ml saline intraperitoneally after fasting overnight and then placed in metabolic cages without food and water. Urine was collected hourly for 7 hours. Urinary Na+ and K+ were determined as above.
BP Determination
Mice were anesthetized with 2% isoflurane, implanted with radio transmitters with the catheter in the carotid artery, and allowed 5 days recovery. Mice were fed normal (4 days), then low (4 days), and high Na+ diets (8 days). BP was recorded by telemetry (TA11-PAC10; Data Sciences International, St. Paul, MN). Mice were not disturbed during the BP recording period. BP readings were taken every 10 minutes throughout the day, and the average of the entire day’s values was used for each data point. In separate studies, vehicle (DMSO) or NS-398 in DMSO (5 mg/kg body wt; Cayman Chemical) was administered to Pkd1 KO mice with radiotelemetric BP transmitters by gel diet once daily for 5 days of a normal salt diet followed by 7 days of a high salt diet.
GFR Measurement
GFR was measured at baseline and after 2 days of high salt intake. Mice were injected retro-orbitally with FITC-sinistrin (7.5 mg/100 g body wt; Mannheim Pharma and Diagnostics, Mannheim, Germany). The NIC-Kidney (Mannheim Pharma and Diagnostics) was used to detect fluorescence in the skin on the shaved back over 1 hour. GFR was calculated on the basis of the kinetics of fluorescence decay.
Na+/K+ ATPase Activity
After 2 days of a high salt diet, mice were euthanized, and cortex and outer and inner medulla were collected. Tissues were homogenized in ATPase assay buffer, and Na+/K+ ATPase (NKA) activity was measured using a commercially available kit (ab234055; Abcam).
Western Analyses
Whole kidneys were weighed; then, they were homogenized, and protein isolation and immunoblotting were performed as previously described.9 Samples were homogenized in ice cold buffer containing 250 mM sucrose, 10 mM triethanolamine (pH 7.6) with 100 μg/ml PMSF, 200 mM sodium orthovanadate, 200 mM sodium fluoride, and 1 mg/ml leupeptin. Total protein concentration was measured using the bicinchoninic acid protein assay kit (Pierce, Waltham, MA). Samples were diluted with Laemmli buffer, heated at 65°C for 15 minutes, and stored at −80°C in aliquots to avoid repeated freeze/thaw. Proteins were separated using a 4%–12% bis-Tris minigel (Invitrogen, Carlsbad, CA) and transferred onto a polyvinylidene difluoride membrane. Membranes were blocked with 5% nonfat dry milk in Tris buffered saline with Tween for 1 hour at room temperature. Membrane was incubated with specific primary antibodies overnight at 4°C. After washing with Tris buffered saline with Tween, membranes were incubated with horseradish peroxidase–conjugated secondary antibodies for 1 hour at room temperature.
Primary antibodies were as follows (Supplemental Table 1): aquaporin-2 (AQP-2), β-actin, cyclooxygenase-1 (COX-1), COX-2, cystic fibrosis transmembrane receptor (CFTR), cytoplasmic phospholipase A2, epithelial Na+ channel-α (ENaC-α), ENaC-β, ENaC-γ, NKA-α, NKA-β, GAPDH, total and phosphorylated Na+/H+ exchanger 3, total and phosphorylated (T53) NCC, and total and phosphorylated (S126) and (T96/101) NKCC2. Secondary horseradish peroxidase–conjugated antibodies were goat anti-mouse IgG (1:2000; Abcam), goat anti-rabbit IgG (1:2000), and rabbit anti-goat (1:2000). Horseradish peroxidase was visualized using the Advance ECL System (GE Healthcare, Piscataway, NJ). Images were obtained and quantified by ImageLab (Bio-Rad, Hercules, CA). All antibodies were initially tested for linearity by loading 1, 2.5, 5, and 10 µg of protein; linear results were obtained for all antibodies between 2.5 and 10 µg, and therefore, 5 µg of protein was loaded into each lane for all experiments. Normalizing to β-actin or GAPDH was performed.
Statistical Analyses
Specific experiment sample sizes are indicated in the figures. The t test was used to compare differences in continuous parameters on the same day between genotypes (protein expression). Two-way ANOVA was used to compare differences between control and Pkd1 KO mice in PRC; GFR; serum chemistries; and urine KIM-1, NOx, catecholamine, PGI2, PGE2, and ET-1 excretion using genotype and treatment as model terms. Heart rate, BP, and chronic Na+ and K+ excretion were assessed by two-way repeated measures ANOVA with Scheffe post hoc test using genotype and treatment as model terms. An interaction term was included in these models. Acute saline loading studies were analyzed by a primary-secondary approach to control for multiplicity; a single comparison using a single two-sample t test (2-hour time point) was selected to test the hypothesis, and therefore, there are no multiple comparisons to adjust for.12 The other comparisons at each of the other six time points are secondary, being done in a descriptive fashion to describe the natural history of Na+ excretion in the mouse models. ANOVA or multiple comparisons adjustment would assume testing a global hypothesis that the mice differ over all 7 hours; changing patterns of excretion could cancel out differences. All analyses were performed using GraphPad Prism 8 software. The criterion for significance was P=0.05. Note that the study was not powered to detect differences between sexes; given the magnitude of the expected and initially measured responses, the number of animals required to conduct such analysis (at least 12 per sex per genotype) would have been prohibitive.
Results
Confirmation of Noncystogenic Pkd1 KO Model
Pkd1 KO mice manifested Pkd1 gene recombination in kidney, liver, and stomach (Figure 1B). Kidney and liver recombination was expected; however, stomach recombination was not.11 Kidney Pkd1 mRNA was reduced by approximately 50% in Pkd1 KO mice (Figure 1C); this result was not unexpected because non-nephron renal cell types (endothelial cells) also express polycystin-1.11 Kidneys from Pkd1 KO mice 1 and 3 months after doxycycline administration (4 and 6 months of age) did not manifest cysts or dilated tubules (Figure 1D). Immunostaining for Ki67, a marker of cell proliferation, showed only rare immunopositive cells (less than two per high-powered field) in control and Pkd1 KO mice up to 3 months after doxycycline administration (data not shown). Body and kidney weights were similar between control and Pkd1 KO mice (regardless of dietary salt intake) (Figure 1, E and F). Urinary KIM-1 excretion was increased in Pkd1 KO mice (regardless of dietary salt intake) (Figure 1G). No significant lymphocyte (CD3) or macrophage (F4/80) infiltration was observed in control or Pkd1 KO mice regardless of dietary salt intake (normal-appearing kidneys; therefore, images are not shown). Mice aged 9–12 months developed enlarged kidneys renal cysts (images not shown). All subsequent studies were conducted in Pkd1 KO mice <3 months postdoxycycline and age-matched controls.
Effect of Pkd1 KO on BP and Renal Function
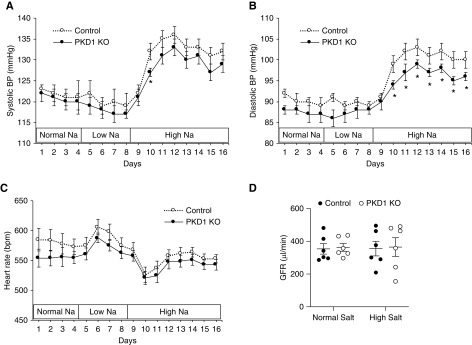
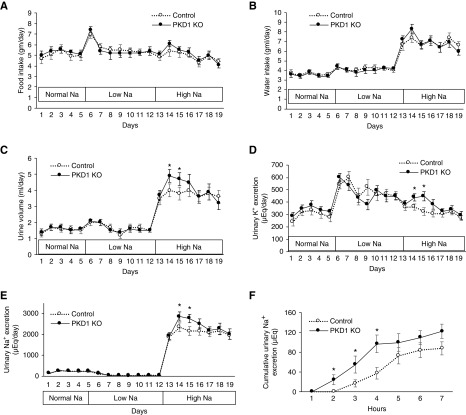
Pkd1 KO did not affect BP or heart rate in mice fed a normal or low Na+ diet (Figure 2, A–C). In contrast, Pkd1 KO had reduced diastolic and modestly reduced systolic BP without changes in heart rate during high Na+ feeding (Figure 2, A–C). Food and water intakes were similar between Pkd1 KO and control mice during normal, low, and high Na+ diets (Figure 3, A and B); however, urine volume and urinary excretion of Na+ and K+ were increased during days 2 and 3 of high Na+ intake (Figure 3, C–E). Urine osmolality was similar between Pkd1 KO and control mice on normal or high salt diets (Table 1). Serum chemistries, hemoglobin, and hematocrit were not different between Pkd1 KO and control mice during normal or high salt intake (Table 1). Similar to the chronic Na+ loading studies, acute administration of normal saline during normal salt intake elicited a more rapid urinary Na+ (Figure 3E) and K+ (data not shown) excretory response in Pkd1 KO compared with control mice (Figure 3F). Notably, Pkd1 KO did not alter GFR during normal or high Na+ intake (Figure 2D). No differences were seen between male and female Pkd1 mice or between male and female control mice with respect to the above parameters.
Figure 2.
Nephron Pkd1 KO reduces blood pressue when fed a high salt diet. (A) Systolic and (B) diastolic arterial pressure and (C) heart rate in control and Pkd1 KO mice were determined on a normal Na+ diet for 4 days, a low Na+ diet for 4 days, and a high Na+ diet for 8 days; n=11 each data point. (D) shows GFR in Pkd1 KO and control mice after 2 days on a normal diet and a high salt diet (n=6 each data point). *P=0.05 KO versus control on the same day.
Figure 3.
Nephron Pkd1 KO increases urine volume and Na+ and K+ excretion during high salt administration. Illustrated are (A) food and (B) water intake, (C) urine volume, (D) urine K+ excretion, and (E) urine Na+ excretion; n=16 each data point. *P=0.05 KO versus control on the same day. (F) shows the effect of an acute 1.5-ml intraperitoneal saline injection on cumulative urinary Na+ excretion over the ensuing 7 hours (given to mice during normal salt intake); n=11 each data point. *P=0.05 KO versus control at the same time point.
Table 1.
Urine osmolality and plasma chemistries, hemoglobin, and hematocrit in control and Pkd1 KO mice on normal and high salt intake (day 2)
| Parameter | Normal Salt | High Salt | ||
|---|---|---|---|---|
| Control, n=5 | KO, n=6 | Control, n=5 | KO, n=6 | |
| Plasma | ||||
| Na+, meq/L | 147±1 | 145±1 | 145±1 | 147±1 |
| K+, meq/L | 4.5±0.2 | 4.6±0.3 | 5.2±0.2 | 5.0±0.2 |
| Cl−, meq/L | 116±1 | 115±1 | 117±1 | 117±1 |
| BUN, mg/dl | 22±2 | 15±1 | 17±1 | 14±1 |
| Glucose, mg/dl | 194±8 | 190±8 | 214±14 | 213±5 |
| HCO3−, meq/L | 19±1 | 20±1 | 20±1 | 20±2 |
| Calcium, mg/dl | ND | ND | 9.0±0.2 | 9.0±0.2 |
| Magnesium, mg/dl | ND | ND | 2.0±0.1 | 1.9±0.1 |
| Phosphate, mg/dl | ND | ND | 6.3±0.5 | 6.5±0.5 |
| pH | 7.33±0.01 | 7.34±0.02 | 7.35±0.03 | 7.37±0.03 |
| pCO2, mm Hg | 35±2 | 37±3 | 35±3 | 32±4 |
| Hemoglobin, g/dl | 15.4±0.4 | 14.5±0.4 | 14.7±0.7 | 13.7±0.6 |
| Hematocrit, % | 46±2 | 43±1 | 41±2 | 39±2 |
| Urine | ||||
| n | 10 | 10 | 9 | 10 |
| Osmolality, mOsm | 2870±193 | 2891±175 | 2385±233 | 2460±151 |
ND, not determined.
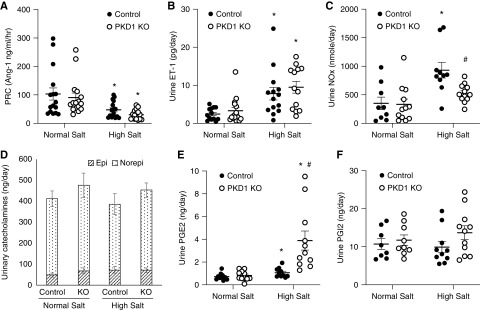
A high Na+ diet reduced PRC from normal Na+ intake levels to a similar extent in Pkd1 KO and controls (Figure 4A). Urinary ET-1 excretion was increased by salt loading compared with normal Na+ intake to a similar extent in Pkd1 KO and control mice (Figure 4B). Urinary NOx excretion approximately doubled in control mice fed a high Na+ diet compared with normal Na+ intake; however, high salt–induced augmentation of urinary NOx excretion was not observed in Pkd1 KO mice (Figure 4C). Urinary epinephrine and NE excretion were similar between Pkd1 KO and control mice on normal and high salt diets (Figure 4D).
Figure 4.
Effect of normal Na+ and high Na+ intake (day 2 of high Na+ diet) on (A) PRC, (B) urine ET-1 excretion, (C) urine nitrite/nitrate excretion, (D) urinary catecholamines, (E) urine PG E2 excretion, and (F) urine PGI2 excretion in control and Pkd1 KO mice; n=10–16 each data point except n=8 for catecholamines. Epi, epinephrine; Norepi, NE. *P=0.05 high Na+ versus normal Na+ within the same genotype; #P=0.05 KO versus control on the same Na+ intake.
Role of COX-2 in Pkd1 KO–Induced BP Reduction
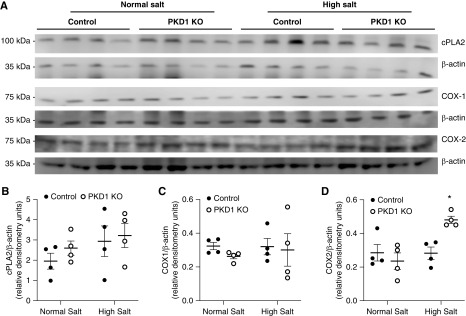
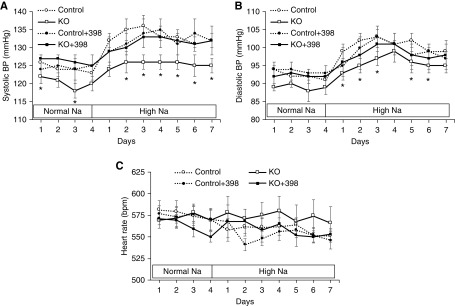
High salt intake increased urinary PGE2 excretion in Pkd1 KO and control mice, but the increase in urinary PGE2 was markedly enhanced in Pkd1 KO mice (Figure 4E). Urinary prostacyclin was not substantially altered by high salt intake, and it was not significantly different between Pkd1 KO and control mice (although it tended to be higher in Pkd1 KO mice on a high salt diet) (Figure 4F). Western analysis of whole kidney revealed that cytoplasmic phospholipase A2 and COX-1 protein levels were similar between Pkd1 KO and control mice fed normal or high Na+ diets (Figure 5, A–C). In contrast, whole-kidney COX-2 protein expression was enhanced in Pkd1 KO compared with control mice during high Na+ feeding (Figure 5D). We were unable to detect renal COX-2 by immunostaining using several different commercially available anti–COX-2 antibodies. To assess the functional significance of the elevated COX-2, Pkd1 KO and control mice were given NS-398, a COX-2 inhibitor, during normal and high salt intake. Systolic BP and diastolic BP were lower in Pkd1 KO mice compared with controls, and this difference was obviated by NS-398 administration; NS-398 did not significantly affect BP in control mice (Figure 6, A and B). No differences in heart rate were observed between any of the groups (Figure 6C).
Figure 5.
Western analysis of cytoplasmic phospholipase A2 (cPLA2), COX-1, and COX-2 in kidneys from control and Pkd1 KO mice fed a normal Na+ and high Na+ (day 2) diet. (A) shows blots, and (B–D) show relative densitometry; n=4 each data point. *P=0.05 KO versus control on the same diet.
Figure 6.
Effect of NS-398 on (A) systolic and (B) diastolic arterial pressure and (C) heart rate in control and Pkd1 KO mice given vehicle or NS-398 on a normal Na+ and high Na+ diet; n=9–10 each data point. *P=0.05 KO versus control on the same day.
Effect of Pkd1 KO on Renal Transporters and Channels
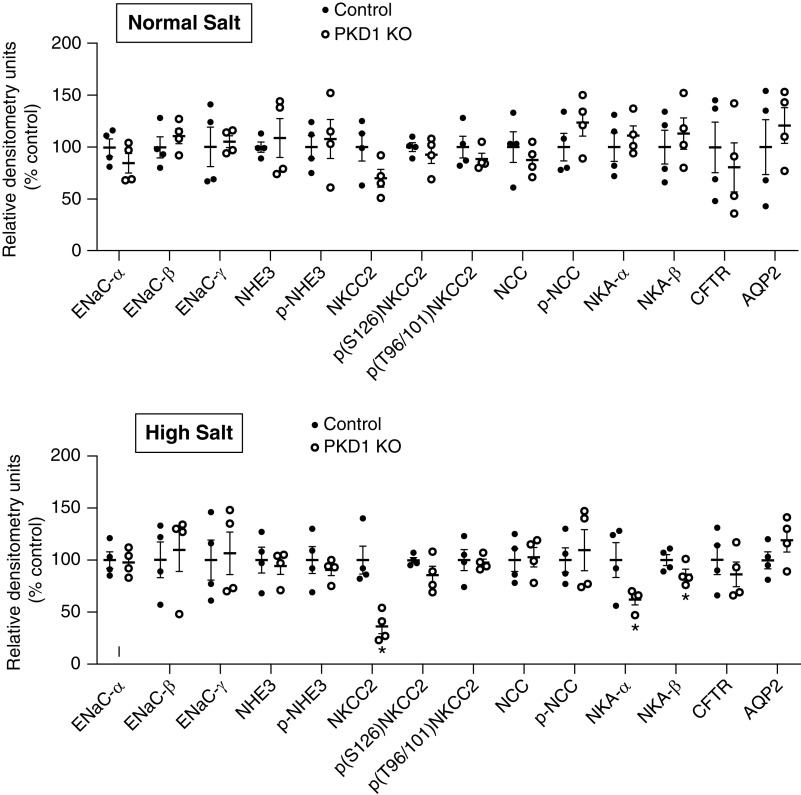
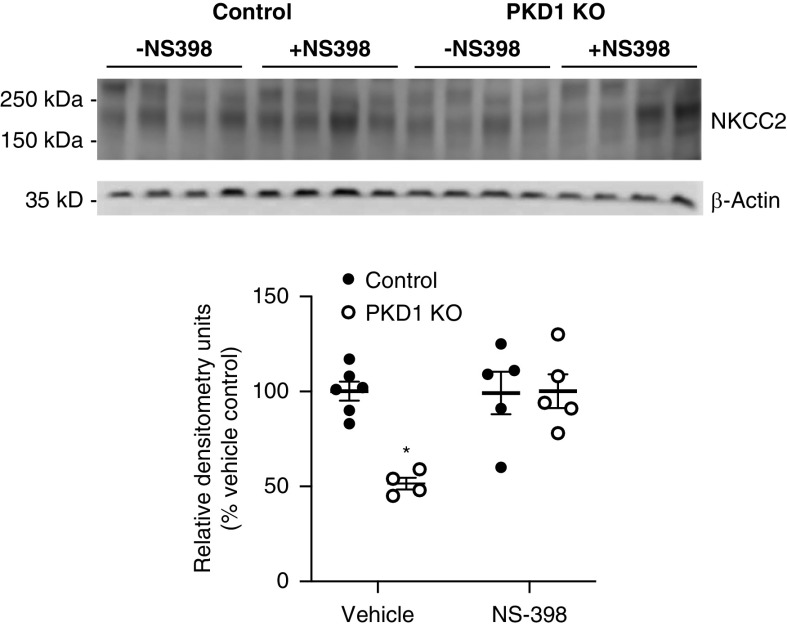
Western analysis of the major kidney Na+ and water transporters and/or channels revealed no differences in ENaC isoforms, Na+/H+ exchanger 3, NCC, NKCC2, CFTR, NKA isoforms, or AQP2 between Pkd1 KO and control mice fed a normal Na+ diet (Figure 7, Supplemental Figure 1). In contrast, Pkd1 KO mice had markedly reduced total NKCC2 together with lower NKA-α and NKA-β during high Na+ feeding compared with control mice (Figure 7, Supplemental Figure 1). No differences were detected in phospho-NKCC2 (S126) or phospho-NKCC2 (T96/101), the major phosphorylated forms of NKCC2,13 between genotypes (Figure 7, Supplemental Figure 1). Because NS-398 normalized the BP differences between high salt–fed Pkd1 KO and control mice, the effect of NS-398 on total NKCC2 was assessed. As shown in Figure 8, NS-398 abolished the reduction in NKCC2 in high salt–fed Pkd1 KO compared with control mice.
Figure 7.
Relative densitometries of transporter and channel abundance in control and Pkd1 KO mice fed a normal Na+ diet (upper panel) or 2 days of a high Na+ diet (lower panel); n=4 per data point. *P=0.05 KO versus control.
Figure 8.
Western blots and relative densitometries of total NKCC2 in control and Pkd1 KO mice fed a high Na+ diet for 2 days and treated with or without NS-398; n=4–6 each data point. *P=0.05 KO versus control same treatment condition.
To determine if NKA activity was decreased and if this occurred in specific kidney regions, renal cortex, outer medulla, and inner medulla ATPase activity was assessed. No difference in ATPase activity between Pkd1 KO and control mice fed a high Na+ diet was seen in any of these regions (Supplemental Figure 2).
Discussion
The major finding in this study was that nephron polycystin-1 deficiency per se does not contribute to the hypertension frequently observed early in the course of ADPKD, even before GFR declines. These findings support the notion, albeit indirectly, that renal cysts, as opposed to loss of polycystin-1, are involved in ADPKD-associated hypertension. Indeed, we observed that nephron polycystin-1 deficiency enhances natriuresis in response to a salt load and mitigates salt-induced BP elevation, suggesting that nephron polycystin-1 may exert an antinatriuretic physiologic effect. Although not examined in this study, it would be of interest to determine how nephron polycystin-1 deficiency affects BP in other pathophysiologic conditions, including those characterized by activation of the renin-angiotensin-aldosterone system, decreased nitric oxide bioavailability, and/or increased sympathetic tone.
The key to making these observations was the nature of the mouse model wherein induction of nephron Pkd1 gene KO at 3 months of age did not elicit cystogenesis for at least 6 months afterward. Embryonic Pkd1 gene KO causes massive cystogenesis and early postnatal death, even if only collecting duct principal cells are targeted.14 Embryonic Pkd1 gene targeting with a nestin promoter-Cre, which has relatively modest kidney activity, caused hypertension in Pkd1 KO mice at only 5 weeks of age; however, cysts comprised approximately 9% of kidney area at this age.15 To better understand the effect of timing of polycystin-1 loss on cystogenesis, Piontek et al.10 induced Pkd1 gene KO using a ubiquitous tamoxifen-induced Cre expresser at 13 days postnatal and observed severe cystic kidneys 3 weeks later; in contrast, Pkd1 gene inactivation at day 14 or later did not cause renal cysts until 5 months of age. Another group using a tamoxifen-inducible Ksp-Cre approach found that Pkd1 gene targeting at 4 days postnatal caused pronounced cyst formation by 1 month of age, whereas Pkd1 gene KO at 3–6 months of age caused a very mild renal cystic phenotype with approximately ten microscopic cysts per cross-section 3 months later.16 Likely on the basis of these studies and as previously discussed, Verschuren et al.8 induced Pkd1 gene KO at 18–20 days postnatal using tamoxifen-inducible Ksp-Cre but unfortunately observed significant increases in kidney weight, cell proliferation, cystic index, and dilated tubules when the kidneys were studied 3–4 weeks later. We did observe an increase in urinary KIM-1 excretion in Pkd1 KO mice within 3 months of gene disruption, raising the possibility that the observed phenotype was related, at least in part, to kidney injury. However, no other evidence of kidney dysfunction (inflammation, dilated tubules, hyperproliferation, reduced GFR, or generalized alterations in sodium transporters) was observed. Hence, taken together, our model of whole-nephron Pkd1 gene targeting at 3 months of age resolved the problem of cystogenesis and allowed determination of the direct effect of nephron polycystin-1 deficiency on renal function and BP.
The enhanced natriuretic response to salt loading observed in Pkd1 KO mice was associated with a marked reduction in NKCC2 protein levels. The reasons for concomitant lack of reduction of phospho-NKCC2 (S126) or phospho-NKCC2 (T96/101) in Pkd1 KO mice are unclear; however, it is possible that relative phosphorylation of NKCC2 is upregulated in response to decreased total NKCC2 expression. It is also notable that total and phosphorylated NKCC2 can be regulated in opposite directions.17 Furthermore, although reduced NKCC2 was associated with lower BP in Pkd1 KO mice and was normalized on treatment with NS-398, these studies do not prove that NKCC2 is responsible for the enhanced natriuresis or lower BP in response to salt loading. It is difficult to compare these findings with previous studies that examined either cells transfected with polycystin-1 or cells obtained from cystic kidneys; these studies focused on cysts derived from the distal nephron, examining ENaC and CFTR. Cystic epithelium, albeit largely from models of autosomal recessive polycystic kidney disease, has been reported to have either reduced4,5,18 or increased6 ENaC expression and/or activity. CFTR is likely involved in cyst fluid accumulation; transfecting polycystin-1 into mouse collecting duct cells prevents vasopressin-stimulated CFTR expression and activity.19 In contrast, we observed no evidence that CFTR, at least at the protein expression level, was involved in the Pkd1 KO enhanced natriuretic phenotype.
Mice with Pkd1 KO had moderately reduced renal NKA protein expression but no change in NKA activity. A previous study using CHO and MDCK cells found that the C-terminal tail of polycystin-1 interacts with the NKA-α subunit and increases NKA activity without altering pump protein expression.7 Hence, the possibility remains that polycystin-1 regulates nephron NKA in vivo; however, this study did not find convincing evidence in support of this.
Nephron Pkd1 KO abolished high salt–induced increases in urine NOx excretion. Enhanced tubule luminal fluid flow has been shown to stimulate NO production by thick ascending limb (TAL), macula densa, and collecting duct associated with increased urinary NOx excretion.20 Furthermore, although not examined in renal tubule cells, polycystin-1 was found to mediate fluid shear stress–induced nitric oxide (NO) production in endothelial cells.21 Taken together, these findings raise the possibility that nephron polycystin-1 is required for high salt–induced (possibly via increased tubule flow) NO production under physiologic conditions. Because nephron NO acts as a natriuretic factor, the failure to increase NO in Pkd1 KO mice should promote salt retention, suggesting that other mechanisms are responsible for the observed nephron Pkd1 KO phenotype.
A striking observation was the marked increase in urinary PGE2 excretion in Pkd1 KO mice in response to high salt intake. This observation together with the findings that renal COX-2 expression was increased and COX-2 inhibition abolished the BP differences between control and Pkd1 KO mice suggests that polycystin-1 deficiency via COX-2–derived PGE2 plays a role in mitigating salt retention and BP elevation in response to salt loading. Previous studies support the notion that renal PGE2 is increased in cystic kidney disease, albeit examined primarily after cysts had formed. Han:SPRD-cy rats exhibit increased renal PGE2 and COX activities, whereas inhibition of COX-2 slowed disease progression and reduced urinary PGE2 excretion in Han:SPRD-cy rats and polycystin-2–deficient mice.22–24 Interestingly, serum PGE2 levels are markedly elevated in patients with ADPKD.25 In ADPKD renal tubule cells, PGE2 stimulates proliferation, cyst formation, and chloride secretion26,27; no studies have examined renal PGE2 actions in cystic kidney disease models prior to cyst formation. A key remaining question is how polycystin-1 deficiency promotes renal COX-2 activation and ensuing PGE2 production. Another interesting question is whether urinary PGE2 excretion, possibly in the setting of high salt intake, could be a marker of nephron Pkd1 gene disruption even prior to renal cyst formation and/or hypertension.
PGE2 has been demonstrated to inhibit TAL Na+ transport pathways. TAL abundantly expresses COX-2,28,29 whereas PGE2 reduces NKCC2 protein abundance in mouse TAL cells.30 Our finding that NS-398 prevents the reduction in NKCC2 in high salt–fed Pkd1 KO mice supports the notion that PGE2 could play a role in lowering BP in Pkd1 KO mice through inhibition of NKCC2. Notably, PGE2 is also well described to inhibit NKA activity in kidney cells, including TAL31; however, as mentioned above, this does not seem to play a key role in our Pkd1 KO model.
In summary, our findings suggest that nephron polycystin-1 deficiency does not in itself cause hypertension independent of cystogenesis. It is still possible that non-nephron renal cell types (e.g., vasculature with impaired endothelial-dependent vasorelaxation2,3) play a role in hypertension development in ADPKD in the absence of cysts. However, it is notable that patients with ADPKD and hypertension prior to renal functional deterioration have more renal cystic involvement (greater kidney volume) than normotensive patients with ADPKD, even after adjusting for age, sex, body surface area, and serum creatinine concentration32; this supports the notion that renal cysts may be of primary importance in ADPKD-related hypertension. Finally, this study provides, at least to our knowledge, the first in vivo evidence for a physiologic role of polycystin-1 in regulating renal Na+ transport and BP independent of cystogenesis.
Disclosures
Dr. Genzen reports other from Fujirebio Diagnostics outside the submitted work. All remaining authors have nothing to disclose.
Funding
This research was supported by funding from National Heart, Lung, and Blood Institute grant P01 HL136267 (to Dr. Kohan).
Supplementary Material
Acknowledgments
Dr. Gao, Dr. Kohan, Dr. Lakshmipathi, and Dr. Ramkumar designed the study; Dr. Genzen, Dr. Gao, Dr. Hu, Dr. Lakshmipathi, and Dr. Stuart carried out the experiments; Dr. Gao, Dr. Kohan, Dr. Lakshmipathi, and Dr. Ramkumar analyzed the data; Dr. Gao, Dr. Kohan, and Dr. Lakshmipathi made the figures; Dr. Kohan, Dr. Lakshmipathi, and Dr. Ramkumar drafted and revised the papers; Dr. Genzen, Dr. Gao, Dr. Hu, Dr. Kohan, Dr. Lakshmipathi, Dr. Ramkumar, and Dr. Stuart approved the final version of the manuscript.
Footnotes
Published online ahead of print. Publication date available at www.jasn.org.
Supplemental Material
This article contains the following supplemental material online at http://jasn.asnjournals.org/lookup/suppl/doi:10.1681/ASN.ASN.2019090934/-/DCSupplemental.
Supplemental Figure 1. Western blots of transporters and channels in control and Pkd1 knockout mice.
Supplemental Figure 2. Na+/K+ ATPase activity in kidney from control and Pkd1 knockout mice.
Supplemental Table 1. Primary antibodies used for western analysis and immunofluorescence staining.
References
- 1.Bell PE, Hossack KF, Gabow PA, Durr JA, Johnson AM, Schrier RW: Hypertension in autosomal dominant polycystic kidney disease. Kidney Int 34: 683–690, 1988 [DOI] [PubMed] [Google Scholar]
- 2.Chapman AB, Stepniakowski K, Rahbari-Oskoui F: Hypertension in autosomal dominant polycystic kidney disease. Adv Chronic Kidney Dis 17: 153–163, 2010 [DOI] [PMC free article] [PubMed] [Google Scholar]
- 3.Helal I, Al-Rowaie F, Abderrahim E, Kheder A: Update on pathogenesis, management, and treatment of hypertension in autosomal dominant polycystic kidney disease. Saudi J Kidney Dis Transpl 28: 253–260, 2017 [DOI] [PubMed] [Google Scholar]
- 4.Arkhipov SN, Pavlov TS: ATP release into ADPKD cysts via pannexin-1/P2X7 channels decreases ENaC activity. Biochem Biophys Res Commun 513: 166–171, 2019 [DOI] [PMC free article] [PubMed] [Google Scholar]
- 5.Pavlov TS, Levchenko V, Ilatovskaya DV, Palygin O, Staruschenko A: Impaired epithelial Na+ channel activity contributes to cystogenesis and development of autosomal recessive polycystic kidney disease in PCK rats. Pediatr Res 77: 64–69, 2015 [DOI] [PMC free article] [PubMed] [Google Scholar]
- 6.Rohatgi R, Greenberg A, Burrow CR, Wilson PD, Satlin LM: Na transport in autosomal recessive polycystic kidney disease (ARPKD) cyst lining epithelial cells. J Am Soc Nephrol 14: 827–836, 2003 [DOI] [PubMed] [Google Scholar]
- 7.Zatti A, Chauvet V, Rajendran V, Kimura T, Pagel P, Caplan MJ: The C-terminal tail of the polycystin-1 protein interacts with the Na,K-ATPase alpha-subunit. Mol Biol Cell 16: 5087–5093, 2005 [DOI] [PMC free article] [PubMed] [Google Scholar]
- 8.Verschuren EHJ, Mohammed SG, Leonhard WN, Overmars-Bos C, Veraar K, Hoenderop JGJ, et al.: Polycystin-1 dysfunction impairs electrolyte and water handling in a renal precystic mouse model for ADPKD. Am J Physiol Renal Physiol 315: F537–F546, 2018 [DOI] [PubMed] [Google Scholar]
- 9.Gao Y, Stuart D, Takahishi T, Kohan DE: Nephron-specific disruption of nitric oxide synthase 3 causes hypertension and impaired salt excretion. J Am Heart Assoc 7: e009236, 2018 [DOI] [PMC free article] [PubMed] [Google Scholar]
- 10.Piontek KB, Huso DL, Grinberg A, Liu L, Bedja D, Zhao H, et al.: A functional floxed allele of Pkd1 that can be conditionally inactivated in vivo. J Am Soc Nephrol 15: 3035–3043, 2004 [DOI] [PubMed] [Google Scholar]
- 11.Traykova-Brauch M, Schönig K, Greiner O, Miloud T, Jauch A, Bode M, et al.: An efficient and versatile system for acute and chronic modulation of renal tubular function in transgenic mice. Nat Med 14: 979–984, 2008 [DOI] [PMC free article] [PubMed] [Google Scholar]
- 12.Bender R, Lange S: Adjusting for multiple testing--when and how? J Clin Epidemiol 54: 343–349, 2001 [DOI] [PubMed] [Google Scholar]
- 13.Caceres PS, Ortiz PA: Molecular regulation of NKCC2 in blood pressure control and hypertension. Curr Opin Nephrol Hypertens 28: 474–480, 2019 [DOI] [PMC free article] [PubMed] [Google Scholar]
- 14.Raphael KL, Strait KA, Stricklett PK, Miller RL, Nelson RD, Piontek KB, et al.: Inactivation of Pkd1 in principal cells causes a more severe cystic kidney disease than in intercalated cells. Kidney Int 75: 626–633, 2009 [DOI] [PMC free article] [PubMed] [Google Scholar]
- 15.Fonseca JM, Bastos AP, Amaral AG, Sousa MF, Souza LE, Malheiros DM, et al.: Renal cyst growth is the main determinant for hypertension and concentrating deficit in Pkd1-deficient mice. Kidney Int 85: 1137–1150, 2014 [DOI] [PMC free article] [PubMed] [Google Scholar]
- 16.Lantinga-van Leeuwen IS, Leonhard WN, van der Wal A, Breuning MH, de Heer E, Peters DJ: Kidney-specific inactivation of the Pkd1 gene induces rapid cyst formation in developing kidneys and a slow onset of disease in adult mice. Hum Mol Genet 16: 3188–3196, 2007 [DOI] [PubMed] [Google Scholar]
- 17.Yang L, Xu S, Guo X, Uchida S, Weinstein AM, Wang T, et al.: Regulation of renal Na transporters in response to dietary K. Am J Physiol Renal Physiol 315: F1032–F1041, 2018 [DOI] [PMC free article] [PubMed] [Google Scholar]
- 18.Ilatovskaya DV, Levchenko V, Pavlov TS, Isaeva E, Klemens CA, Johnson J, et al.: Salt-deficient diet exacerbates cystogenesis in ARPKD via epithelial sodium channel (ENaC). EBioMedicine 40: 663–674, 2019 [DOI] [PMC free article] [PubMed] [Google Scholar]
- 19.de Lemos Barbosa CM, Souza-Menezes J, Amaral AG, Onuchic LF, Cebotaru L, Guggino WB, et al.: Regulation of CFTR expression and arginine vasopressin activity are dependent on polycystin-1 in kidney-derived cells. Cell Physiol Biochem 38: 28–39, 2016 [DOI] [PubMed] [Google Scholar]
- 20.Cabral PD, Garvin JL: Luminal flow regulates NO and O2(-) along the nephron. Am J Physiol Renal Physiol 300: F1047–F1053, 2011 [DOI] [PMC free article] [PubMed] [Google Scholar]
- 21.Nauli SM, Kawanabe Y, Kaminski JJ, Pearce WJ, Ingber DE, Zhou J: Endothelial cilia are fluid shear sensors that regulate calcium signaling and nitric oxide production through polycystin-1. Circulation 117: 1161–1171, 2008 [DOI] [PMC free article] [PubMed] [Google Scholar]
- 22.Peng CY, Sankaran D, Ogborn MR, Aukema HM: Dietary soy protein selectively reduces renal prostanoids and cyclooxygenases in polycystic kidney disease. Exp Biol Med (Maywood) 234: 737–743, 2009 [DOI] [PubMed] [Google Scholar]
- 23.Sankaran D, Bankovic-Calic N, Ogborn MR, Crow G, Aukema HM: Selective COX-2 inhibition markedly slows disease progression and attenuates altered prostanoid production in Han:SPRD-cy rats with inherited kidney disease. Am J Physiol Renal Physiol 293: F821–F830, 2007 [DOI] [PubMed] [Google Scholar]
- 24.Monirujjaman M, Aukema HM: Cyclooxygenase 2 inhibition slows disease progression and improves the altered renal lipid mediator profile in the Pkd2WS25/- mouse model of autosomal dominant polycystic kidney disease. J Nephrol 32: 401–409, 2019 [DOI] [PubMed] [Google Scholar]
- 25.Klawitter J, Reed-Gitomer BY, McFann K, Pennington A, Klawitter J, Abebe KZ, et al.: Endothelial dysfunction and oxidative stress in polycystic kidney disease. Am J Physiol Renal Physiol 307: F1198–F1206, 2014 [DOI] [PMC free article] [PubMed] [Google Scholar]
- 26.Elberg G, Elberg D, Lewis TV, Guruswamy S, Chen L, Logan CJ, et al.: EP2 receptor mediates PGE2-induced cystogenesis of human renal epithelial cells. Am J Physiol Renal Physiol 293: F1622–F1632, 2007 [DOI] [PubMed] [Google Scholar]
- 27.Liu Y, Rajagopal M, Lee K, Battini L, Flores D, Gusella GL, et al.: Prostaglandin E(2) mediates proliferation and chloride secretion in ADPKD cystic renal epithelia. Am J Physiol Renal Physiol 303: F1425–F1434, 2012 [DOI] [PMC free article] [PubMed] [Google Scholar]
- 28.Câmpean V, Theilig F, Paliege A, Breyer M, Bachmann S: Key enzymes for renal prostaglandin synthesis: Site-specific expression in rodent kidney (rat, mouse). Am J Physiol Renal Physiol 285: F19–F32, 2003 [DOI] [PubMed] [Google Scholar]
- 29.Hao S, Hernandez A, Quiroz-Munoz M, Cespedes C, Vio CP, Ferreri NR: PGE(2) EP(3) receptor downregulates COX-2 expression in the medullary thick ascending limb induced by hypertonic NaCl. Am J Physiol Renal Physiol 307: F736–F746, 2014 [DOI] [PubMed] [Google Scholar]
- 30.Kaji DM, Chase HS Jr., Eng JP, Diaz J: Prostaglandin E2 inhibits Na-K-2Cl cotransport in medullary thick ascending limb cells. Am J Physiol 271: C354–C361, 1996 [DOI] [PubMed] [Google Scholar]
- 31.Wald H, Scherzer P, Rubinger D, Popovtzer MM: Effect of indomethacin in vivo and PGE2 in vitro on MTAL Na-K-ATPase of the rat kidney. Pflugers Arch 415: 648–650, 1990 [DOI] [PubMed] [Google Scholar]
- 32.Gabow PA, Chapman AB, Johnson AM, Tangel DJ, Duley IT, Kaehny WD, et al.: Renal structure and hypertension in autosomal dominant polycystic kidney disease. Kidney Int 38: 1177–1180, 1990 [DOI] [PubMed] [Google Scholar]
Associated Data
This section collects any data citations, data availability statements, or supplementary materials included in this article.


