

Applying digital PCR (dPCR) technology to challenging clinical and industrial detection tasks has become more prevalent because of its capability for absolute quantification and rare target detection. However, practices learned from quantitative PCR (qPCR) that promote assay robustness and wide-ranging utility are not readily applied in dPCR. These include internal amplification controls to account for false-negative reactions and amplicon high-resolution melt (HRM) analysis to distinguish true positives from false positives.
KEYWORDS: dPCR, high-resolution melt, internal control
ABSTRACT
Applying digital PCR (dPCR) technology to challenging clinical and industrial detection tasks has become more prevalent because of its capability for absolute quantification and rare target detection. However, practices learned from quantitative PCR (qPCR) that promote assay robustness and wide-ranging utility are not readily applied in dPCR. These include internal amplification controls to account for false-negative reactions and amplicon high-resolution melt (HRM) analysis to distinguish true positives from false positives. Incorporation of internal amplification controls in dPCR is challenging because of the limited fluorescence channels available on most machines, and the application of HRM analysis is hindered by the separation of heating and imaging functions on most dPCR systems. We use a custom digital HRM platform to assess the utility of HRM-based approaches for mitigation of false positives and false negatives in dPCR. We show that detection of an exogenous internal control using dHRM analysis reduces the inclusion of false-negative partitions, changing the calculated DNA concentration up to 52%. The integration of dHRM analysis enables classification of partitions that would otherwise be considered ambiguous “rain,” which accounts for up to ∼3% and ∼10% of partitions in intercalating dye and hydrolysis probe dPCR, respectively. We focused on developing an internal control method that would be compatible with broad-based microbial detection in dPCR-dHRM. Our approach can be applied to a number of DNA detection methods including microbial profiling and may advance the utility of dPCR in clinical applications where accurate quantification is imperative.
INTRODUCTION
Clinical diagnostics, husbandry, food safety, forensics, military/defense, research, and a broad array of other disciplines benefit from quantitative DNA genotyping methods (1–3). The current standard of practice for DNA genotyping relies on quantitative PCR (qPCR), where amplification of a target sequence is detected by the binding and hydrolysis of a sequence-specific oligonucleotide probe, e.g., TaqMan, which emits fluorescence. Quantification is accomplished by comparison to a standard curve (4). Digital PCR (dPCR) using hydrolysis probes or generic double-stranded DNA (dsDNA)-intercalating dye is emerging as a promising alternative to qPCR since it allows for increased precision at low target concentrations and absolute quantification by simple summation of positive and negative endpoint reactions and fitting to a Poisson distribution (5, 6). Clinical diagnostics for infectious diseases in vulnerable populations would especially benefit from this technology, where low bacterial loads would confound standard blood culture tests. A study from 2018 showed that the bacterial load in culture-positive and culture-negative neonatal sepsis ranges from 1 to 120 CFU/ml in the majority of the population studied (7). However, the increased precision that dPCR offers has not yet been assessed in a clinical setting (8). Several techniques that improve the performance of qPCR by limiting false-positive and false-negative detection by hydrolysis probes and intercalating dyes are not readily applied in dPCR. The inclusion of these techniques to improve confidence in dPCR quantification may allow for more readily adopted clinical practices in cases where complete blood counts (CBCs) and blood culture are not sufficient for detecting infectious agents.
An example of a qPCR performance improvement is the use of an internal amplification control designed to prevent false negatives. An internal control (IC) is a nontarget DNA sequence present in each reaction mixture and is coamplified simultaneously with the target sequence. Without an IC, a negative reaction (no signal) can mean that there was no target sequence present in the reaction mixture or that the reaction was inhibited, resulting in a false-negative call. Reaction inhibition can arise from numerous technical sources of error, including thermal cycling malfunctions, reagent issues, and presence of inhibitory substances in the sample matrix. In qPCR, inclusion of a hydrolysis probe-based IC is now standard practice. However, in dPCR, hydrolysis probe-based ICs are rarely used. This may be because dPCR systems are typically designed with only one or two fluorescence detection channels. In two-channel systems, one channel is typically reserved for a loading control dye that indicates which reaction mixtures received reagents. Even with the availability of another channel, designing an IC that reliably amplifies in all picoliter-volume dPCR reactions without outcompeting single-molecule target amplification is not a trivial task (9–11). Additionally, a number of IC methods have been proposed for qPCR and dPCR detection of specific microbes, but these IC methods are typically reliant on amplification of a different gene or amplification of a nontarget pathogenic organism (12–16). We sought to generate a universal internal control (IC) method that could be used in any low-template concentration, broad-based microbial profiling assay. Therefore, we needed to ensure that our method would not compete with any pathogens (bacterial, fungal, or viral) in order to make it a truly universal IC.
Amplicon melt analysis has been developed as a qPCR technique to overcome false-positive detection. High-resolution melt (HRM) analysis is a well-established technique that is implemented regularly in qPCR assays to distinguish true positives from false positives (17–19). False positives can arise from off-target amplification of contaminating nucleic acids and can affect probe-based detection modalities as well as those relying solely on intercalating dyes (20–22). Amplicon HRM measures the loss of fluorescence of an intercalating dye during dsDNA heating and unwinding. The loss in fluorescence signal as a function of increasing temperature generates a melt curve, which is a sequence-specific signature that can reliably distinguish off-target amplicons from on-target amplicons (20, 21). High-resolution melt analysis can also be used to detect and differentiate multiple targets amplified by universal primers, reducing the requirement for prior knowledge of target sequences in a sample. This can be especially beneficial across clinical settings and populations where different pathogens can cause infection and in cases where novel pathogens could emerge. Careful control of the heating ramp rate enables differences in amplicon length, sequence, and GC content to result in variable fluorescence loss patterns, enabling differentiation of individual target sequences and off target amplicons (23, 24). Even single nucleotide polymorphisms have been detected with this method (25, 26). Machine learning-based melt curve analysis has been used to automatically differentiate a number of different targets. In the case of microbial profiling, over 90 bacterial DNA sequences amplified with universal primers are automatically differentiable by comparing a sample melt curve to a known library (26–28). Since multiple fluorescence channels are not needed for specific pathogens and since libraries of melt curves have already been generated for a number of microbes, multiplexing for polymicrobial infections can more easily be tested in clinical samples.
We have pioneered the development of digital HRM (dHRM) analysis, developing a low-volume, high-throughput melt analysis system and methods (23, 28–30). Here, we used dHRM analysis to test whether the quantitative power of dPCR can be improved for more accurate enumeration of true-negative and true-positive reactions. Amplification and quantification of a target DNA template were directly compared by simultaneous detection using three dPCR modalities: hydrolysis probe, intercalating dye, and dHRM analysis. False positives arising from off-target amplification occurred in both hydrolysis probe-based detection and intercalating dye dPCR, which significantly affected calculations of absolute target number but could be adjudicated using dHRM analysis. False negatives were also observed across all three dPCR modalities, which may arise due to molecular dropout or amplification inefficiency, similar to the known limitations of dPCR (5, 31). To limit the effect of false negatives, we designed and implemented a melt-based IC. The use of dHRM analysis for both false-positive and false-negative discrimination serves as a low-complexity way to improve the quantitative power of dPCR, increasing confidence in absolute reaction counts. Our approach could address the largely overlooked issue of false positives and false negatives in dPCR, making the technology more robust for industrial and clinical applications.
MATERIALS AND METHODS
Target DNA isolation.
A clinical isolated Escherichia coli strain was used as a model target in all tests. E. coli strain NBRC 102203 cells from glycerol stock were grown on LB agar overnight. Single colonies were selected and grown in LB broth for 13 h before DNA extraction using a Wizard Genomic DNA purification kit (Promega Corporation, Madison, WI). DNA concentration was measured by biospectrophotometer absorbance readings and diluted in 10-fold serial dilutions to a desired target concentration.
Bacterial DNA was amplified using the forward primer 5′-GYGGCGNACGGGTGAGTAA-3′ and the reverse primer 5′-AGCTGACGACANCCATGCA-3′ (IDT, Coralville, IA). This primer set was initially characterized for universal detection of clinically relevant concentrations of bacterial DNA in the 16S rRNA gene (29).
dHRM experiments: hydrolysis probe.
The sequence used for the hydrolysis probe was selected by aligning the 16S regions for six bacterial species using the algorithm multiple alignment using fast Fourier transform (MAFFT) in Benchling and determining a 30-bp conserved region between all six species (Benchling, San Francisco, CA). The hydrolysis probe sequence was initially synthesized without the fluorophore and quencher to ensure proper annealing to the model target selected (E. coli). The probe was then synthesized with a Cy5 fluorophore and Iowa Black RQ (IBRQ quencher by IDT. The probe has the following sequence: 5Cy5/GAACCTTAC/TAO/CAGGTCTTGACATCCCGATGC/3IAbRQSp. Initial testing was performed in isolated reactions: dHRM only, probe only, and a combined reaction. The dHRM-only reaction mixture included 2.5× EvaGreen (Biotium, Fremont, CA). The probe-only reaction mixture included the probe sequence at the manufacturer’s recommended concentration of 0.25 μM. The combined reaction mixture included both 2.5× EvaGreen and 0.25 μM probe sequence. Triplicates of each condition were generated for both qPCR and dPCR tests.
Optimized universal dHRM (U-dHRM) reactions were performed using a 15-μl total reaction volume consisting of 1× IDT PrimeTime Gene Expression Master Mix (IDT, Coralville, IA), 2× 6-carboxy-X-rhodamine (ROX) dye (Bio-Rad, Hercules, CA), 0.5 μM each bacterial primer (IDT, Coralville, IA), 3 μl of target genomic DNA dilution, and ultrapure water (Quality Biological, Gaithersburg, MD).
The PCR mixture was loaded according to the manufacturer’s specifications onto a QuantStudio 3D Digital PCR 20K chip using a QuantStudio 3D Digital PCR Loader (Applied Biosystems, Foster City, CA). qPCR amplification and melt curve analysis were performed on a CFX Touch real-time PCR detection system (Bio-Rad, Hercules, CA). dPCR amplification was performed on a flatbed Proflex PCR system (Applied Biosystems, Foster City, CA). Thermocycling for both dHRM and qPCR proceeded as follows: hold at 98°C for 30 s, followed by 40 cycles of 95°C for 15 s, 58°C for 30 s, and 72°C for 60 s. qPCR amplification was followed by a melt cycle of 95°C for 15 s, 45°C for 60 s, and 96°C for 5 s. Digital PCR amplification and imaging were followed by a melt cycle on our custom chip-heating device (23).
Internal control sequence and design.
We generated a noncompetitive internal control by using a synthetic oligonucleotide which would not have any similarity to a bacterial sequence. The template sequence was compared for similarity to the bacterial genome database using the NCBI’s basic local alignment search tool (BLAST) (32). A synthetic sequence was desired as it would not be dependent on the presence of an organism or on plasmid cloning vectors. Synthetic oligonucleotides were screened for hairpin behavior, self-annealing probability, and interaction between the V1F and V6R primers used for universal bacterial detection (28). Several sequences were found to have desirable traits among the aforementioned qualities. One of the sequences with a low probability of self-annealing or annealing with the bacterial primers was selected for testing in qPCR and dPCR. Alignment of the IC sequence and bacterial primers was performed using the MAFFT algorithm through Benchling (Benchling, San Francisco, CA). The selected sequence was tested for similarities in the BLAST nucleotide database, and no significant similarities were found (33). Primers were selected to align with the first and last 18 bp of the internal control template sequence.
The internal control sequence and its primers were synthesized by Integrated DNA Technologies (IDT, Coralville, IA) and characterized for theoretical melting temperature by uMelt (University of Utah, Salt Lake City, UT). Proper fragment size formation was tested using a 3% agarose gel. The IC template sequence is as follows: 5′-CCATAGACGTAGCAACGATCGTGAGGTAGTAGATTGTATAGTTGATGCAAGGACTATCCACTCAC-3′. The IC was amplified using the forward primer 5′-CGATCGTTGCTACGTCTATGG-3′ and the reverse primer 5′-GTGAGTGGATAGTCCTTGCATC-3′.
Internal control experiments.
The master mix formula and cycling conditions used for our model DNA template reaction were previously published (29). The master mix formula was unchanged except for the addition of the IC template and primers. Optimized PCRs were performed using a 15-μl total reaction volume consisting of 1× Phusion GC PCR buffer (Thermo Scientific, Waltham, MA), 2× ROX dye (Bio-Rad, Hercules, CA), 0.1 μM each bacterial primer (IDT), 2.5× EvaGreen (Biotium, Fremont, CA), 0.2 mM deoxynucleoside triphosphate (dNTP) (Invitrogen, Carlsbad, CA), 0.02 U/μl Phusion polymerase (New England Biolabs, Ipswich, MA), 3 μl of genomic DNA dilution, and ultrapure water (Quality Biological, Gaithersburg, MD). The qPCR and dPCR reactions were performed on the same instrumentation as the probe-based experiments. Thermocycling for both dPCR and qPCR proceeded as follows: hold at 98°C for 30 s, followed by 70 cycles of 95°C for 15 s, 58°C for 30 s, and 72°C for 60 s. qPCR amplification was followed by a melt cycle of 95°C for 15 s, 45°C for 60 s, and 96°C for 5 s). dPCR amplification was followed by a melt cycle on our custom chip-heating device and imaged on the Olympus camera setup as described below.
Chip-heating device.
Following amplification on the flatbed Proflex thermal cycler, the QuantStudio 3D Digital PCR Chip (here referred to as the “chip”) was melted using a custom heating device developed by our lab. The parts and assembly have previously been described (23). The device is used to precisely ramp up the temperature of the device from 50 to 103°C at a rate of 0.2°C/s. The device is driven by a Meerstetter TEC-1122 Peltier controller (Meerstetter Engineering GmbH, Rubigen, Switzerland), and our ramping profile is uploaded to the controller via Meerstetter’s TEC Service Software, version 3.00. Fluorescence images are acquired at a frequency of 2 Hz. The ramp rate and imaging frequency were selected based on our previous research, which showed that melt curves are ramp rate dependent, and the fastest ramp rate resulted in the highest number of distinguishable features (23).
Fluorescent imaging.
Our previously published method for chip imaging was used for an initial characterization of the probe and IC results (23). For whole-chip imaging, an Olympus MVX10 macro zoom microscope (Olympus Corporation of the Americas, Center Valley, PA) coupled with a Photometrics Prime cMOS camera (Teledyne Photometrics, Tucson, AZ) and an X-Cite Turbo XT600 light source was used (Excelitas Technologies, Waltham, MA). Samples were excited using X-Cite Turbo; the 475-nm channel was used for EvaGreen excitation, and the 575-nm channel was used for ROX excitation. A Semrock Quad filter was used as an emission filter (IDEX Health and Science, LLC, Rochester, NY). Image alignment and image acquisition settings were established using the open source microscopy software Micro-Manager, version 1.4 (Micro-Manager, San Francisco, CA).
Image analysis: probe and dPCR quantification.
Positive reactions in U-dHRM were first characterized by partitions which had a starting fluorescence above a threshold calculated by the definetherain algorithm (http://definetherain.org.uk/). Positive reactions detected by the hydrolysis probe were also characterized by partitions which had a starting fluorescence above the definetherain threshold. This algorithm uses a k-means method to find two clusters which are defined as the positive and negative clusters. Partitions are considered positive if they have a fluorescence greater than the mean of the positive cluster minus three times the standard deviation of that cluster. Partitions are considered negative if the partition has a fluorescence amplitude less than the mean of the negative cluster plus three times the standard deviation of that cluster. “Rain” is defined as partitions whose fluorescence falls between the positive and negative cutoff values and cannot be confidently labeled as positive or negative. A small subset of the overall number of wells for each chip is used to characterize positive probe, dPCR, dHRM, and combined dPCR and dHRM reactions.
Two established performance characteristics were used to compare intercalating dye-based detection and probe-based detection. Using the thresholded data, peak resolution can be calculated, which is a criterion that gives a quantitative measurement of the separation between the identified positive and negative populations. A peak resolution of >2.5 represents a well-separated population of positive and negatives (28). The other performance characteristic is percent rain. According to the published criteria, percent rain should be less than 2.5% to confidently differentiate positive and negative fluorescence intensity populations (34). These criteria focus on the unique aspects of dPCR and allow us to make conclusions about how different detection methods perform in the digital format. Four different target concentrations (103, 102, 101, and 10° target DNA copies/reaction volume) were tested in triplicate for each concentration.
Image analysis: dHRM analysis.
For dHRM analysis, 1,050 images were taken in total for each chip, with 525 images taken for each dye (ROX and EvaGreen). The ROX images were aligned using the ImageJ template-matching plug-in. Melt curves were generated using a MATLAB-implemented image processing algorithm (23). A median filter was used to remove salt and pepper noise from the images, and a binary mask was used to find each well and track the fluorescence for each frame. Pixels within 80% of the well radius were used to calculate the average fluorescence for each well in the EvaGreen channel. Derivative melt curves were calculated, and the melt curves were classified as positive by dHRM if they had a single melt curve peak greater than a predetermined threshold within 1°C of the target melt curve range. The threshold for a positive by melt curve partition was determined as a maximum derivative value that is four times the average noise floor of that partition. The average noise floor of each partition was calculated by taking an average of each derivative melt curve before 80°C. The thresholding method was determined using empirical evidence of melt curve behavior. Melt curve classification was used to verify dPCR results.
Internal control analysis utilized similar image acquisition, alignment, filtering, and derivative melt curve generation. Additional parameters were added to sort the reactions into their respective categories (bacteria-only melt curves, IC-only melt curves, both melt curves present, and negative reactions).
Concentration quantification.
The predicted target copy number on the chip is calculated using Poisson statistics. The average occupancy of all reactions across the chip are calculated according to equation 1 (35):
where k is the positive partition count and n is the quantity of partitions considered. The concentration of DNA per chip is calculated by scaling the average occupancy by the overall number of partitions (equation 2):
where 20,000 partitions are available on the chip for quantification.
Comparative analysis.
Detection modalities were compared using published performance criteria for dPCR (34). Peak resolution, Rs, was one such criterion and was calculated using the following formula (equation 3):
where tp and tn are the peak fluorescence of the positive and negative populations, respectively, and wp and wn are the peak width of the positive and negative populations.
The Minimum Information for Publication of Quantitative Real-Time PCR Experiments (MIQE) guidelines have been established to standardize the reporting of methods and results in PCR. Four parameters were published for internal control comparison using these guidelines: overall partition number, individual partition volume, partition number considered, and effective reaction size. These results are shown in Table 1 (36).
TABLE 1.
MIQE reporting guidelines for dPCR parameters for three different quantification methods
| Parameter | Value for the group |
||
|---|---|---|---|
| All partitions | Loaded partitions | Amplified partitions | |
| Reaction vol prepared (μl) | 14.5 | 14.5 | 14.5 |
| Individual partition vol (μl) | 0.000725 | 0.000725 | 0.000725 |
| Avg no. of partitions considered | 2,0000 | 18324.5 | 14040.25 |
| Vol of partitions measured (μl)a | 14.5 | 13.3 | 10.2 |
Effective reaction size.
RESULTS
Direct comparison of dPCR and hydrolysis probe performance.
We first wanted to establish that a hydrolysis probe and intercalating dye could be imaged simultaneously without cross talk on our dHRM setup for direct comparison. A probe sequence with a fluorophore and quencher was initially tested in qPCR and subsequently in dPCR. All PCRs were conducted for each detection method alone and in combination to evaluate cross talk between the probe fluorophore (Cy5) and EvaGreen intercalating dye (6-carboxyfluorescein [FAM]). Three reaction mixtures were tested: probe only (Cy5), EvaGreen only (FAM), and probe-EvaGreen (Cy5-FAM). The results of this validation are shown in Fig. 1a and b for qPCR and in Fig. 1c to e for dPCR. Fluorescence emission signal was detected only in the expected channel in qPCR. Similarly, the dPCR chips showed fluorescence emission signal only in the expected channel on our dHRM setup.
FIG 1.

Assessment of cross talk between fluorophores of different detection modalities. (a) qPCR verification of fluorophore detection in the FAM channel. Reaction conditions are indicated according to the color legend. (b) qPCR results are shown for the same three conditions in the Cy5 channel. (c to e) Digital PCR verification for fluorescent cross talk is shown. Individual chips are shown for the intercalating dye only reaction, probe-only reaction, and the combined condition (with both FAM [EvaGreen] and probe loaded). Channels are as indicated.
Once we determined that there was no appreciable cross talk between the two fluorescent channels in our dHRM system, we could evaluate the performance of each detection modality through direct comparison on the same chip under the same conditions. First, detection of positive partitions was compared for probe fluorescence versus intercalating dye fluorescence. The limit of detection (LOD) was determined for both the probe and intercalating dye, which was found to be 1 target DNA copy/reaction volume. Figure 2a shows the one-dimensional (1D) fluorescence intensity scatter plot for each target concentration in the FAM channel corresponding to detection of intercalating dye positives. As the DNA target concentration decreased, a corresponding decrease in the number of positive partitions was observed. Figure 2b shows the fluorescence intensity scatter plot in the Cy5 channel corresponding to detection of probe positives. A similar trend in decreasing positive partitions was observed (34). In Fig. 2a, the scatter plots of intercalating dye fluorescence intensity show a clear distinction between the positive and negative reactions compared to those of the probe (Fig. 2b). The calculated percent rain for both detection methods is shown in Fig. 2c. Intercalating dye-based detection resulted in 3% or fewer of the wells being identified as rain, while probe-based detection resulted in up to 10% of reaction products identified as rain. The percent rain across all target concentrations was found to be statistically significant between the two detection modalities, with the intercalating dye method consistently generating less rain than probe.
FIG 2.

Comparison of dPCR performance using probe or intercalating dye-based detection. (a) dPCR rain plots for four different theoretical target DNA concentrations using intercalating dye-based detection. Fluorescence intensity is plotted from a triplicate series of chips for each target DNA concentration with both intercalating dye (EvaGreen) and probe in the reaction mixture. Fluorescence thresholds for the FAM channel were calculated using the definetherain algorithm. Blue, positive reactions; gray, negative reactions; red, rain. (b) dPCR rain plots for 4 different concentrations using probe-based detection. Fluorescence was determined from the same chips used for analysis in the experiment described in panel a. Fluorescence thresholds were calculated for the Cy5 channel using the definetherain algorithm. Blue, positive reactions; gray, negative reactions; red, rain. (c) The percent rain for each concentration is shown. A two-way analysis of variance was performed with a Bonferroni posttest, and the most variation was observed between the FAM and Cy5 channels, which were found to be statistically significantly different (P < 0.001). (d) The peak resolution for each concentration was calculated for both intercalating dye detection and probe detection. The peak resolutions between the two detection methods are statistically significantly different when analyzed using a two-way analysis of variance with a Bonferroni posttest (P < 0.001).
The peak resolution calculated for each target DNA concentration is plotted in Fig. 2d. In the intercalating dye-based detection method, we observed a peak resolution of >2.5 in every target concentration (34). Probe-based detection showed peak resolution values which were all <2.5, indicating that the positive and negative populations are not well differentiated. The peak resolution differences between detection methods were found to be statistically significant. Taken together, these data indicate that intercalating dye-based detection of positive and negative partitions outperforms probe-based detection in terms of two key indicators, percent rain and peak resolution. In these experiments, we were comparing the use of intercalating dye-based detection and probe-based detection for broad-based microbial profiling. The probe sequence was optimized to anneal to different bacterial species, potentially causing lower specificity to the test organism and decreasing performance for the two key indicators. Although the probe specificity can be improved to increase performance in the aforementioned indicators, the intercalating dye offers more utility for additional analysis, such as high-resolution melt analysis. The performance of probe-based detection compared to that of intercalating dye with high-resolution melt detection is assessed in the following section for differentiation of false positives.
Quantitative comparison of probe and intercalating dye dPCR performance to dHRM.
Next, we directly compared probe, intercalating dye, and dHRM detection methods to determine which would offer the best performance in terms of false-positive reporting. Reaction mixtures containing probe and intercalating dye were loaded onto the dPCR chip, cycled, and then analyzed using the dHRM platform. Positive partitions were labeled by three methods: probe fluorescence, intercalating dye fluorescence, and combined dPCR fluorescence and melt analysis. Partitions were considered positive by probe or intercalating dye (now labeled dPCR) if their initial fluorescence values exceeded a threshold determined by the definetherain algorithm (http://definetherain.org.uk/). Partitions were considered positive by dHRM analysis if the melt curve had a single peak that was higher than four times the average noise floor. The average noise floor for each partition was calculated by taking the average of the melt curve before 80°C. Partitions were considered positive by combined dPCR and melt analysis if their initial fluorescence levels exceeded the established FAM fluorescence threshold and met the criteria for a positive melt curve. The number of positive reactions were determined for each method (probe, dPCR, and dPCR-dHRM). Positively identified reactions for an example chip of each method are shown in Fig. 3, with each row corresponding to a different theoretical target DNA concentration. Expanded results for all 12 chips are shown in Fig. S1 and S2 in the supplemental material. Figure S1a to d show results show results for 103 genomes/chip, and Fig. S1e to h show results for 102 genomes/chip. Figure S2a to d show results for 101 genomes/chip, and Fig. S2e to h show results for 10° genomes/chip. The number of positives counted for each condition is indicated in the top left corner. Figure 3a shows the positive reactions as labeled by probe fluorescence (Cy5 threshold determined by the definetherain algorithm). The melt curves are not all uniform, and there are a number of curves which do not show an amplicon melt peak, indicating that there were false positives detected by the probe. Figure 3b shows the positive reactions as labeled by dPCR (FAM fluorescence threshold determined by the definetherain algorithm). Again, the melt curves are not all uniform, and there are peaks which are not centered at the same location as the majority of the melt curves, also indicating false-positive detection by dPCR. Figure 3c shows the positive reactions as labeled by dPCR but these do not fit the criteria for a positive melt curve. Figure 3d shows the positive reactions as labeled by both dPCR and dHRM analysis, characterized as a partition that both exceeds the EvaGreen fluorescence threshold determined by the definetherain algorithm and passes the positive melt curve criteria. In this detection method, melt curve uniformity is observed, and false-positive reactions are mitigated. The differences between Fig. 3b and d are highlighted in Fig. 3c. Interpretation of these partitions is that they are false-positive calls by dPCR that are overcome with the addition of melt curve analysis and that melt curve analysis can improve confidence in positive dPCR calls.
FIG 3.

Positive reactions determined by each dPCR detection method for an example of each target DNA concentration. Positive melt curves for example chips under the theoretical conditions (number of genomes/reaction mixture) indicated on the left side of the figure are shown. (a) Positive reactions determined by probe detection. (b) Positive reactions determined by dPCR (intercalating dye) detection. (c) Positive reactions determined dPCR (intercalating dye) but determined to be negative by dHRM analysis. (d) Positive reactions determined by concurrent dPCR and dHRM analysis.
Partitions from 12 chips were counted and identified as positive by combined dPCR and dHRM analysis and compared for concurrent results between probe-based and intercalating dye-based detection using truth tables (Fig. 4). Figure 4 shows the overall summed-up results of experiments shown in Fig. S1 and S2. Figure S3 categorizes the results shown in Fig. 4 by theoretical DNA concentration: results for 103 genomes/chip, results for 102 genomes/chip, results for 101 genomes/chip, and results for 10° genomes/chip (Fig. S3a to d, respectively). Since high-resolution melt is widely accepted as a specificity validation method in qPCR (19, 20, 37) and since we observed that dHRM improved false-positive detection after dPCR (Fig. 3), we used the combined dPCR-dHRM analysis approach as the standard in truth table calculations. Using this standard, the calculated positive predictive value (PPV) for probe was 90.5% and that for intercalating dye dPCR was 92.3%. The PPV, or how many test positives are true positives, of probe, dPCR, and dHRM analysis is <92% if we take dPCR-dHRM as the gold standard (truth).
FIG 4.

Performance comparison between hydrolysis probe, dPCR, and dPCR-dHRM. Truth tables are shown to compare each detection method used from the gold standard method. In this test, we consider the combined dPCR and dHRM detection method to be the absolute truth based on previous literature and our results shown in Fig. 3. True positives (TP), true negatives (TN), false positives (FP), and false negatives (FN) are quantified and compared between detection methods.
Figure 5 shows a direct comparison of the three detection methods against the theoretical number of genomes loaded onto the chip. Combined dPCR-dHRM (black points) and probe detection (blue points) showed the lowest coefficients of variance, 55% and 30%, respectively, and were not statistically significantly different (P > 0.05). These data are shown in Table S1. A linear regression of the data shown in Fig. 5 is shown in Fig. S4. We argue that the combined dPCR-dHRM detection method performs similarly to the probe-based detection method in terms of quantification and variance. Therefore, this method can be used in applications, such as food safety and clinical diagnostics, where minimal variance is required to properly understand risk.
FIG 5.
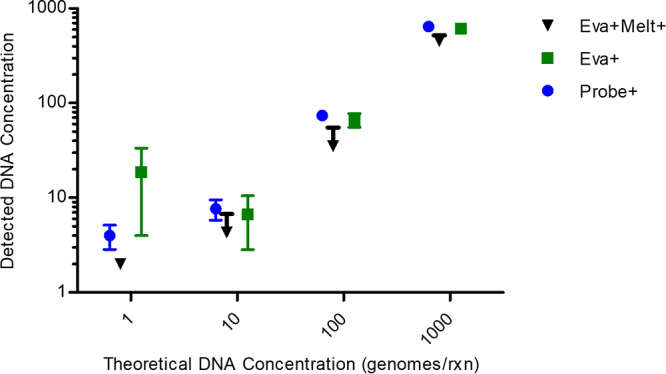
Quantification of positives classified by three methods. Four theoretical DNA concentrations were tested for all three detection methods. The measured DNA concentrations are plotted against the theoretical concentrations. Probe detection and dPCR-dHRM showed the most similar coefficients of variance. A one-way analysis of variance and a Bonferroni posttest were conducted to determine statistical significance between methods. The test results showed no statistically significant differences.
Limitations of dPCR require an internal control.
While dPCR-dHRM may offer utility over probe-based analysis for discrimination of false positives, another key failure point of dPCR is quantification of false-negative partitions. False-negative reactions occur when a reaction mixture is loaded into a partition, but molecular dropout or heating inefficiencies cause amplification failure. We previously discovered a spatial temperature gradient in the QuantStudio 3D Digital PCR system that is used in this study (23). In our previous study, we showed that the outermost partitions of the chip are more susceptible to a lag in heating causing amplification failure. Examples of this phenomenon are shown in Fig. S5. In dPCR-dHRM, false-negative classification can occur in these corners where target DNA is loaded but does not amplify. To decrease erroneous classification of false negatives, we developed an exogenous internal control to ensure that all partitions counted were capable of amplifying.
Internal control proof of concept.
We devised a synthetic internal control (IC) sequence to be included into the reaction master mix that would generate a separate melt curve below the expected melting temperature of the target DNA. The primers used for universal bacterial amplification generate an amplicon with a melting temperature of >90°C, requiring the melting temperature of the internal control to be < 90°C. The internal control template was designed to be amplified by a secondary set of primers to ensure that the target DNA primers would not be used up by the IC template, limiting competition for primers in cases of low-target-copy-number DNA. This noncompetitive internal control should theoretically improve DNA quantification and limit false-negative results by calling attention to reaction mixtures that could not successfully amplify so that these partitions can be removed from analysis without directly interfering with amplification of the target species. Since the internal control has a known melting temperature, it can be used as a calibrator to align the temperature axes for uniformity across experiments and imaging platforms (28).
However, the internal control is still subject to several amplification inhibitors that affect the target DNA. For example, molecular dropout can still occur with the IC, which would prevent the accurate calling of a true negative. However, molecular dropout is less likely to occur with the IC we designed for several reasons. First, it is loaded into the reaction mix at a higher concentration. This helps to avoid single-molecule amplification stochasticity and also reduces the chances of PCR inhibition that can arise due to the higher surface area-to-volume ratio of the partitions where reagents can adsorb (5). The IC is also a linear short synthetic target sequence that should be less prone to molecular dropout issues that affect highly organized DNA (38). As previously stated, there is also a spatial temperature gradient on our dPCR platform, hindering amplification in the outermost partitions of the chip. The IC is still susceptible to suboptimal heating conditions in these partitions, which can be observed in Fig. S5. When the IC is loaded onto a chip, the corner partitions are not fluorescing in the EvaGreen channel, indicating amplification inhibition in these reactions that both the IC and target DNA were susceptible to. The main advantages of inclusion of this IC strategy are decreased susceptibility to amplification inhibition and the ability to differentiate partitions which successfully amplified from ones which did not. The internal control template and primers were initially tested for amplification in qPCR under the same cycling conditions used for target DNA. Initially, the IC template and primer concentrations were varied together and individually. We found that variation of the IC template concentration resulted in no appreciable change in amplification. Therefore, efforts were focused on finding an optimal IC primer concentration. The optimal internal control was then defined as the IC primer concentration which would limit IC amplification and allow target DNA amplification at a digital level. Target DNA concentration was considered digital at a level of 103 genomes/reaction volume. The optimization was first performed in qPCR to select a range of IC primer concentrations to be tested in dPCR. A range of concentrations around the optimal IC primer concentration were tested for simultaneous IC and target amplification in dPCR. Based on the results from the qPCR tests (Fig. S6e), we found that the optimal IC primer concentration in the presence of target DNA is between 0.03 and 0.05 μM in the bulk reaction mixture. Knowledge of the optimal IC primer concentration range in qPCR allowed for a starting concentration to test in dPCR. A similar range of IC primer concentrations was tested in dPCR.
Internal control assay optimization in dPCR.
Theoretically when high enough concentrations of IC template and primers are loaded onto the chip, there should be 100% amplification of all partitions. However, imperfect loading and heating cause discrepancies in the number of loaded partitions and the number of amplified partitions. Examples of this phenomenon are shown in Fig. S5, highlighting the need for an internal amplification control. Since we showed the utility of our IC method in qPCR, we then tested the IC performance in a dPCR platform. Figure 6 shows an example of the output from our dPCR-dHRM platform. Figure 6a shows the fluorescence loss on an example chip as it is heated during a melt cycle. The presence of both the IC template and target DNA caused a double melt curve peak, which reflects the denaturation of the internal control followed by denaturation of target DNA (Fig. 6b). Optimization of the reaction mixture is needed to find the concentration of IC primers that would maximize the number of amplified partitions without compromising target DNA quantification. The two parameters used to determine the optimal IC template and primer concentrations are loading ratio (ratio of IC amplified wells to the number of loaded wells) and absolute amplified target DNA count. Example results of testing various IC primer concentrations in dPCR-dHRM are found in Fig. 7a. As the IC primer concentration increased, the number of target DNA melt curves detected decreased, despite the fact that the chips were loaded with the same concentrations of target DNA. This indicates that the IC amplicon is competing for reaction resources even though there is no competition for primers. Figure 7b shows a direct comparison of six IC primer concentrations. As the IC primer concentration increased (shown from left to right), an increase in the loading ratio was observed, meaning that more partitions were amplified when more primers were present. However, this increase was significant only between the highest IC primer concentration and the two lowest, nonzero IC primer concentrations. Conversely, as IC primer concentration increased, the target DNA calculated concentration decreased, reiterating the observation that the IC amplicon is competing for reaction resources. In terms of calculated target DNA concentration, only the result with the 0.04 μM IC primer condition was statistically significantly different from the target concentration when no IC was present. Both the 0.02 and 0.03 μM IC primer concentrations satisfied the requirements of no statistical significance for loading ratio and absolute target DNA count. Either of these concentrations can be used for future testing and assay optimization.
FIG 6.

dPCR-dHRM of IC and target DNA. (a) The melt progression of a chip loaded with both primer pairs, internal control template, and target DNA template. Corresponding temperatures are indicated at the bottom of each image. At increasing temperatures, fluorescence decreases as the internal control sequence denatures, leaving only target DNA. As the temperature continues to increase beyond 100°C, there is another decrease in fluorescence as the target DNA denatures. (b) Fluorescence loss and corresponding melt curves.
FIG 7.

Optimization of IC primer concentration in dPCR-dHRM. (a) Example melt curves of one chip with target DNA and an internal control are shown at increasing IC primer concentrations from left to right. IC template and target DNA template are held at constant concentrations. (b) Quantitative comparison of six IC primer concentrations. Blue bars indicate the loading ratio calculated for each chip and is defined as the ratio of amplified (IC positive) wells to loaded wells. A one-way analysis of variance with a Bonferroni multiple-comparison test was used to determine statistical significance of loading ratio and target DNA concentration between IC primer concentrations. Loading ratios of IC primer conditions at 0.01 and 0.005 μM are statistically significant from the highest IC primer condition (P values of <0.05 and <0.01, respectively). Red bars indicate the calculated concentration of targets. Only the 0.04 μM IC primer condition had a statistically significant concentration difference from the 0 μM IC condition (P < 0.05). Results for all other conditions were nonsignificant.
To calculate the concentration of DNA in a sample using dPCR, one must quantify the number of positive and negative reactions and fit this to a Poisson distribution. If an IC and a loading control are not included in the reaction mixture, all 20,000 partitions would be considered in the absolute quantification of positives and negatives. However, Table 1 shows that this would overestimate the reactions that should in fact be quantified. In our study, only ∼18,000 partitions are reliably loaded, while ∼14,000 partitions are reliably amplified. By not accounting for the partitions where molecular dropout or loading variability occur, the measured target concentration is an inaccurate assessment of true concentration of target DNA. Figure 8 shows the change in calculated concentration when the total number of partitions available on the chip, the number of loaded partitions (partitions positive for ROX fluorescence), and the number of amplified partitions (partitions with successful IC amplification) are considered in quantification calculations. The true calculated concentrations as a function of calculation method can be seen in Fig. S7. When the total number of partitions is considered, the calculated target concentration per chip can change from the conditions where only the loaded or amplified wells are considered. We found that there is a significant difference in calculated concentration when only amplified partitions are considered versus that when all partitions are considered, demonstrating the significance of taking effective reaction size into account. In the partitions where there was no reaction mixture loaded or the amplification failed, we cannot be sure if target DNA was present or not, resulting in classification of those partitions as false negatives. By considering only the partitions where we know that the reaction mixture was loaded and amplification was successful, we can have a more accurate estimation of target DNA concentration. A summary of how quantified partitions and effective reaction size can change as a function of quantification method is shown in Table 1. Effective reaction size is defined as the volume fraction of the total reaction volume present in the partitions analyzed, where the remaining fraction is left out of analysis (35). It is apparent that effective reaction size can vary with the number of considered partitions. The calculated concentration of target DNA in a sample also varies with the number of partitions considered. In pairwise comparisons of the three quantification methods, the percent increase in calculated concentration was 13% for loaded partitions versus amplified partitions, 34% for all partitions versus loaded partitions, and 52% for all partitions versus amplified partitions. In most commercial dPCR systems, the target DNA concentration would be calculated as a function of the overall number of partitions available; however, these results suggest that there is up to a 52% change in concentration when only the amplified partitions, rather than the overall number of partitions, are considered. In some cases, target DNA concentration is calculated as a function of the number of partitions which were loaded with reaction mixture. However, results suggest that there could still be a 13% difference when only the amplified partitions rather than the loaded partitions are considered.
FIG 8.
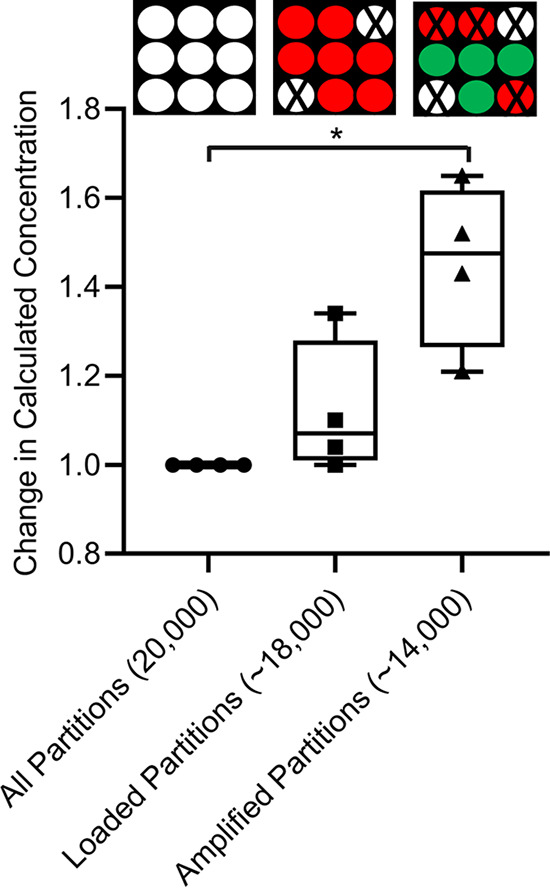
Change in calculated concentration using three methods. The target DNA concentration is calculated for four different IC primer concentrations using three methods with equation 1. The methods are the following: consideration of all partitions, consideration of loaded partitions only, and consideration of amplified partitions only. Paired t tests were performed between all pairs of methods to determine statistical significance. The t tests showed that the only comparison with statistically significant differences was the consideration of all partitions versus amplified partitions.
Limitations.
One confounding factor for our PPV calculations is the reliance on melt curves being within 1°C of the expected melt value. We previously showed that a spatial heat gradient occurs on our chip-based system (23). The spatial heat gradient would cause melt curves to fall outside this 1°C, causing false-positive calls by dPCR. Current dPCR platforms have been shown to exhibit significant intrarun and interrun variance (39). Experimentally, we also observed significant variance (Table S1), which could potentially stem from minute differences in target concentration loaded or variations in amplification efficiency during cycling. Additionally, we still observed target loss in dPCR with the addition of the internal control template and primers. Further optimization is needed to find optimal reagent concentrations without causing PCR inhibition and to limit the variance observed experimentally.
DISCUSSION
We proposed a method combining dHRM with a noncompetitive IC to overcome false-positive and false-negative classification in dPCR. In cases where a low target concentration or copy number is expected, dPCR has the potential to be a powerful tool that can accurately quantify the target concentration. However, we experimentally observed that dPCR is still limited by false negatives due to molecular dropout and false positives from off-target DNA amplification. These issues have been previously published in descriptions of dPCR methods (5, 31). We set out to eliminate the aforementioned issues that confound typical dPCR results and increase confidence in the quantitative power. However, it is important to note that we tested our method in only one dPCR platform, and other platforms may perform differently.
The quantitative power of dPCR is dependent on the absolute number of partitions and accurate determination of positive and negative reactions. Utilizing dHRM analysis of target amplicons, we were able to confidently differentiate true positives from off-target amplicons. Using dHRM detection of a noncompetitive internal control, we were able to confidently differentiate reactions that were negative for target DNA from reactions that failed to amplify. Both of these were accomplished within a two-channel imaging setup through the use of melt curve analysis, instead of distinct fluorophores, as amplicon-specific indicators.
The ability to multiplex detection capabilities through melt analysis can extend beyond the application we demonstrated here for type I and II error mitigation in dPCR. Most nucleic acid-based detection methods rely on multiplexed primer sets or probe sequences to identify more than one target within a heterogeneous sample (40). This can be costly if a large number of bacterial species are analyzed in a single sample since different bacterial species require individual assays. These methods also inhibit detection of targets with low concentrations or bacterial load since sample splitting is typically not feasible with routinely used multiplexed PCR assay kits, significantly reducing the sensitivity of the assay. We along with others have previously demonstrated that HRM analysis can be used to differentiate a multitude of target sequences amplified by universal primers, such as bacterial identification based on 16S rRNA melt analysis (27, 28, 41, 42). We have enabled this approach to be employed in a dPCR format, which at digital target dilutions enables the resolution of mixtures of sequences (29, 40, 43). In the future, it will be important to integrate ICs into broad-based dPCR-dHRM screening applications. ICs can also potentially serve as a means to temperature calibrate melt curves for more accurate classification using automated machine learning algorithms (28, 29). The current melting temperature of our IC is above 80°C, which may overlap target sequences that have low-GC content. However, the IC template and primer sequences can be modified to have a different melt location, shape, or lower overall melt temperature.
Previously, a number of internal control mechanisms have been proposed and developed in qPCR. Here, we focused on developing an IC that would be compatible with broad-based microbial detection in dPCR-dHRM. Internal control methods are typically either specific to a few target amplicons or competitive in nature. IC templates that are amplified by the same primer pair as the target can cause inhibition of the target amplicon and result in a smaller number of targets detected (44, 45). There are a number of considerations, such as increasing the length of an IC template, that can be optimized to favor the target amplicon. However, broad-based microbial detection benefits from long target amplicons and low target concentration, prohibiting the use of competitive ICs (44). Noncompetitive internal control methods typically work by modification of another gene on the target organism, chimeric primers, or plasmid cloning vectors. For diagnostic applications of broad-range bacterial screening, IC methods that depend on the presence of the target cannot be used. For our application, employing a synthetic IC sequence with no similarity to pathogenic sequences eliminates the need for IC redesign in cases where overlap of the pathogenic target exists (12–15, 46–50). The proposed synthetic IC sequence can theoretically be used for any pathogen profiling technique (i.e., viral, fungal, and bacterial) and for any other target sequence with no similarity.
Pathogen detection for clinical diagnostics requires absolute quantification, broad identification, and low limits of detection. Quantification in diagnostics is especially critical since the pathogen load can range considerably between patients and can be used to determine disease severity, response to treatment, and prognosis. Our approach combining dPCR-dHRM and a universal IC creates a unique method for improved quantitative power compared to that of traditional nucleic acid-based detection and identification techniques. Future studies will test the utility of this method for detection of infectious agents in neonatal sepsis. Neonates are an especially vulnerable population that would benefit greatly from a method of microbial profiling that can return results faster than blood culture and confidently quantify low bacterial loads from small sample sizes. Therefore, we believe that our method would give the most improvement in this clinical application.
Supplementary Material
ACKNOWLEDGMENTS
This work was supported by the National Institute of Allergy and Infectious Diseases of the National Institutes of Health (award number R01AI134982), a Burroughs Wellcome Fund Career Award at the Scientific Interface (award number 1012027 to S.I.F.), and UCSD CTRI, FISP, and AIM pilot grants.
S.I.F. and A.A. designed the study. A.A. conducted experiments and analyzed data. A.A., Y.G., D.O.V., Y.Y., and M.S. helped to integrate the Olympus imaging system with the melting platform hardware. A.A. and K.C. built the algorithm to analyze data from the Olympus microscope. S.M.L. provided clinical isolates and assistance in writing the article.
S.I.F. is a scientific cofounder of MelioLabs, Inc., and has an equity interest in the company. NIAID award number R01AI134982 has been identified for conflict of interest management based on the overall scope of the project and its potential benefit to MelioLabs, Inc.; however, the research findings included in this particular publication may not necessarily relate to the interests of MelioLabs, Inc. The terms of this arrangement have been reviewed and approved by the University of California, San Diego, in accordance with its conflict of interest policies.
Footnotes
Supplemental material is available online only.
REFERENCES
- 1.Cai Y, Li X, Lv R, Yang J, Li J, He Y, Pan L. 2014. Quantitative analysis of pork and chicken products by droplet digital PCR. Biomed Res Int 2014:810209–810206. doi: 10.1155/2014/810209. [DOI] [PMC free article] [PubMed] [Google Scholar]
- 2.Lin Y, Gifford S, Ducklow H, Schofield O, Cassar N. 2018. Towards quantitative microbiome community profiling using internal standards. Appl Environ Microbiol 85:e02634-18. doi: 10.1128/AEM.02634-18. [DOI] [PMC free article] [PubMed] [Google Scholar]
- 3.Rinta-Kanto JM, Ouellette AJA, Boyer GL, Twiss MR, Bridgeman TB, Wilhelm SW. 2005. Quantification of toxic Microcystis spp. during the 2003 and 2004 blooms in western Lake Erie using quantitative real-time PCR. Environ Sci Technol 39:4198–4205. doi: 10.1021/es048249u. [DOI] [PubMed] [Google Scholar]
- 4.Kubista M, Andrade JM, Bengtsson M, Forootan A, Jonák J, Lind K, Sindelka R, Sjöback R, Sjögreen B, Strömbom L, Ståhlberg A, Zoric N. 2006. The real-time polymerase chain reaction. Mol Aspects Med 27:95–125. doi: 10.1016/j.mam.2005.12.007. [DOI] [PubMed] [Google Scholar]
- 5.Quan P-L, Sauzade M, Brouzes E. 2018. dPCR: a technology review. Sensors 18:1271. doi: 10.3390/s18041271. [DOI] [PMC free article] [PubMed] [Google Scholar]
- 6.Vogelstein B, Kinzler KW. 1999. Digital PCR. Proc Natl Acad Sci U S A 96:9236–9241. doi: 10.1073/pnas.96.16.9236. [DOI] [PMC free article] [PubMed] [Google Scholar]
- 7.Stranieri I, Kanunfre KA, Rodrigues JC, Yamamoto L, Nadaf MIV, Palmeira P, Okay TS. 2018. Assessment and comparison of bacterial load levels determined by quantitative amplifications in blood culture-positive and negative neonatal sepsis. Rev Inst Med Trop São Paulo 60:e61. doi: 10.1590/S1678-9946201860061. [DOI] [PMC free article] [PubMed] [Google Scholar]
- 8.Kuypers J, Jerome KR. 2017. Applications of digital PCR for clinical microbiology. J Clin Microbiol 55:1621–1628. doi: 10.1128/JCM.00211-17. [DOI] [PMC free article] [PubMed] [Google Scholar]
- 9.Pharo HD, Andresen K, Berg KCG, Lothe RA, Jeanmougin M, Lind GE. 2018. A robust internal control for high-precision DNA methylation analyses by droplet digital PCR. Clin Epigenet 10:24. doi: 10.1186/s13148-018-0456-5. [DOI] [PMC free article] [PubMed] [Google Scholar]
- 10.Shehata HR, Li J, Chen S, Redda H, Cheng S, Tabujara N, Li H, Warriner K, Hanner R. 2017. Droplet digital polymerase chain reaction (ddPCR) assays integrated with an internal control for quantification of bovine, porcine, chicken and turkey species in food and feed. PLoS One 12:e0182872. doi: 10.1371/journal.pone.0182872. [DOI] [PMC free article] [PubMed] [Google Scholar]
- 11.Sedlak RH, Kuypers J, Jerome KR. 2014. A multiplexed droplet digital PCR assay performs better than qPCR on inhibition prone samples. Diagn Microbiol Infect Dis 80:285–286. doi: 10.1016/j.diagmicrobio.2014.09.004. [DOI] [PubMed] [Google Scholar]
- 12.Hoorfar J, Ahrens P, RådströM P. 2000. Automated 5′ nuclease PCR assay for identification of Salmonella enterica. J Clin Microbiol 38:3429–3435. doi: 10.1128/JCM.38.9.3429-3435.2000. [DOI] [PMC free article] [PubMed] [Google Scholar]
- 13.Randall L, Lemma F, Rodgers J, Vidal A, Clifton-Hadley F. 2010. Development and evaluation of internal amplification controls for use in a real-time duplex PCR assay for detection of Campylobacter coli and Campylobacter jejuni. J Med Microbiol 59:172–178. doi: 10.1099/jmm.0.014415-0. [DOI] [PubMed] [Google Scholar]
- 14.Rosenstraus M, Wang Z, Chang S-Y, Debonville D, Spadoro JP. 1998. An internal control for routine diagnostic PCR: design, properties, and effect on clinical performance. J Clin Microbiol 36:191–197. doi: 10.1128/JCM.36.1.191-197.1998. [DOI] [PMC free article] [PubMed] [Google Scholar]
- 15.van Doornum GJJ, Guldemeester J, Osterhaus A, Niesters H. 2003. Diagnosing herpesvirus infections by real-time amplification and rapid culture. J Clin Microbiol 41:576–580. doi: 10.1128/jcm.41.2.576-580.2003. [DOI] [PMC free article] [PubMed] [Google Scholar]
- 16.Wellinghausen N, Frost C, Marre R. 2001. Detection of legionellae in hospital water samples by quantitative real-time LightCycler PCR. Appl Environ Microbiol 67:3985–3993. doi: 10.1128/AEM.67.9.3985-3993.2001. [DOI] [PMC free article] [PubMed] [Google Scholar]
- 17.Herrmann MG, Durtschi JD, Wittwer CT, Voelkerding KV. 2007. Expanded instrument comparison of amplicon DNA melting analysis for mutation scanning and genotyping. Clin Chem 53:1544–1548. doi: 10.1373/clinchem.2007.088120. [DOI] [PubMed] [Google Scholar]
- 18.Herrmann MG, Durtschi JD, Bromley LK, Wittwer CT, Voelkerding KV. 2006. Amplicon DNA melting analysis for mutation scanning and genotyping: cross-platform comparison of instruments and dyes. Clin Chem 52:494–503. doi: 10.1373/clinchem.2005.063438. [DOI] [PubMed] [Google Scholar]
- 19.Liu Y-P, Wu H-Y, Yang X, Xu H-Q, Chen D, Huang Q, Fu W-L. 2014. Diagnostic accuracy of high resolution melting analysis for detection of KRAS mutations: a systematic review and meta-analysis. Sci Rep 4:7521. doi: 10.1038/srep07521. [DOI] [PMC free article] [PubMed] [Google Scholar]
- 20.Ririe KM, Rasmussen RP, Wittwer CT. 1997. Product differentiation by analysis of DNA melting curves during the polymerase chain reaction. Anal Biochem 245:154–160. doi: 10.1006/abio.1996.9916. [DOI] [PubMed] [Google Scholar]
- 21.Bustin SA, Nolan T. 2004. Pitfalls of quantitative real-time reverse-transcription polymerase chain reaction. J Biomol Tech 15:155–166. [PMC free article] [PubMed] [Google Scholar]
- 22.Nowrouzian FL, Adlerberth I, Wold AE. 2009. High frequency of false-positive signals in a real-time PCR-based “plus/minus” assay. APMIS 117:68–72. doi: 10.1111/j.1600-0463.2008.00010.x. [DOI] [PubMed] [Google Scholar]
- 23.Sinha M, Mack H, Coleman TP, Fraley SI. 2018. A high-resolution digital DNA melting platform for robust sequence profiling and enhanced genotype discrimination. SLAS Technol 23:580–591. doi: 10.1177/2472630318769846. [DOI] [PubMed] [Google Scholar]
- 24.Harrison LB, Hanson ND. 2017. High-resolution melting analysis for rapid detection of sequence type 131 Escherichia coli. Antimicrob Agents Chemother 61:e00265-17. doi: 10.1128/AAC.00265-17. [DOI] [PMC free article] [PubMed] [Google Scholar]
- 25.Han Y, Khu D-M, Monteros MJ. 2012. High-resolution melting analysis for SNP genotyping and mapping in tetraploid alfalfa (Medicago sativa L.). Mol Breed 29:489–501. doi: 10.1007/s11032-011-9566-x. [DOI] [PMC free article] [PubMed] [Google Scholar]
- 26.Athamanolap P, Parekh V, Fraley SI, Agarwal V, Shin DJ, Jacobs MA, Wang T-H, Yang S. 2014. Trainable high-resolution melt curve machine learning classifier for large-scale reliable genotyping of sequence variants. PLoS One 9:e109094. doi: 10.1371/journal.pone.0109094. [DOI] [PMC free article] [PubMed] [Google Scholar]
- 27.Fraley SI, Athamanolap P, Masek BJ, Hardick J, Carroll KC, Hsieh Y-H, Rothman RE, Gaydos CA, Wang T-H, Yang S. 2016. Nested machine learning facilitates increased sequence content for large-scale automated high-resolution melt genotyping. Sci Rep 6:19218. doi: 10.1038/srep19218. [DOI] [PMC free article] [PubMed] [Google Scholar]
- 28.Fraley SI, Hardick J, Masek BJ, Jo Masek B, Athamanolap P, Rothman RE, Gaydos CA, Carroll KC, Wakefield T, Wang T-H, Yang S. 2013. Universal digital high-resolution melt: a novel approach to broad-based profiling of heterogeneous biological samples. Nucleic Acids Res 41:e175. doi: 10.1093/nar/gkt684. [DOI] [PMC free article] [PubMed] [Google Scholar]
- 29.Velez DO, Mack H, Jupe J, Hawker S, Kulkarni N, Hedayatnia B, Zhang Y, Lawrence S, Fraley SI. 2017. Massively parallel digital high-resolution melt for rapid and absolutely quantitative sequence profiling. Sci Rep 7:42326. doi: 10.1038/srep42326. [DOI] [PMC free article] [PubMed] [Google Scholar]
- 30.Sinha M, Jupe J, Mack H, Coleman TP, Lawrence SM, Fraley SI. 2018. Emerging technologies for molecular diagnosis of sepsis. Clin Microbiol Rev 31:e00089-17. doi: 10.1128/CMR.00089-17. [DOI] [PMC free article] [PubMed] [Google Scholar]
- 31.Huggett JF, Cowen S, Foy CA. 2015. Considerations for digital PCR as an accurate molecular diagnostic tool. Clin Chem 61:79–88. doi: 10.1373/clinchem.2014.221366. [DOI] [PubMed] [Google Scholar]
- 32.NCBI Resource Coordinators. 2018. Database resources of the National Center for Biotechnology Information. Nucleic Acids Res 46:D7–D19. doi: 10.1093/nar/gkv1290. [DOI] [PMC free article] [PubMed] [Google Scholar]
- 33.Altschul SF, Gish W, Miller W, Myers EW, Lipman DJ. 1990. Basic local alignment search tool. J Mol Biol 215:403–410. doi: 10.1016/S0022-2836(05)80360-2. [DOI] [PubMed] [Google Scholar]
- 34.Lievens A, Jacchia S, Kagkli D, Savini C, Querci M. 2016. Measuring digital PCR quality: performance parameters and their optimization. PLoS One 11:e0153317. doi: 10.1371/journal.pone.0153317. [DOI] [PMC free article] [PubMed] [Google Scholar]
- 35.Pavšič J, Žel J, Milavec M. 2016. Assessment of the real-time PCR and different digital PCR platforms for DNA quantification. Anal Bioanal Chem 408:107–121. doi: 10.1007/s00216-015-9107-2. [DOI] [PMC free article] [PubMed] [Google Scholar]
- 36.Bustin SA, Benes V, Garson JA, Hellemans J, Huggett J, Kubista M, Mueller R, Nolan T, Pfaffl MW, Shipley GL, Vandesompele J, Wittwer CT. 2009. The MIQE guidelines: minimum information for publication of quantitative real-time PCR experiments. Clin Chem 55:611–622. doi: 10.1373/clinchem.2008.112797. [DOI] [PubMed] [Google Scholar]
- 37.Li W, Matsuoka M, Kai M, Thapa P, Khadge S, Hagge DA, Brennan PJ, Vissa V. 2012. Real-time PCR and high-resolution melt analysis for rapid detection of Mycobacterium leprae drug resistance mutations and strain types. J Clin Microbiol 50:742–753. doi: 10.1128/JCM.05183-11. [DOI] [PMC free article] [PubMed] [Google Scholar]
- 38.Whale AS, Cowen S, Foy CA, Huggett JF. 2013. Methods for applying accurate digital PCR analysis on low copy DNA samples. PLoS One 8:e58177. doi: 10.1371/journal.pone.0058177. [DOI] [PMC free article] [PubMed] [Google Scholar]
- 39.Ricchi M, Bertasio C, Boniotti MB, Vicari N, Russo S, Tilola M, Bellotti MA, Bertasi B. 2017. Comparison among the quantification of bacterial pathogens by qPCR, dPCR, and cultural methods. Front Microbiol 8:1174. doi: 10.3389/fmicb.2017.01174. [DOI] [PMC free article] [PubMed] [Google Scholar]
- 40.Ereqat S, Bar-Gal GK, Nasereddin A, Azmi K, Qaddomi SE, Greenblatt CL, Spigelman M, Abdeen Z. 2010. Rapid differentiation of Mycobacterium tuberculosis and M. bovis by high-resolution melt curve analysis. J Clin Microbiol 48:4269–4272. doi: 10.1128/JCM.00943-10. [DOI] [PMC free article] [PubMed] [Google Scholar]
- 41.Robertson T, Bibby S, O'Rourke D, Belfiore T, Lambie H, Noormohammadi AH. 2009. Characterization of Chlamydiaceae species using PCR and high-resolution melt curve analysis of the 16S rRNA gene. J Appl Microbiol 107:2017–2028. doi: 10.1111/j.1365-2672.2009.04388.x. [DOI] [PubMed] [Google Scholar]
- 42.Mader E, Ruzicka J, Schmiderer C, Novak J. 2011. Quantitative high-resolution melting analysis for detecting adulterations. Anal Biochem 409:153–155. doi: 10.1016/j.ab.2010.10.009. [DOI] [PubMed] [Google Scholar]
- 43.Wittwer CT. 2009. High-resolution DNA melting analysis: advancements and limitations. Hum Mutat 30:857–859. doi: 10.1002/humu.20951. [DOI] [PubMed] [Google Scholar]
- 44.Müller F-M, Schnitzler N, Cloot O, Kockelkorn P, Haase G, Li Z. 1998. The rationale and method for constructing internal control DNA used in pertussis polymerase chain reaction. Diagn Microbiol Infect Dis 31:517–523. doi: 10.1016/S0732-8893(98)00043-1. [DOI] [PubMed] [Google Scholar]
- 45.Hoorfar J, Malorny B, Abdulmawjood A, Cook N, Wagner M, Fach P. 2004. Practical considerations in design of internal amplification controls for diagnostic PCR assays. J Clin Microbiol 42:1863–1868. doi: 10.1128/jcm.42.5.1863-1868.2004. [DOI] [PMC free article] [PubMed] [Google Scholar]
- 46.Malorny B, Hoorfar J, Bunge C, Helmuth R. 2003. Multicenter validation of the analytical accuracy of Salmonella PCR: towards an international standard. Appl Environ Microbiol 69:290–296. doi: 10.1128/aem.69.1.290-296.2003. [DOI] [PMC free article] [PubMed] [Google Scholar]
- 47.Sachadyn P, Kur J. 1998. The construction and use of a PCR internal control. Mol Cell Probes 12:259–262. doi: 10.1006/mcpr.1998.0170. [DOI] [PubMed] [Google Scholar]
- 48.Abdulmawjood A, Roth S, Bülte M. 2002. Two methods for construction of internal amplification controls for the detection of Escherichia coli O157 by polymerase chain reaction. Mol Cell Probes 16:335–339. doi: 10.1006/mcpr.2002.0431. [DOI] [PubMed] [Google Scholar]
- 49.Tong Y, McCarthy K, Kong H, Lemieux B. 2012. Development and comparison of a rapid isothermal nucleic acid amplification test for typing of herpes simplex virus types 1 and 2 on a portable fluorescence detector. J Mol Diagn 14:569–576. doi: 10.1016/j.jmoldx.2012.05.005. [DOI] [PMC free article] [PubMed] [Google Scholar]
- 50.van den Brand M, Peters RPH, Catsburg A, Rubenjan A, Broeke FJ, van den Dungen FAM, van Weissenbruch MM, van Furth AM, Kõressaar T, Remm M, Savelkoul PHM, Bos MP. 2014. Development of a multiplex real-time PCR assay for the rapid diagnosis of neonatal late onset sepsis. J Microbiol Methods 106:8–15. doi: 10.1016/j.mimet.2014.07.034. [DOI] [PubMed] [Google Scholar]
Associated Data
This section collects any data citations, data availability statements, or supplementary materials included in this article.