

There are limited treatment options for enterococcal urinary tract infections, especially vancomycin-resistant Enterococcus (VRE). Oral fosfomycin is a potential option, although limited data are available guiding dosing and susceptibility. We undertook pharmacodynamic profiling of fosfomycin against E. faecalis and E. faecium isolates using a dynamic in vitro bladder infection model. Eighty-four isolates underwent fosfomycin agar dilution susceptibility testing (E. faecalis MIC50/90 32/64 μg/ml; E. faecium MIC50/90 64/128 μg/ml).
KEYWORDS: Enterococcus, fosfomycin, in vitro modelling, pharmacodynamics, pharmacokinetics, synthetic human urine, urinary tract infection, vancomycin resistance
ABSTRACT
There are limited treatment options for enterococcal urinary tract infections, especially vancomycin-resistant Enterococcus (VRE). Oral fosfomycin is a potential option, although limited data are available guiding dosing and susceptibility. We undertook pharmacodynamic profiling of fosfomycin against E. faecalis and E. faecium isolates using a dynamic in vitro bladder infection model. Eighty-four isolates underwent fosfomycin agar dilution susceptibility testing (E. faecalis MIC50/90 32/64 μg/ml; E. faecium MIC50/90 64/128 μg/ml). Sixteen isolates (including E. faecalis ATCC 29212 and E. faecium ATCC 35667) were chosen to reflect the MIC range and tested in the bladder infection model with synthetic human urine (SHU). Under drug-free conditions, E. faecium demonstrated greater growth restriction in SHU compared to E. faecalis (E. faecium maximal growth 5.8 ± 0.6 log10 CFU/ml; E. faecalis 8.0 ± 1.0 log10 CFU/ml). Isolates were exposed to high and low fosfomycin urinary concentrations after a single dose, and after two doses given over two days with low urinary concentration exposure. Simulated concentrations closely matched the target (bias 2.3%). E. faecalis isolates required greater fosfomycin exposure for 3 log10 kill from the starting inoculum compared with E. faecium. The ƒAUC0-72/MIC and ƒ%T > MIC0-72 for E. faecalis were 672 and 70%, compared to 216 and 51% for E. faecium, respectively. There was no rise in fosfomycin MIC postexposure. Two doses of fosfomycin with low urinary concentrations resulted in equivalent growth inhibition to a single dose with high urinary concentrations. With this urinary exposure, fosfomycin was effective in promoting suppression of regrowth (>3 log10 kill) in the majority of isolates.
TEXT
Urinary tract infections (UTIs) are among the most common infections experienced worldwide (1, 2). UTIs caused by Enterococcus spp. are responsible for approximately 5% of community-acquired infections, the third most leading cause of hospital-acquired UTIs, and implicated in 30% of catheter-associated UTIs (3). The most prevalent species is E. faecalis, which is more virulent than E. faecium but with less intrinsic and acquired antimicrobial resistance. Enterococci are well-adapted pathogens and are able to survive in harsh conditions, with the capacity to attach to both host cells and inert materials and form biofilms (4). They have a broad spectrum of intrinsic resistance and tolerance to the bactericidal activity of many agents and can readily acquire new resistance to antimicrobials. Acquired resistance rates have progressively risen over time (5). Of particular concern is the increase in vancomycin-resistant Enterococcus (VRE) strains, now accounting for up to 80% of E. faecium isolates in some hospitals (6).
Fosfomycin demonstrates good in vitro activity against enterococci, including VRE strains (7–10), and is licensed for the treatment of uncomplicated UTIs as a single 3 g oral dose, which is well tolerated and achieves high concentrations in the urine (11–14). With a unique chemical structure and without cross-resistance with other agents, oral fosfomycin is gaining interest in its expanding role for the treatment of multidrug-resistant UTIs (15–17), and as a therapeutic option for enterococcal UTIs (18, 19). Clinical breakpoints for fosfomycin susceptibility is provided for E. faecalis urinary isolates by the Clinical and Laboratory Standards Institute (CLSI) (20). This breakpoint (agar dilution susceptible MIC ≤64 μg/ml) is the same as that provided for Escherichia coli urinary isolates, with the same requirement for the addition of 25 mg/liter glucose-6-phosphate (G6P) to the media for agar dilution susceptibility testing. Broth microdilution testing is not recommended. Similarly, for disk diffusion susceptibility testing, fosfomycin 200-μg disks also contain 50 μg of G6P, with the CLSI susceptible inhibition zone diameter ≥16 mm. The European Committee on Antimicrobial Susceptibility Testing (EUCAST) does not provide fosfomycin breakpoints for Enterococcus spp. (21).
We examined fosfomycin susceptibility among clinical enterococcal isolates and assessed the efficacy of oral fosfomycin therapy in a dynamic bladder infection in vitro model against eight E. faecalis and eight E. faecium isolates in synthetic human urine (SHU). To reflect the significant variability in fosfomycin urine concentrations among healthy individuals after oral dosing (11, 12), urinary exposures following a single simulated 3-g oral fosfomycin dose with high and low urinary exposures, and two doses given over two days with low urinary exposure, were simulated. Inhibition of regrowth and emergence of resistance were assessed.
RESULTS
In vitro susceptibility studies.
In total, 84 enterococci were screened for fosfomycin susceptibility using agar dilution, including 41 E. faecalis and 43 E. faecium. Forty-one (49%) isolates originated from blood cultures, 17 (20%) from wound cultures, and 15 (18%) from a urinary source. Isolates cultured from screening surveillance swabs were not assessed. Both species demonstrated relatively narrow MIC distributions with MIC50/90 of 32/64 μg/ml for E. faecalis and 64/128 μg/ml for E. faecium (Fig. 1). Sixteen isolates that represented the range of fosfomycin MIC values were selected for testing in the bladder infection model, including 14 clinical strains and 2 ATCC isolates (Table 1). The agreement between agar dilution and broth microdilution (BMD) MIC methods were examined, including the effect of alterations in the BMD liquid medium. MIC values were largely concordant between agar dilution and broth microdilution (BMD) performed in Mueller-Hinton broth (MHB) with 25 mg/liter G6P (Fig. 2a). There was no significant difference in MIC measurements when tested without G6P (Fig. 2b). MIC values were, on average, one dilution lower compared to agar dilution when tested in modified SHU (Table 2) (bias −0.9, 95% confidence interval [CI] −2.3 to 0.4), suggestive of an interplay between growth restriction and increased fosfomycin antimicrobial activity in this nutritionally deplete, acidic medium (Fig. 2c). Disk diffusion inhibition diameters were less than 24 mm in all isolates, and 4 isolates had zone sizes less than 16 mm (CLSI breakpoint: susceptible [S] at ≥16 mm) (Table 1). There was relatively poor linear correlation between inhibition diameter and agar dilution MIC (R2 0.5537) (Fig. 2d). No differences were found between the two species. All clinical E. faecium isolates were vancomycin resistant and contained either a vanA or vanB gene.
FIG 1.
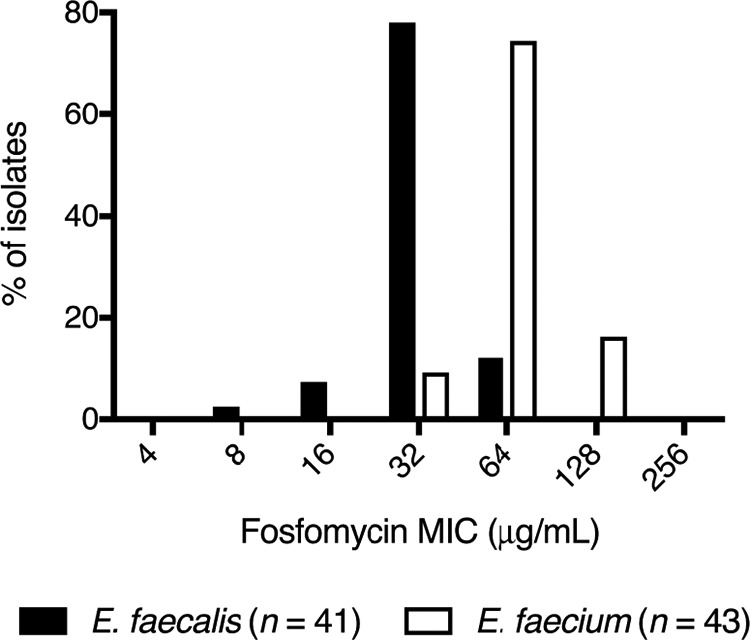
Enterococcal fosfomycin MIC distribution. E. faecalis (n = 41; black bars) and E. faecium (n = 43; white bars) isolates screened for susceptibility by agar dilution. E. faecalis MIC50/MIC90 = 32/64 μg/ml, E. faecium MIC50/MIC90 = 64/128 μg/ml.
TABLE 1.
Baseline fosfomycin susceptibility and growth outcomes in the bladder infection in vitro modea
| Strain | Source | Van geneb | Baseline fosfomycin susceptibility testing |
Change in bacterial counts (Δ log10 CFU/ml)c |
|||||||
|---|---|---|---|---|---|---|---|---|---|---|---|
| AD MIC (μg/ml) | BMD MIC (μg/ml) |
DD (mm) | Drug-free | High exposure |
Low exposure |
||||||
| MHB | MHB + G6P | SHU | Single dose | Single dose | Two doses, q24 | ||||||
| E. faecalis | |||||||||||
| 42601 | Urine | - | 8 | 4 | 8 | 8 | 23 | −1.2 | - | −1.7 | - |
| 36361 | Blood | - | 16 | 8 | 8 | 8 | 23 | 0.9 | −4.3 | −2.1 | −4.7 |
| 47130 | Urine | - | 32 | 64 | 64 | 16 | 23 | 1.7 | −3.7 | 1.4 | −4.9 |
| 16313 | Urine | - | 32 | 64 | 32 | 16 | 18 | 1.1 | −4.1 | 0.1 | - |
| 29212 | ATCC | - | 32 | 32 | 32 | 16 | 17 | 1.2 | −3.7 | 1.6 | −4.9 |
| 46182 | Blood | - | 64 | 32 | 64 | 32 | 19 | 1.6 | −2.7 | 0.7 | −4.8 |
| 46639 | Blood | - | 64 | 64 | 64 | 16 | 15 | 1.6 | −4.2 | −1.8 | −4.7 |
| 46222 | Blood | - | 64 | 64 | 64 | 32 | 12 | 1.6 | −3.2 | 2.0 | −3.6 |
| E. faecium | |||||||||||
| 44131 | Aspirate | A | 32 | 16 | 16 | 16 | 17 | −0.6 | - | - | - |
| 20143 | Blood | A | 32 | 32 | 32 | 32 | 18 | −1.0 | - | −3.9 | - |
| 12818 | Urine | A | 32 | 64 | 128 | 32 | 19 | −0.9 | - | −1.9 | - |
| 35667 | ATCC | - | 64 | 64 | 64 | 32 | 14 | 0.2 | −5.0 | −0.7 | - |
| 01976 | Urine | A | 64 | 32 | 32 | 16 | 19 | −1.6 | - | −1.7 | - |
| 20292 | Urine | B | 64 | 64 | 64 | 64 | 13 | −0.7 | - | −1.8 | −4.7 |
| 08582 | Urine | A | 64 | 128 | 64 | 32 | 14 | −1.2 | −4.7 | −1.1 | −4.1 |
| 14242 | Blood | A | 128 | 64 | 64 | 32 | 15 | −1.5 | - | - | - |
AD, agar dilution; BMD, broth microdilution; MHB, Mueller-Hinton broth; G6P, glucose-6-phosphate; SHU, synthetic human urine; DD, disk diffusion.
Symbol -, vanA and vanB gene not detected.
Change in total bacterial density from a starting inoculum of approximately 7.0 log10 CFU/ml after an 18 h drug free incubation, or 72 h incubation following fosfomycin exposure. Symbol -, no growth detected after 72 h incubation.
FIG 2.
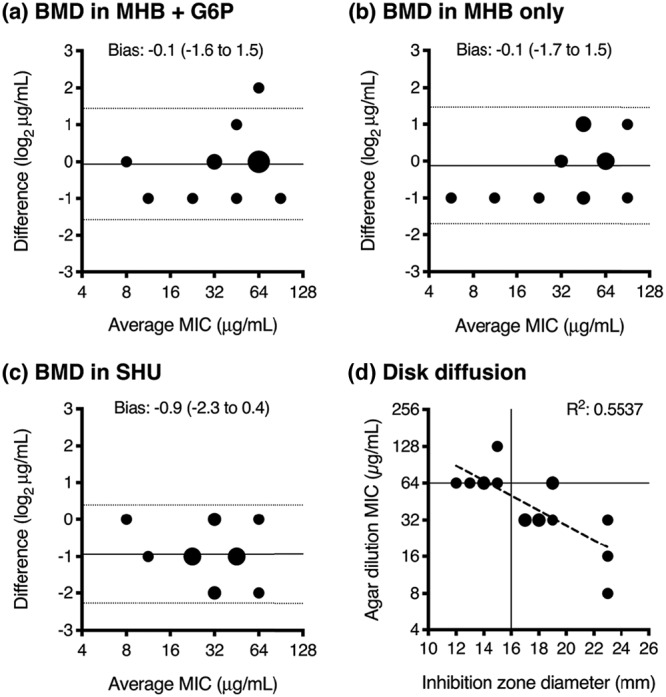
Comparison of fosfomycin susceptibility methods. Bland-Altman plots demonstrate the comparison between MIC values tested by agar dilution (AD) and broth microdilution (BMD) in MHB glucose-6-phosphate (G6P) (a), MHB alone (b), and synthetic human urine (SHU) (c), with the difference between the two MIC measurements (by AD and BMD) on the y axis, and the average of the two MIC measurements on the x axis. The bias (solid line) and 95% limits of agreement (dotted lines) are presented. Disk diffusion results (d) are compared to agar dilution MIC values, presented as a scattergram and analyzed by linear regression (dashed line), with the CLSI E. faecalis breakpoints highlighted (susceptible agar dilution MIC ≤64 μg/ml, disk diffusion inhibition zone diameter ≥16 mm). The larger circle sizes indicate a greater number of superimposed data points.
TABLE 2.
Modified synthetic human urine (SHU) chemical constituents
| Chemical name | Chemical formula | g/liter |
|---|---|---|
| Sodium chloride | NaCl | 5.844 |
| Sodium sulphate | Na2SO4 | 2.4147 |
| Urea | Urea | 16.8168 |
| Potassium chloride | KCl | 2.8329 |
| Calcium chloride | CaCl2 | 0.4439 |
| Creatinine | Creatinine | 1.0181 |
| Citric acid trisodium salt dihydrate | Na3C6H5O7 | 1.9999 |
| Ammonium chloride | NH4Cl | 1.0698 |
| Magnesium sulphate | MgSO4 | 0.3852 |
| Sodium oxalate | Na2C2O4 | 0.0241 |
| Sodium phosphate monobasic | NaH2PO4 | 0.5616 |
| Sodium phosphate dibasic | Na2HPO4 | 0.9227 |
| Potassium dihydrogen phosphate | KH2PO4 | 2.1774 |
| Uric acid | C5H4N4O3 | 0.1009 |
| Sodium bicarbonate | NaHCO3 | 1.1341 |
| Magnesium chloride hexahydrate | MgCl2·6H2O | 0.6506 |
| Lactic acid | C3H6O3 | 0.0991 |
| Ferrous sulfate heptahydrate | FeSO4·7H2O | 0.0014 |
| 20% (wt/vol) casamino acids | 0.1 % (vol/vol) | |
| 10% (wt/vol) yeast extract | 0.2 % (vol/vol) | |
| Proteose peptone no. 3a | 1.0 |
An additional component added to the published SHU recipe in order to additionally support E. faecium growth. Final pH adjusted to 5.6.
Comparative growth in urine and SHU.
Isolate growth capacity was calculated by quantifying the maximal bacterial density after overnight incubation in modified SHU and pooled female urine (FU) and compared to establish how well the synthetic medium matched the enterococcal growth kinetics in a urinary environment. Following 24 h static incubation in modified SHU, the eight selected E. faecalis isolates were able to increase their bacterial density from 5.0 ± 0.2 log10 CFU/ml to 7.0 ± 1.2 log10 CFU/ml, and the eight E. faecium isolates from 4.9 ± 0.1 log10 CFU/ml to 6.4 ± 0.8 log10 CFU/ml. This represented a greater growth restriction compared to incubation in FU, where E. faecalis isolates achieved a 24-h bacterial density of 7.8 ± 0.7 log10 CFU/ml and E. faecium isolates achieved 7.7 ± 0.4 log10 CFU/ml (Fig. 3a). There was also a greater variation in growth capacity between strains in modified SHU compared to FU (coefficient of variation [CV] of 13 to 17% versus 5 to 9%, respectively). When tested in fosfomycin time-kill assays, the E. faecalis and E. faecium ATCC strains demonstrated comparable fosfomycin activity in modified SHU compared with FU (Fig. 3b). Whereas, testing performed in MHB demonstrated greater drug-free growth capacity and reduced fosfomycin kill when exposed to 32 mg/liter. Given that the large media volume requirements for testing in the bladder infection model precluded the use of FU, which would require ethically approved collections, filter sterilization, and use within several days of collection, modified SHU was used in preference to standard laboratory media in order to better mimic the urinary environment.
FIG 3.

Impact of the medium on drug-free growth capacity and static time-kill assay. (a) Growth capacity of 8 E. faecalis (circles) and 8 E. faecium (squares) in pooled female urine (FU) and modified synthetic human urine (SHU). The average starting inoculum was 4.9 ± 0.2 log10 CFU/ml. Change in bacterial density was determined after 6 and 24 h of incubation. ns, not significant; **, P ≤ 0.01; ***, P ≤ 0.001. (b) Comparison of exposure-response curves of E. faecalis ATCC 29212 (circles) and E. faecium ATCC 35667 (squares) from the static time-kill assays performed in FU, modified SHU, and Mueller-Hinton broth (MHB). R2 >0.99 for all variable-slope Emax nonlinear regression lines.
Fosfomycin exposure in the bladder infection in vitro model.
The bladder infection in vitro model provides a dynamic simulation of urinary fosfomycin exposure, enabling the assessment of the response of bacterial pathogens inoculated within sixteen independent bladder compartments. Observed in vitro fosfomycin concentrations accurately reproduced the expected urinary exposures following a single 3-g oral dose with both high and low urinary concentrations, and following two doses given over two days with low urinary concentrations. The slope of the linear regression line was equal to 1.0 (R2 0.99) with a bias of 2.9% (95% CI −20.9 to 26.7%) (Fig. 4). Percentage variations were most apparent when target concentrations were at their lowest (i.e., <15 mg/liter). During each experiment, when all bladder compartments were sampled at the time of peak concentration, there was minimal intercompartment variability, with an average relative standard deviation of 4.4 ± 2.3%.
FIG 4.

Relationship between the observed and targeted fosfomycin concentrations in the bladder infection model. (a) Scattergram of observed fosfomycin concentrations compared to target values, with linear regression (solid line) and y = x (dashed line). (b) Bland-Altman plot of the percentage difference of the observed and target measurements (y axis) and the average of the two measurements (x axis) presented with the bias (solid line) and 95% limits of agreement (dotted lines).
Growth outcome in the bladder infection in vitro model.
Following drug-free dynamic incubation for 18 h in the bladder infection model, in modified SHU, all E. faecalis isolates demonstrated an increase in bacterial density from an average starting inoculum of 6.9 ± 0.1 log10 CFU/ml to 8.0 ± 1.0 log10 CFU/ml, except one strain (E. faecalis 42601) that had a reduction in bacterial density to 5.6 log10 CFU/ml (Fig. 5 and Table 1). In contrast, all E. faecium isolates had, on average, a reduction in their bacterial density from 6.7 ± 0.2 log10 CFU/ml to 5.8 ± 0.6 log10 CFU/ml (Fig. 5 and Table 1). Compared to static incubation, which had a lower starting inoculum (4.9 ± 0.2 log10 CFU/ml), the growth capacity (maximal bacterial density achieved) under dynamic conditions was higher for E. faecalis (static growth capacity: 7.0 ± 1.2 log10 CFU/ml), but lower for E. faecium (static growth capacity: 6.4 ± 0.8 log10 CFU/ml).
FIG 5.

Fosfomycin exposure and growth outcome in the bladder infection model. Fosfomycin was administered as a single dose with high urinary exposure (a), a single dose with low urinary exposure (b), or 2 doses given daily with low urinary exposure (c). Concentration time-curves present the average measured fosfomycin concentration (solid circles), overlaid on the target concentration curve (dashed line). Note that the target urinary concentration curves in (a) to (c) do not demonstrate a smooth drug elimination phase due to the dynamic fluid shifts that occur after each voiding cycle of the bladder compartment. The corresponding growth curves present the total growth of E. faecalis (solid circles) and E. faecium (open circles) isolates over time. Limit of detection (dotted line) was considered 50 CFU/ml. The gray lines and shading correspond to the average (±SD) growth in SHU of both E. faecalis and E. faecium isolates after 18 h of incubation in the bladder infection model without fosfomycin.
After a single fosfomycin dose mimicking high urinary exposure, at 72 h all isolates had ≥3 log10 kill, with low-level regrowth (bacterial counts ≤3.6 log10 CFU/ml) detected in 7 of 8 E. faecalis and 2 of 8 E. faecium isolates (Fig. 5 and Table 1). However, when urinary exposures were reduced to mimic low urinary concentrations, ≥3 log10 kill was only detected in 2 E. faecalis and 1 E. faecium (Fig. 5 and Table 1). All but one E. faecium isolate had detectable regrowth. Bacterial counts at 72 h were within 0.5 log10 of the growth measured in the drug-free control in 4 of 8 E. faecalis and 2 of 7 E. faecium. Notably, administering a second fosfomycin dose at 24 h, with the same low urinary exposure profile, afforded similar pharmacodynamic (PD) results as the single dose with high exposure, with all isolates having a ≥3 log10 kill (Fig. 5 and Table 1). Low-level regrowth (bacterial counts of ≤3.2 log10 CFU/ml) was detected in 6 of 8 E. faecalis and 2 of 8 E. faecium (Fig. 5 and Table 1).
Emergence of high-level resistance (growth on Mueller–Hinton II agar [MHA] with 1,024 mg/liter fosfomycin) was not detected in any isolate and there was no rise in fosfomycin MIC in any postexposure regrowth. A postexposure, low-level resistant subpopulation (growth on MHA with 256 mg/liter fosfomycin) was detected in only two E. faecalis isolates (strains 46222 and 46182) following the single fosfomycin dose with low exposure. The density of this resistant growth was minimal (approximately 102 CFU/ml). The fosfomycin MIC of these subpopulations were elevated (MIC 512 μg/ml) when testing was performed by agar dilution after subculture on drug-free blood agar.
Exposure-response PK/PD analysis.
Exposure-response curves, assessing fosfomycin exposure over 72 h, demonstrated that ƒ%T0-72 > MIC provided the most reliable pharmacokinetic/pharmacodynamic (PK/PD) index for the suppression of regrowth, followed by ƒAUC0-72/MIC (Fig. 6). The ƒCmax/MIC index generated the weakest relationship. There were significant differences between the two species, with E. faecalis isolates requiring greater drug exposures compared to E. faecium for a >3 log10 kill from the starting inoculum. The mean (95% CI) ƒAUC0-72/MIC and ƒ%T0-72 > MIC for 3 log10 kill for E. faecalis was 672 (462 to 1,081, R2 0.63) and 70% (66 to 73%, R2 0.89), compared to 216 (107 to 307, R2 0.67) and 51% (46 to 56%, R2 0.78) for E. faecium, respectively (Fig. 6a). These relationships and values were essentially unchanged when MIC measurements by BMD in MHB, or MHB with G6P, were used in the analysis (data not shown). When MIC measurements by BMD in modified SHU were used (Fig. 6b), the R2 values were all improved and the mean (95% CI) ƒAUC0-72/MIC and ƒ%T0-72 > MIC for 3 log10 kill for E. faecalis was 1,403 (1,108 to 1,832, R2 0.73) and 78% (75 to 81%, R2 0.92), compared to 425 (264 to 552, R2 0.73) and 56% (49 to 61%, R2 0.82) for E. faecium. In contrast, when assessing the fosfomycin exposure required to produce a 3 log10 kill from the drug-free growth capacity in the bladder infection model of each isolate, both E. faecalis and E. faecium returned similar responses. Analyzed together, the mean (95% CI) ƒAUC0-72/MIC and ƒ%T0-72 > MIC for 3 log10 kill from the growth capacity in SHU was 357 (276 to 458, R2 0.63) and 59% (54 to 64%, R2 0.62), applying agar dilution MIC measurements.
FIG 6.

Exposure-response relationship in the bladder infection model. Fosfomycin exposure assessed by ƒAUC0–72/MIC, ƒCmax/MIC and ƒ%T0–72 > MIC. The data are presented with agar dilution MIC values (a) and MIC values by broth microdilution (BMD) performed in modified synthetic human urine (SHU) (b). Variable slope Emax nonlinear regression lines are shown for E. faecalis (EFS, solid circles and solid lines) and E. faecium (EFM, open circles and dashed lines). All nonlinear regression lines were compared by F test and found to be significantly different (P ≤ 0.001).
DISCUSSION
Following the dynamic simulation of oral fosfomycin treatment for enterococcal UTIs, bacterial kill (>3 log10) and suppression of regrowth was promoted in the majority of isolates following high urinary exposures after a single dose, and after two doses given over two days in the setting of lower urinary exposures. Low-level and sustained regrowth post-fosfomycin exposure was related to isolate persistence, rather than emergence of resistance, supporting the reported bacteriostatic activity of fosfomycin against enterococci (22). Overall, E. faecalis isolates required greater fosfomycin exposure, relative to MIC, to promote kill compared with E. faecium (672 versus 216 ƒAUC0-72/MIC, respectively). However, the greater growth restriction in modified SHU seen for the E. faecium isolates (1 log10 kill in drug-free SHU) would impact upon their kill/growth outcomes. Therefore, the lower fosfomycin exposure index required for 3 log10 kill from the starting inoculum in E. faecium is likely due to both the additional killing effect of the modified SHU medium itself and the reduced growth capacity under dynamic conditions, thereby shifting the E. faecium drug-exposure-effect curves to the left of those of E. faecalis.
The impact of the laboratory medium on bacterial growth kinetics and antimicrobial activity is an important factor when translating in vitro results to humans. The availability of nutritional factors has been demonstrated to impact upon the MIC and exposure-response values (23). Compared to standard laboratory media, nutritional factors can be reduced in vivo, and cannot only promote a slower growth but can also result in greater antimicrobial kill. This is especially relevant for infections involving the urinary tract, where normal urodynamics of the constant bladder filling and intermittent voiding has an important role in bacterial clearance. Infecting bacteria within the bladder must maintain a sufficient growth rate in the urine biomatrix to maintain a sufficient bacterial density to promote clinical infection, despite the constant dilution and elimination by urination. We demonstrate that enterococcal growth, especially that of E. faecium, is restricted in modified SHU, which is a nutrient-deplete medium specifically designed to mimic human urine (24, 25). This suggests that the use of SHU to truly reflect E. faecium bacteriuric potential and response to antimicrobial therapy may be limited. The use of this medium, however, still offers distinct advantages over standard nutrient-rich laboratory media when simulating UTIs.
Molecular mechanisms for fosfomycin resistance among enterococci include the plasmid enzymatic inactivation gene (fosB) and acquired mutations in the active site of UDP-N-acetylglucosamine enolpyruyl transferase (Cys119Asp), both of which result in a rise in MIC to >1,024 mg/liter (26–28). In our model, however, despite the detection of postexposure regrowth, there was no rise in fosfomycin MIC. This is in contrast to other studies that have examined fosfomycin efficacy against E. coli, Klebsiella pneumoniae, and Pseudomonas aeruginosa, where fosfomycin efficacy was greatly impacted by baseline heteroresistance and demonstrated postexposure emergence of resistance (29–32). It is uncertain, however, if the lack of resistance observed in our study was affected by the medium environment (24), or if this is reflective of the bacteriostatic activity of fosfomycin reported for enterococci (22). The adaptation of enterococci during antibiotic exposure in this nutrient-restricted media may induce a fitness cost that limits the growth rate. Alternatively, the environment could induce a structural or metabolic change promoting persistence over the emergence of resistance (33, 34). Furthermore, enterococcal biofilm production within the in vitro model could shield a subpopulation of the bacterial inoculum to the effects of fosfomycin, and thereby seed the regrowth population when fosfomycin concentrations fall below the MIC of the isolate.
In clinical practice, the identification of an Enterococcus spp. from a urine culture may not reflect a true infection and may represent contaminating normal flora (35). When treatment is indicated, oral antimicrobial options active against Enterococcus spp. are limited. Similar to fosfomycin, aminopenicillins achieve high urinary concentrations and have been reported to overcome the resistance mechanisms in enterococci and provide a therapeutic option, despite a laboratory report of nonsusceptibility (36, 37). Nitrofurantoin is another active oral antimicrobial option, although activity is largely limited to E. faecalis isolates (38–40). Other oral options, albeit with limitations, include linezolid (toxicity risk), quinupristin-dalfopristin (E. faecium only), nitroxoline (not widely available), newer fluoroquinolones (moxifloxacin, gatifloxacin, gemifloxacin; toxicity risk) and doxycycline (effective in the setting of high urinary concentrations; synergy reported in combination with fosfomycin) (19, 39, 41–47).
A strength of this research is the use of a dynamic in vitro model to accurately simulate a range of urinary fosfomycin exposures while mimicking human urodynamics. Given the wide variability reported in human fosfomycin urinary concentrations, establishing the most relevant dynamic concentration to simulate poses a great challenge. It is unclear how differences in urinary fosfomycin exposure may impact antimicrobial efficacy. Much of this variation is likely due to individual behaviors, such as bladder emptying kinetics, fluid intake, urinary output, and the timing of the oral fosfomycin dose. In this study, two different exposure parameters were targeted from published healthy human data (11, 12). Wenzler et al. have subsequently published a phase 1 study of daily and alternate-daily dosing of oral fosfomycin (13). From these data the authors report that oral fosfomycin undergoes flip-flop kinetics, where excretion is limited by a slow absorption half-life. They also report urine fosfomycin concentrations at 48 h to be 45.2 ± 84.2 mg/liter after a single dose, and 312.7 ± 263.3 mg/liter after two daily doses. The wide range in standard deviations indicates large intersubject variability. In our model, the simulated fosfomycin concentrations at 48 h were as follows: high urine exposure (single dose) 65.5 mg/liter; low urine exposure (single dose) 12.6 mg/liter; low urine exposure (two daily doses) 188.8 mg/liter. Therefore, by simulating a wide range of different urinary exposures, we would expect to cover the majority of fosfomycin exposures expected to be seen in healthy individuals.
The important PK/PD index for fosfomycin efficacy in Enterobacterales has been reported to be ƒUC/MIC (48), and similarly for P. aeruginosa, where ƒAUC/MIC was pharmacodynamically linked as the driver for bacterial cell kill but with a time-dependence as the driver for resistance suppression (49). In our model, the PK/PD index associated with 3 log10 kill was best described by maintaining urinary fosfomycin concentrations above the MIC for approximately 36 h (E. faecium) to 48 h (E. faecalis). Similarly, this was achieved by an ƒAUC0-72/MIC between 216 (E. faecium) and 672 (E. faecalis). However, our data were not designed as a dose fractionation study, but as a reflection of real-life prescribing practices. This is particularly relevant given that two of the three fosfomycin dosing regimens studied were as a single dose, which causes all PK/PD indices to be intrinsically linked with each other. In order to extrapolate these data to humans, urinary fosfomycin PK following standard dosing should be considered, together with the expected fosfomycin susceptibility among enterococcal isolates. Given that the average peak urinary concentrations (ƒAUC0-24) can range between 600 mg/liter (8,000 mg · h/liter) (13) and 1,982 mg/liter (20,000 mg · h/liter) (11), while urinary concentrations are maintained at >32 mg/liter for 48 h in the majority of subjects, one would expect that many E. faecalis and E. faecium isolates (reported MIC50 32 and 64 μg/ml, respectively) (7, 8, 10, 26, 50, 51) would be adequately treated following standard oral fosfomycin therapy in an immunocompetent individual. However, where lower urinary fosfomycin exposures are expected, such as in the setting of increased fluid intake and high urinary volume output, or with an isolate with a higher MIC value (reported MIC90 64 and 128 μg/ml for E. faecalis and E. faecium isolates), administration of a repeated daily dose (or multiple daily dosing), could better ensure PK/PD targets would be achieved. Given the known variability in urinary fosfomycin PK, and that lowering the current clinical breakpoint (CLSI: susceptible MIC ≤64 μg/ml for E. faecalis) would risk splitting the wild-type population of both Enterococcal spp., changing the dosing recommendations to support repeated daily doses may increase the likelihood that a susceptible result from the diagnostic laboratory would confidently predict clinical efficacy.
This dynamic bladder infection model is limited by the lack of an immune system and the tissue structure found in the human bladder. Given the impracticalities of using pooled human urine for the in vitro media, using a well-characterized synthetic alternative was chosen over the use of a nutrient-rich laboratory media. However, the chemical components included in the modified SHU used in these experiments may still not reflect the true in vivo situation and enterococcal growth kinetics. Further work would benefit learning how best to match enterococcal growth kinetics in human urine with specific variations in the chemical components in a further modified SHU recipe. It is also uncertain what would be the impact of the changes observed in the chemical composition of urine in patients with, or at risk of, UTIs, and how to best simulate these situations. Finally, our PK/PD analysis is limited by the fosfomycin exposures tested, and further studies would be required to fully support the quantitative targets recommended.
Overall, oral fosfomycin appears to display reasonable activity against Enterococcus spp. in a bladder infection model. Similar rates of regrowth suppression were found following a single 3-g dose with high fosfomycin urinary concentrations as followed two doses with lower urinary concentrations. Future in vitro research should examine any benefit of administering several daily doses of fosfomycin. The role of combination therapy of fosfomycin with amoxicillin, or fosfomycin with doxycycline, given that in vitro synergy has been reported (22, 47), would be of further interest.
MATERIALS AND METHODS
Antibiotics and media.
Fosfomycin (Fomicyt, InfectoPharm, Germany) was used in the in vitro model and for medium production, reconstituted to a concentration of 50,000 mg/liter and frozen at –80°C. Trypticase soy agar containing 5% sheep blood (TSA) (Becton, Dickinson, USA) was used for subculturing isolates from freezer stock. Mueller–Hinton II agar (MHA) (BD) was used for quantification of bacterial density. MHA with fosfomycin added was used for agar dilution susceptibility testing and screening for fosfomycin resistance by quantifying growth on medium containing 256 mg/liter fosfomycin (low-level resistance, LLR) or with 1,024 mg/liter fosfomycin (high-level resistance, HLR). All media to which fosfomycin was added contained 25 mg/liter glucose-6-phosphate (G6P) (G7879-5G, Sigma–Aldrich, USA).
A modified recipe for synthetic human urine (SHU) (25) was used (Table 2) as the liquid medium for broth microdilution (BMD) susceptibility testing, growth control experiments, and as the substitute for human urine in the bladder infection in vitro model. This medium provided advantages over donated pooled human urine, given the large volumes of liquid medium required, method of preparation, reproducible chemical composition between batches, and longer shelf-life. The chemical components of SHU have been previously published with casamino acids and yeast extract added to support the growth of E. faecalis isolates (52). However, E. faecium isolates failed to grow in this supplemented SHU and required further modification by the addition of proteose peptone, a supplement used in an alternate published synthetic urine medium termed artificial urine medium (AUM) (53). The final constituents of the modified SHU used for all experiments included 20% (wt/vol) casamino acids (BD), 10% (wt/vol) yeast extract (BD), and 1 g/liter proteose peptone no. 3 (BD), with the final pH adjusted to 5.6. Pooled female urine (FU) was used as a comparison for static growth and time-kill assays. Urine was collected from 12 healthy female volunteers after ethical committee approval (Medisch Ethische Toetsings Commissie, METC-2018-1186), pooled equally by volume, filter sterilized through a 0.22-μm filter system (Thermo Fisher Scientific Nalgene Rapid-Flow disposable filters, USA) and kept at –20°C until use.
Bacterial strains and in vitro susceptibility.
Nonconsecutive, clinical E. faecalis and E. faecium isolates from patient samples were identified from the hospital diagnostic database with ethical committee approval (METC-2015-206). Rectal screening isolates were not included. Isolates underwent fosfomycin susceptibility by agar dilution MIC testing following the reference method (54). E. coli ATCC 25922 was used as the quality control organism. A selection of sixteen isolates (including 2 ATCC strains, E. faecalis ATCC 29212 and E. faecium ATCC 35667) were chosen to be tested in the bladder infection in vitro model, representing the range of baseline fosfomycin MIC values. Species identification was confirmed by matrix-assisted laser desorption ionization–time of flight mass spectrometry (MALDI-TOF MS; Bruker Daltonik GmbH, Germany). Additional fosfomycin susceptibility testing was performed on the 16 selected isolates, including disk diffusion using FOT200 disk (Oxoid Ltd./Thermo Fisher Scientific, UK) and BMD MIC testing following reference methodology applicable to other antimicrobial agents (54), performed in MHB, MHB with G6P, and in modified SHU. MIC values determined by agar dilution were performed in triplicate, with the median result reported. Isolate DNA was extracted using the MagNA Pure 96 system, and the Roche LightCycler 480 instrument was used to identify the presence of vanA and vanB genes using in-house primer and probe sequences. In each run, positive controls (VanA E. faecium, VanB E. faecalis), a negative control (sterile saline), and an internal control (Phocine herpesvirus, PhHV) were included.
Static growth and time-kill assay.
The sixteen selected isolates underwent assessment of drug-free growth capacity in modified SHU compared with FU. The growth capacity was considered the maximal bacterial density achieved after overnight incubation in drug-free media. Bacterial inocula were prepared from a fresh overnight culture from freezer stock onto TSB, from which a 0.5 McFarland suspension was serially diluted to a starting inoculum of 105 CFU/ml. Each isolate was incubated in 10 ml of both FU and modified SHU at 37°C with shaking (200 rpm). Assessment of bacterial growth was performed at 6 and 24 h. E. faecalis ATCC 29212 and E. faecium ATCC 35667 were additionally assessed in static fosfomycin time-kill assays (TKA), comparing the activity of fosfomycin in FU, modified SHU, and MHB. Bacterial inocula were prepared by the same method described above and were exposed to fosfomycin at four different concentrations (8, 32, 128, and 512 mg/liter) together with a drug-free control tube. TKA tubes were incubated at 37°C with shaking (200 rpm). Bacterial density was assessed after 1, 3, 6, and 24 h of incubation. To account for antibiotic carryover, all samples (500 μl) underwent centrifugation (5 min 12,500 × g), removal of the supernatant, and addition of phosphate-buffered saline. This centrifuge and washing process was performed twice prior to plating.
Dynamic bladder infection in vitro model.
The dynamic bladder in vitro model was used to simulate urinary antimicrobial concentration changes by modeling tandem first-order processes and applying drug distribution equations, while concurrently simulating normal human urodynamics. This model has been previously applied to fosfomycin efficacy against E. coli, Klebsiella pneumoniae, Enterobacter cloacae, and Pseudomonas aeruginosa pathogens (30, 55), the examination of multiple repeat doses and different urinary exposures (56), and the effect of running the model with pooled human urine and synthetic alternatives (24). The in vitro setup consists of a reservoir that delivers fresh medium at a constant rate into the gastrointestinal compartment, in which fosfomycin is administered. Peristaltic pumps control matching flow rates to simulate rapid fosfomycin absorption, systemic distribution, and elimination into sixteen bladder compartments run in parallel. Bladder compartments were voided six-times per day by a timed peristaltic pump program, reducing the contents within each compartment (medium and bacteria) to a postvoid residual volume of approximately 3 ml. Dynamic urinary fosfomycin exposures were simulated following a 3-g oral dose. Test isolates were added to each bladder compartment at an inoculum of 107 CFU/ml to provide an equivalent total number of bacteria expected in human infections (i.e., >105 CFU/ml in an average 250 ml void). Drug-free growth capacity was determined following 18 h of incubation within the bladder infection model without the addition of fosfomycin. Subsequently, pathogen growth and emergence of resistance was assessed in response to different simulated urinary fosfomycin exposures over 72 h by quantitative cultures on drug-free and fosfomycin-containing (256 and 1,024 mg/liter) MHA. Given the large inter- and intrasubject variability reported in urinary fosfomycin concentrations, two different PK exposures following a single 3-g oral dose were simulated, namely, a peak urinary concentration of 1,982.0 mg/liter at 7.5 h (11), compared to a peak of 1,040 mg/liter at 4 h (12). The impact of administering a second 3-g dose of fosfomycin at 24 h in the setting of the lower urinary exposure was also examined.
In vitro sample processing.
Samples were taken directly from each bladder compartment at the predetermined time points. Quantitative cultures for PD assessments were processed immediately, with bacterial density (CFU/ml) calculated at each time point. Specifically, medium from the outflow tract of each bladder compartment was sampled and underwent serial 10-fold dilutions, from which 20 μl of each dilution was plated onto drug-free MHA, or MHA with 256 or 1,024 mg/liter of fosfomycin. The lower limit of detection was considered to be 50 CFU/ml. All plates were incubated aerobically at 37°C for 16 to 20 h. Plates supplemented with fosfomycin were reincubated for a further 24 h to confirm colony counts. The fosfomycin MIC of any regrowth at 72 h was rechecked by agar dilution after subculture to TSB.
Samples for fosfomycin concentration quantification, which first underwent a 1:10 dilution with saline when concentrations were expected to be above the upper limit of the assay, were frozen at –80°C until testing. An ultraperformance liquid chromatography-tandem mass spectrometry (UPLC-MS-MS) method was used (57). The UPLC-MS-MS method was validated for urine and plasma samples of fosfomycin, but additional tests confirmed its applicability for fosfomycin in SHU samples. The stability of fosfomycin in SHU at 37°C for 72 h, and stored at –80°C for at least 6 months, was confirmed (data not shown). The method was validated according to FDA guidelines for bioanalytical method validations (58), over a range of 0.75 to 375 mg/liter (R2 0.9998). The lower limit of quantification was 0.75 mg/liter and the lower limit of detection was 0.70 mg/liter. The method was found to be accurate and precise with a maximum deviation of 5.0%. During experimentation, all bladder compartments were sampled at the peak concentration time point, providing an assessment accuracy and intercompartment variation. At the remaining time points, three bladder compartments were sampled before and after the peak concentration, and at 24, 48, and 72 h, thereby providing representative concentrations changes over time. All measured concentrations were compared to the target determined by PK drug distribution equations (59).
Statistical and PK/PD analyses.
(i) MIC comparisons. The bias between MIC susceptibility measurements by BMD compared to agar dilution was calculated using the method described by Bland and Altman on log2-transformed MIC data (60), with a negative bias value representing the degree that BMD measurements underestimate the MIC compared to agar dilution, with a 95% confidence interval.
(ii) Static time-kill curves. Growth capacity in FU and modified SHU at 6 h and 24 h were compared with Student’s paired t test for each species. Fosfomycin concentration–effect curves were analyzed with nonlinear regression analysis using the variable slope sigmoid Emax model, with the line parameters (top, bottom, EC50, and Hill slope) in MHB, FU, and SHU compared with the F tests.
(iii) Dynamic time-kill curves. In the bladder infection in vitro model, the accuracy of the observed fosfomycin concentrations was determined by linear regression and Bland-Altman analysis in terms of bias and precision. Exposure-response relationships were analyzed using the total predicted free drug area-under-concentration-time curve (ƒAUC0–72), the measured free drug maximal concentration (ƒCmax) and the predicted percentage of time that free drug concentrations were maintained above the MIC of the isolate (ƒ%T0-72 > MIC). Relationships were compared using MIC measurements obtained by agar dilution and BMD. Nonlinear regression was performed using a variable slope Emax model, assessing the bacteria counts in the drug-free control and following the different fosfomycin exposures. Curves were constrained by the lower limit of bacterial count quantification as the bottom parameter and compared statistically using the F test. The 50% effective PK/PD index (EI50) and drug exposures associated with 3 log10 kill were determined. Where appropriate the data are presented as means ± SD. All analyses were performed with GraphPad Prism (version 7.0b, MAC OS X).
ACKNOWLEDGMENTS
We acknowledge the laboratory assistance of Carla Roodbol de Goeij (Department of Medical Microbiology and Infectious Diseases, Research and Development Unit, Erasmus Medical Centre).
I.J.A. was funded by an Australian Government Research Training Program Scholarship (APP1114690) from the National Health and Medical Research Council of Australia. A.Y.P. and J.A.R. are funded partly through Australian National Health and Medical Research Council Practitioner Fellowships (APP1117940 and APP1117065, respectively).
J.W.M. has received research funding from Adenium, AstraZeneca, Basilea, Cubist, Polyphor, Roche, Eumedica, Basilea, VenatorX, AiCuris, Gilead, and Wockhardt. A.Y.P. has received research funding from MSD through an investigator-initiated research project. J.A.R. has received funding from MSD, Accelerate Diagnostics, bioMérieux, Pfizer, and The Medicines Company. All other authors have no conflicts to declare.
REFERENCES
- 1.Flores-Mireles AL, Walker JN, Caparon M, Hultgren SJ. 2015. Urinary tract infections: epidemiology, mechanisms of infection and treatment options. Nat Rev Microbiol 13:269–284. doi: 10.1038/nrmicro3432. [DOI] [PMC free article] [PubMed] [Google Scholar]
- 2.Tandogdu Z, Wagenlehner FM. 2016. Global epidemiology of urinary tract infections. Curr Opin Infect Dis 29:73–79. doi: 10.1097/QCO.0000000000000228. [DOI] [PubMed] [Google Scholar]
- 3.Kline KA, Lewis AL. 2016. Gram-positive uropathogens, polymicrobial urinary tract infection, and the emerging microbiota of the urinary tract. Microbiol Spectr 4. doi: 10.1128/microbiolspec.UTI-0012-2012. [DOI] [PMC free article] [PubMed] [Google Scholar]
- 4.Garcia-Solache M, Rice LB. 2019. The Enterococcus: a model of adaptability to its environment. Clin Microbiol Rev 32:e00058-18. doi: 10.1128/CMR.00058-18. [DOI] [PMC free article] [PubMed] [Google Scholar]
- 5.Asadollahi P, Razavi S, Asadollahi K, Pourshafie MR, Talebi M. 2018. Rise of antibiotic resistance in clinical enterococcal isolates during 2001–2016 in Iran: a review. New Microbes New Infect 26:92–99. doi: 10.1016/j.nmni.2018.08.018. [DOI] [PMC free article] [PubMed] [Google Scholar]
- 6.Lebreton F, van Schaik W, McGuire AM, Godfrey P, Griggs A, Mazumdar V, Corander J, Cheng L, Saif S, Young S, Zeng Q, Wortman J, Birren B, Willems RJ, Earl AM, Gilmore MS. 2013. Emergence of epidemic multidrug-resistant Enterococcus faecium from animal and commensal strains. mBio 4:e00534-13. doi: 10.1128/mBio.00534-13. [DOI] [PMC free article] [PubMed] [Google Scholar]
- 7.Allerberger F, Klare I. 1999. In-vitro activity of fosfomycin against vancomycin-resistant enterococci. J Antimicrob Chemother 43:211–217. doi: 10.1093/jac/43.2.211. [DOI] [PubMed] [Google Scholar]
- 8.Perri MB, Hershberger E, Ionescu M, Lauter C, Zervos MJ. 2002. In vitro susceptibility of vancomycin-resistant enterococci (VRE) to fosfomycin. Diagn Microbiol Infect Dis 42:269–271. doi: 10.1016/S0732-8893(02)00370-X. [DOI] [PubMed] [Google Scholar]
- 9.Superti S, Dias CAG, d'Azevedo PA. 2009. In vitro fosfomycin activity in vancomycin-resistant Enterococcus faecalis. Braz J Infect Dis 13:123–124. doi: 10.1590/S1413-86702009000200010. [DOI] [PubMed] [Google Scholar]
- 10.Zhanel GG, Walkty AJ, Karlowsky JA. 2016. Fosfomycin: a first-line oral therapy for acute uncomplicated cystitis. Can J Infect Dis Med Microbiol 2016:1–10. doi: 10.1155/2016/2082693. [DOI] [PMC free article] [PubMed] [Google Scholar]
- 11.Wijma RA, Koch BCP, van Gelder T, Mouton JW. 2018. High interindividual variability in urinary fosfomycin concentrations in healthy female volunteers. Clin Microbiol Infect 24:528–532. doi: 10.1016/j.cmi.2017.08.023. [DOI] [PubMed] [Google Scholar]
- 12.Wenzler E, Ellis-Grosse EJ, Rodvold KA. 2017. Pharmacokinetics, safety, and tolerability of single-dose intravenous (ZTI-01) and oral fosfomycin in healthy volunteers. Antimicrob Agents Chemother 61:e00775-17. doi: 10.1128/AAC.00775-17. [DOI] [PMC free article] [PubMed] [Google Scholar]
- 13.Wenzler E, Bleasdale SC, Sikka M, Bunnell KL, Finnemeyer M, Rosenkranz SL, Danziger LH, Rodvold KA, Antibacterial Resistance Leadership Group . 2018. Phase I study to evaluate the pharmacokinetics, safety, and tolerability of two dosing regimens of oral fosfomycin tromethamine in healthy adult participants. Antimicrob Agents Chemother 62:e00464-18. doi: 10.1128/AAC.00464-18. [DOI] [PMC free article] [PubMed] [Google Scholar]
- 14.Forest Pharmaceuticals, Inc. 2011. Monurol (fosfomycin tromethamine) package insert. Forest Pharmaceuticals, Inc, St Louis, MO: https://www.accessdata.fda.gov/drugsatfda_docs/label/2011/050717s007lbl.pdf. [Google Scholar]
- 15.Giancola SE, Mahoney MV, Hogan MD, Raux BR, McCoy C, Hirsch EB. 2017. Assessment of fosfomycin for complicated or multidrug-resistant urinary tract infections: patient characteristics and outcomes. Chemotherapy 62:100–104. doi: 10.1159/000449422. [DOI] [PubMed] [Google Scholar]
- 16.Seroy JT, Grim SA, Reid GE, Wellington T, Clark NM. 2016. Treatment of MDR urinary tract infections with oral fosfomycin: a retrospective analysis. J Antimicrob Chemother 71:2563–2568. doi: 10.1093/jac/dkw178. [DOI] [PubMed] [Google Scholar]
- 17.Neuner EA, Sekeres J, Hall GS, van Duin D. 2012. Experience with fosfomycin for treatment of urinary tract infections due to multidrug-resistant organisms. Antimicrob Agents Chemother 56:5744–5748. doi: 10.1128/AAC.00402-12. [DOI] [PMC free article] [PubMed] [Google Scholar]
- 18.Wang JL, Hsueh PR. 2009. Therapeutic options for infections due to vancomycin-resistant enterococci. Expert Opin Pharmacother 10:785–796. doi: 10.1517/14656560902811811. [DOI] [PubMed] [Google Scholar]
- 19.Mercuro NJ, Davis SL, Zervos MJ, Herc ES. 2018. Combatting resistant enterococcal infections: a pharmacotherapy review. Expert Opin Pharmacother 19:979–992. doi: 10.1080/14656566.2018.1479397. [DOI] [PubMed] [Google Scholar]
- 20.Clinical and Laboratory Standards Institute. 2019. Performance standards for antimicrobial susceptibility testing; 29th edition. CLSI M100. Clinical and Laboratory Standards Institute, Wayne, PA. [Google Scholar]
- 21.EUCAST. 2019. Breakpoint tables for interpretation of MICs and zone diameters, version 9.0, 2019. http://www.eucast.org/clinical_breakpoints/.
- 22.Descourouez JL, Jorgenson MR, Wergin JE, Rose WE. 2013. Fosfomycin synergy in vitro with amoxicillin, daptomycin, and linezolid against vancomycin-resistant Enterococcus faecium from renal transplant patients with infected urinary stents. Antimicrob Agents Chemother 57:1518–1520. doi: 10.1128/AAC.02099-12. [DOI] [PMC free article] [PubMed] [Google Scholar]
- 23.Mouton JW. 2018. Soup with or without meatballs: impact of nutritional factors on the MIC, kill-rates and growth-rates. Eur J Pharm Sci 125:23–27. doi: 10.1016/j.ejps.2018.09.008. [DOI] [PubMed] [Google Scholar]
- 24.Abbott IJ, van Gorp E, Wijma RA, Meletiadis J, Mouton JW, Peleg AY. 2020. Evaluation of pooled human urine and synthetic alternatives in a dynamic bladder infection in vitro model simulating oral fosfomycin therapy. J Microbiol Methods 171:105861. doi: 10.1016/j.mimet.2020.105861. [DOI] [PubMed] [Google Scholar]
- 25.Ipe DS, Horton E, Ulett GC. 2016. The basics of bacteriuria: strategies of microbes for persistence in urine. Front Cell Infect Microbiol 6:14. doi: 10.3389/fcimb.2016.00014. [DOI] [PMC free article] [PubMed] [Google Scholar]
- 26.Guo Y, Tomich AD, McElheny CL, Cooper VS, Tait-Kamradt A, Wang M, Hu F, Rice LB, Sluis-Cremer N, Doi Y. 2017. High-level fosfomycin resistance in vancomycin-resistant Enterococcus faecium. Emerg Infect Dis 23:1902–1904. doi: 10.3201/eid2311.171130. [DOI] [PMC free article] [PubMed] [Google Scholar]
- 27.Xu X, Chen C, Lin D, Guo Q, Hu F, Zhu D, Li G, Wang M. 2013. The fosfomycin resistance gene fosB3 is located on a transferable, extrachromosomal circular intermediate in clinical Enterococcus faecium isolates. PLoS One 8:e78106. doi: 10.1371/journal.pone.0078106. [DOI] [PMC free article] [PubMed] [Google Scholar]
- 28.Sun L, Zhang P, Qu T, Chen Y, Hua X, Shi K, Yu Y. 2017. Identification of novel conjugative plasmids with multiple copies of fosB that confer high-level fosfomycin resistance to vancomycin-resistant enterococci. Front Microbiol 8:1541. doi: 10.3389/fmicb.2017.01541. [DOI] [PMC free article] [PubMed] [Google Scholar]
- 29.VanScoy B, McCauley J, Bhavnani SM, Ellis-Grosse EJ, Ambrose PG. 2016. Relationship between fosfomycin exposure and amplification of Escherichia coli subpopulations with reduced susceptibility in a hollow-fiber infection model. Antimicrob Agents Chemother 60:5141–5145. doi: 10.1128/AAC.00355-16. [DOI] [PMC free article] [PubMed] [Google Scholar]
- 30.Abbott IJ, Meletiadis J, Belghanch I, Wijma RA, Kanioura L, Roberts JA, Peleg AY, Mouton JW. 2018. Fosfomycin efficacy and emergence of resistance among Enterobacteriaceae in an in vitro dynamic bladder infection model. J Antimicrob Chemother 73:709–719. doi: 10.1093/jac/dkx441. [DOI] [PubMed] [Google Scholar]
- 31.Walsh CC, McIntosh MP, Peleg AY, Kirkpatrick CM, Bergen PJ. 2015. In vitro pharmacodynamics of fosfomycin against clinical isolates of Pseudomonas aeruginosa. J Antimicrob Chemother 70:3042–3050. doi: 10.1093/jac/dkv221. [DOI] [PubMed] [Google Scholar]
- 32.Ballestero-Téllez M, Docobo-Pérez F, Rodríguez-Martínez JM, Conejo MC, Ramos-Guelfo MS, Blázquez J, Rodríguez-Baño J, Pascual A. 2017. Role of inoculum and mutant frequency on fosfomycin MIC discrepancies by agar dilution and broth microdilution methods in Enterobacteriaceae. Clin Microbiol Infect 23:325–331. doi: 10.1016/j.cmi.2016.12.022. [DOI] [PubMed] [Google Scholar]
- 33.Brauner A, Fridman O, Gefen O, Balaban NQ. 2016. Distinguishing between resistance, tolerance and persistence to antibiotic treatment. Nat Rev Microbiol 14:320–330. doi: 10.1038/nrmicro.2016.34. [DOI] [PubMed] [Google Scholar]
- 34.Levin-Reisman I, Brauner A, Ronin I, Balaban NQ. 2019. Epistasis between antibiotic tolerance, persistence, and resistance mutations. Proc Natl Acad Sci U S A 116:14734–14739. doi: 10.1073/pnas.1906169116. [DOI] [PMC free article] [PubMed] [Google Scholar]
- 35.Hooton TM, Roberts PL, Cox ME, Stapleton AE. 2013. Voided midstream urine culture and acute cystitis in premenopausal women. N Engl J Med 369:1883–1891. doi: 10.1056/NEJMoa1302186. [DOI] [PMC free article] [PubMed] [Google Scholar]
- 36.Cole KA, Kenney RM, Perri MB, Dumkow LE, Samuel LP, Zervos MJ, Davis SL. 2015. Outcomes of aminopenicillin therapy for vancomycin-resistant enterococcal urinary tract infections. Antimicrob Agents Chemother 59:7362–7366. doi: 10.1128/AAC.01817-15. [DOI] [PMC free article] [PubMed] [Google Scholar]
- 37.Shah KJ, Cherabuddi K, Shultz J, Borgert S, Ramphal R, Klinker KP. 2018. Ampicillin for the treatment of complicated urinary tract infections caused by vancomycin-resistant Enterococcus spp (VRE): a single-center university hospital experience. Int J Antimicrob Agents 51:57–61. doi: 10.1016/j.ijantimicag.2017.06.008. [DOI] [PubMed] [Google Scholar]
- 38.Butt T, Leghari MJ, Mahmood A. 2004. In-vitro activity of nitrofurantoin in enterococcus urinary tract infection. J Pak Med Assoc 54:466–469. [PubMed] [Google Scholar]
- 39.Heintz BH, Halilovic J, Christensen CL. 2010. Vancomycin-resistant enterococcal urinary tract infections. Pharmacotherapy 30:1136–1149. doi: 10.1592/phco.30.11.1136. [DOI] [PubMed] [Google Scholar]
- 40.Wijma RA, Fransen F, Muller AE, Mouton JW. 2019. Optimizing dosing of nitrofurantoin from a PK/PD point of view: what do we need to know? Drug Resist Updat 43:1–9. doi: 10.1016/j.drup.2019.03.001. [DOI] [PubMed] [Google Scholar]
- 41.Takahashi S, Ebisu H, Hirose T, Sano M, Nishimura M, Hirai K, Tsukamoto T, Hosaka M. 2000. Bactericidal activity of gatifloxacin (AM-1155) against Pseudomonas aeruginosa and Enterococcus faecalis in an in vitro bladder model simulating human urinary concentrations after oral administration. Chemotherapy 46:122–128. doi: 10.1159/000007266. [DOI] [PubMed] [Google Scholar]
- 42.Sobke A, Makarewicz O, Baier M, Bar C, Pfister W, Gatermann SG, Pletz MW, Forstner C. 2018. Empirical treatment of lower urinary tract infections in the face of spreading multidrug resistance: in vitro study on the effectiveness of nitroxoline. Int J Antimicrob Agents 51:213–220. doi: 10.1016/j.ijantimicag.2017.10.010. [DOI] [PubMed] [Google Scholar]
- 43.Naber KG, Niggemann H, Stein G, Stein G. 2014. Review of the literature and individual patients’ data meta-analysis on efficacy and tolerance of nitroxoline in the treatment of uncomplicated urinary tract infections. BMC Infect Dis 14:628. doi: 10.1186/s12879-014-0628-7. [DOI] [PMC free article] [PubMed] [Google Scholar]
- 44.Naber KG, Hollauer K, Kirchbauer D, Witte W. 2000. In vitro activity of gatifloxacin compared with gemifloxacin, moxifloxacin, trovafloxacin, ciprofloxacin and ofloxacin against uropathogens cultured from patients with complicated urinary tract infections. Int J Antimicrob Agents 16:239–243. doi: 10.1016/S0924-8579(00)00222-3. [DOI] [PubMed] [Google Scholar]
- 45.Stein GE, Schooley S. 2004. Urinary concentrations and bactericidal activities of newer fluoroquinolones in healthy volunteers. Int J Antimicrob Agents 24:168–172. doi: 10.1016/j.ijantimicag.2004.01.013. [DOI] [PubMed] [Google Scholar]
- 46.Naber KG. 2001. Which fluoroquinolones are suitable for the treatment of urinary tract infections? Int J Antimicrob Agents 17:331–341. doi: 10.1016/S0924-8579(00)00362-9. [DOI] [PubMed] [Google Scholar]
- 47.Davis H, Brown R, Ashcraft D, Pankey G. 2020. In vitro synergy with fosfomycin plus doxycycline against linezolid and vancomycin-resistant Enterococcus faecium. J Glob Antimicrob Resist doi: 10.1016/j.jgar.2020.01.014. [DOI] [PubMed] [Google Scholar]
- 48.Lepak AJ, Zhao M, VanScoy B, Taylor DS, Ellis-Grosse E, Ambrose PG, Andes DR. 2017. In vivo pharmacokinetics and pharmacodynamics of ZTI-01 (fosfomycin for injection) in the neutropenic murine thigh infection model against Escherichia coli, Klebsiella pneumoniae, and Pseudomonas aeruginosa. Antimicrob Agents Chemother 61:e00476-17. doi: 10.1128/AAC.00476-17. [DOI] [PMC free article] [PubMed] [Google Scholar]
- 49.Louie A, Maynard M, Duncanson B, Nole J, Vicchiarelli M, Drusano GL. 2018. Determination of the dynamically linked indices of fosfomycin for Pseudomonas aeruginosa in the hollow fiber infection model. Antimicrob Agents Chemother 62:e02627–17. doi: 10.1128/AAC.02627-17. [DOI] [PMC free article] [PubMed] [Google Scholar]
- 50.Fuchs PC, Barry AL, Brown SD. 1999. Fosfomycin tromethamine susceptibility of outpatient urine isolates of Escherichia coli and Enterococcus faecalis from ten North American medical centres by three methods. J Antimicrob Chemother 43:137–140. doi: 10.1093/jac/43.1.137. [DOI] [PubMed] [Google Scholar]
- 51.Falagas ME, Roussos N, Gkegkes ID, Rafailidis PI, Karageorgopoulos DE. 2009. Fosfomycin for the treatment of infections caused by Gram-positive cocci with advanced antimicrobial drug resistance: a review of microbiological, animal and clinical studies. Expert Opin Invest Drugs 18:921–944. doi: 10.1517/13543780902967624. [DOI] [PubMed] [Google Scholar]
- 52.Ipe DS, Ulett GC. 2016. Evaluation of the in vitro growth of urinary tract infection-causing gram-negative and gram-positive bacteria in a proposed synthetic human urine (SHU) medium. J Microbiol Methods 127:164–171. doi: 10.1016/j.mimet.2016.06.013. [DOI] [PubMed] [Google Scholar]
- 53.Brooks T, Keevil CW. 1997. A simple artificial urine for the growth of urinary pathogens. Lett Appl Microbiol 24:203–206. doi: 10.1046/j.1472-765X.1997.00378.x. [DOI] [PubMed] [Google Scholar]
- 54.Clinical and Laboratory Standards Institute. 2012. Methods for dilution antimicrobial susceptibility tests for bacteria that grow aerobically; 9th edition. CLSI M07. Clinical and Laboratory Standards Institute, Wayne, PA. [Google Scholar]
- 55.Abbott IJ, Dekker J, van Gorp E, Wijma RA, Raaphorst MN, Klaassen CHW, Meletiadis J, Mouton JW, Peleg AY. 2020. Impact of bacterial species and baseline resistance on fosfomycin efficacy in urinary tract infections. J Antimicrob Chemother 75:988–996. doi: 10.1093/jac/dkz519. [DOI] [PubMed] [Google Scholar]
- 56.Abbott IJ, van Gorp E, Wijma RA, Meletiadis J, Roberts JA, Mouton JW, Peleg AY. 2020. Oral fosfomycin efficacy with variable urinary exposures following single and multiple doses against Enterobacterales: the importance of heteroresistance for growth outcome. Antimicrob Agents Chemother 64:e01982-19. doi: 10.1128/AAC.01982-19. [DOI] [PMC free article] [PubMed] [Google Scholar]
- 57.Wijma RA, Bahmany S, Wilms EB, van Gelder T, Mouton JW, Koch B. 2017. A fast and sensitive LC-MS/MS method for the quantification of fosfomycin in human urine and plasma using one sample preparation method and HILIC chromatography. J Chromatogr B Analyt Technol Biomed Life Sci 1061–1062:263–269. doi: 10.1016/j.jchromb.2017.07.036. [DOI] [PubMed] [Google Scholar]
- 58.U.S. Food and Drug Adminstration. 2018. Guidance for industry: bioanalytical method validation. https://www.fda.gov/media/70858/download.
- 59.Rowe EL, Morozowich W. 1969. A simple dilution analog computer for simulation of drug distribution processes. J Pharm Sci 58:1375–1378. doi: 10.1002/jps.2600581117. [DOI] [PubMed] [Google Scholar]
- 60.Bland JM, Altman DG. 1986. Statistical methods for assessing agreement between two methods of clinical measurement. Lancet 327:307–310. doi: 10.1016/S0140-6736(86)90837-8. [DOI] [PubMed] [Google Scholar]