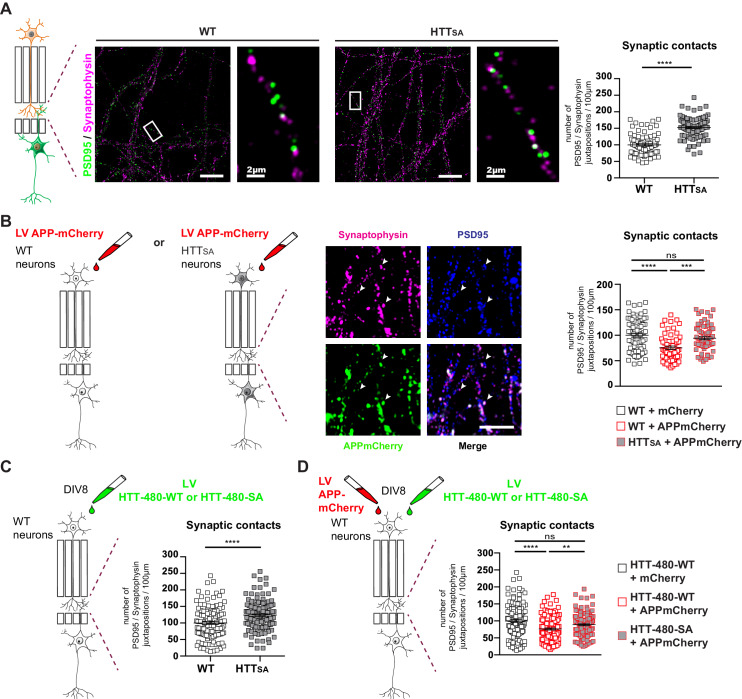
Figure 7. HTT phosphorylation regulates synaptic contacts by reducing presynaptic APP levels.
(A) Number of PSD95/Synaptophysin contacts in the synaptic chamber of WT and HTTSA network. Right microphotographs for each genotype show magnification of representative neurites. Scale bars = 20 µm (low magnification) or 2 µm (high magnification). Histograms represent means +/- SEM of 3 independent experiments and 85 WT and 91 HTTSA neurites. Significance was determined using an unpaired t-test; ****p<0.0001. (B) Representative image of APP-mCherry transduced presynaptic neurons. APP-mCherry is present in axon terminals positive for synaptophysin (white arrows). Scale bar = 2 µm. Number of PSD95/Synaptophysin contacts in the synaptic chamber of WT and HTTSA network transduced at presynaptic site with APP-mCherry or mCherry as a control. Histograms represent means +/- SEM of 3 independent experiments and 75 WT + mCherry; 59 WT + APP-mCherry and 71 HTTSA APP-mCherry neurites. (C) Number of PSD95/Synaptophysin contacts in the synaptic chamber of WT mature network transduced at presynaptic site with a lentivirus encoding an HTT construct containing the first 480 amino acids without (HTT-480-WT) or with the S421A mutation (HTT-480-SA). Histograms represent means +/- SEM of at least three independent experiments and 132 HTT-480-WT and 130 HTT-480-SA neurites. Significance was determined using Mann and Whitney test; ****p<0.0001. (D) Number of PSD95/Synaptophysin contacts in the synaptic chamber of WT mature network transduced at presynaptic site with APP-mCherry or mCherry as a control and with a lentivirus encoding a HTT-480-WT or HTT-480-SA. Histograms represent means +/- SEM of 3 independent experiments and 132 HTT-480-WT + mCherry, 134 HTT-480-WT + APP mCherry and 136 HTT-480-SA + APP mCherry neurites. Significance was determined using one-way Kruskal-Wallis test followed by Dunn’s post-hoc analysis for multiple comparisons; **p<0.01, ***p<0.001, ****p<0.0001, ns = not significant.

