

ABSTRACT
Background
Except for low thiamin content, little is known about vitamins or macronutrients in milk from Cambodian mothers, and associations among milk nutrients.
Objectives
We measured fat-soluble vitamins (FSVs) and water-soluble vitamins (WSVs), and macronutrients, and explored internutrient associations in milk from Cambodian mothers.
Methods
Milk from women (aged 18–45 y, 3–27 wk postpartum, n = 68) who participated in a thiamin-fortification trial were analyzed for vitamins B-2 (riboflavin, FAD), B-3 (nicotinamide), B-5, B-6 (pyridoxal, pyridoxine), B-7, B-12, A, E [α-tocopherol and γ-tocopherol (γ-TPH)], carotenoids, carbohydrate (CHO), fat, and protein. Milk vitamin B-1 [thiamin, thiamin monophosphate (TMP), thiamin pyrophosphate (TPP)] was previously assessed for fortification effects. Milk nutrient concentrations were compared with the Adequate Intake (AI) values for infants aged 0–6 mo. Pearson correlation was used to examine internutrient associations after excluding nutrients affected by fortification.
Results
Fortification increased thiamin and B-1 and decreased γ-TPH. Less than 40% of milk samples met the AIs for all vitamins, and 10 samples did not reach any AI values for the analyzed nutrients. CHO, fat, and energy values were met in 1.5–11.8%, and protein in 48.5%, of the samples. Whereas fat, protein, and energy were related (all r < 0.5; P < 0.001) and associated with FSVs and WSVs, CHO correlated only with some WSVs. TPP was not correlated with B-1 vitamers, but with other WSVs (r = 0.28–0.58; P < 0.019). All FSVs, except α-carotene, were correlated with each other (r = 0.42–0.98; P < 0.002). TPP, FAD, B-2, and B-3 were associated with almost all FSVs (r = 0.24–0.63; P < 0.044).
Conclusions
Cambodian women might not provide sufficient nutrients to their exclusively breastfeeding infants. Besides thiamin, all other vitamins measured were much lower than the AI. There were many strong correlations among macronutrients and vitamins; the extent to which these are explained by maternal diet, milk volume, maternal physiology, or genetics requires additional exploration.
Keywords: human milk, micronutrients, macronutrients, Adequate Intake (AI), internutrient relations
Introduction
The WHO recommends exclusive breastfeeding (EBF) for the first 6 mo of life (1), so human milk is the sole source of nutrients for infants during this time. Astonishingly little is known about the nutrient composition of human milk (2, 3), yet milk composition can influence growth, health, and developmental outcomes of infants (4). For instance, infantile beriberi, a potentially fatal disease caused by thiamin deficiency, is an ongoing public health concern in Cambodia and throughout Southeast Asia (5), where lactating women consume little thiamin and therefore produce thiamin-poor milk (6,7). We conducted a trial of thiamin fortification in Cambodia to assess the impact of maternal thiamin intake on milk thiamin (6). Given the availability of milk samples from this study, and the fact that some nutrients have essential and interrelated roles, and often similar sources, we measured additional water-soluble vitamins (WSVs) and fat-soluble vitamins (FSVs) and macronutrients in the milk samples to assess both nutrient concentrations and internutrient associations. For example, B vitamins share many similarities in their dietary sources, absorption, and physiological functions (8), and have dependent interactions, such as involvement in 1-carbon metabolism (8) and the conversion of vitamin B-6 to active derivatives requiring riboflavin in the form of both FMN and FAD (9). Furthermore, macro- and micronutrients can have strong associations; high-carbohydrate diets increase thiamin requirements (5), and dietary fats are rich sources of FSVs (10). Given the increased nutrient requirements of lactation (11), reliance on high-carbohydrate dietary staples, and limited access to diverse and/or nutrient-rich foods (e.g., animal source foods) in low-income countries (12), breastfeeding dyads can be at risk of multiple nutrient deficiencies.
Although some milk micronutrients are not affected by maternal status (e.g., iron, zinc, and copper) (13), this is not true for most (7). B vitamins, except for folate, are classified as Group I nutrients in lactation, meaning that milk concentrations are dependent on maternal status and/or intake (7), with low maternal status/intake putting infants at risk of deficiency (3, 11).
When there is insufficient evidence available to establish an estimated average requirement (EAR) and RDA, the Institute of Medicine (IOM) developed an Adequate Intake (AI) that is expected to meet or exceed the needs of individuals in that life-stage group (14). For infants aged 0–6 mo, AIs are calculated using measured nutrient concentrations in milk produced by purportedly healthy EBF mothers, and assuming infant consumption of 780 mL milk/d (14). Many factors including small sample sizes [e.g., n = 24 mothers for thiamin (15–17)], potentially outdated and uncertain analytical methodologies (18), and variable milk collection techniques (19), have lead researchers to call AIs for infants into question for a number of micronutrients (2, 6, 20). More recently, the European Food Safety Authority (EFSA) released updated nutrient average requirements (ARs) in 2013, including for infants of the same age (21). Regarding the nutrients analyzed in this study, the ARs were often developed considering the AIs or literature that was used to set the AIs, in conjunction with new evidence where available.
Although we have some information about the nutrient content of milk from women in low-income settings, for example, thiamin (6, 22, 23), choline (20), B vitamins (24–28), and fatty acids (29), to date there has been little investigation of correlations between nutrients in human milk, which could reveal novel information about the mother-milk-infant relation. In this exploratory secondary analysis, using state-of-the art methodological analytical approaches for the complex human milk matrix, we measured the concentrations of FSVs, WSVs, and macronutrients in milk from Cambodian women, compared these values with AIs, and assessed internutrient correlations.
Methods
Participants
This study was a secondary analysis of human milk samples collected from a double-blind, 3-parallel-arm randomized controlled, efficacy trial of thiamin-fortified fish sauce in rural Cambodia between October 2014 (at 23 ± 7 wk gestation) and April 2015 (at infant age 16 ± 8 wk) (clinicaltrials.gov identifier: NCT02221063); details, including a flow diagram, are published elsewhere (6). Briefly, a convenience sample set of 90 pregnant women in Prey Veng province, Cambodia, was recruited. Women needed to be aged 18–45 y, ∼3–8 mo pregnant with a singleton fetus with no prior history of pregnancy or delivery complications, and intended to EBF for 6 mo. Participating women could not be taking part in nongovernmental nutrition programs or have consumed thiamin-containing dietary supplements in the previous 4 mo. Women were pregnant at recruitment, and delivered and breastfed their infants during the 6-mo study. All women provided written informed consent to participate. The Cambodian National Ethics Committee for Health Research (0245NECHR) and the University of British Columbia Children's and Women's Health Centre of British Columbia Research Ethics Board (CQ14-0204/H14-01654) approved the study.
Intervention for original trial: thiamin-fortified fish sauce
Upon enrolment to the trial, women were randomly assigned to receive 1 of 3 study fish sauces for ad libitum consumption. The 3 groups were as follows: control (0 g/L thiamin); low-concentration thiamin-fortified [low; 2 g/L thiamin hydrochloride (≥98% purity); Huazhong Pharmaceutical Co]; and high-concentration thiamin-fortified (high; 8 g/L thiamin hydrochloride). All fish sauce was also fortified with iron as ferric sodium ethylenediaminetetraacetate (2.8 g/L Ferrazon; Akzo Nobel Functional Chemicals B.V.) per Cambodian Ministry of Planning guidelines (30). For this secondary analysis, the samples were treated as cross-sectional, and only results unaffected by the intervention were included.
Human milk sample collection
Between April 22 and 29, 2015, when infants were aged 3–27 wk, a full-breast expression was collected using a battery-powered single-breast pump (Swing Breast pump; Medela) from the breast that participants had not most recently fed from. Milk samples were transported on ice to the National Institute of Public Health Laboratory in Phnom Penh within 5 h of collection, mixed well, and transferred into amber cryovials for storage at −80°C. Samples were shipped on dry ice to the University of British Columbia in Vancouver, Canada, and subsequently to the USDA/ARS Western Human Nutrition Research Center in Davis, California, United States, for analysis. Sixty-eight milk samples were available for secondary analysis, 23, 26, and 19 from the control, low, and high groups, respectively.
Biochemical analyses of milk samples
Free thiamin and its phosphorylated forms TMP and thiamin pyrophosphate (TPP) were analyzed by HPLC coupled with fluorescence detection (HPLC-FLD) using an Agilent HPLC 1200 series after precolumn derivatization of the vitamers into their thiochrome esters (23). Results of this analysis in response to fortification have been reported elsewhere (6).
Riboflavin, FAD, nicotinamide (B-3), pyridoxal, pyridoxine, biotin, and pantothenic acid were analyzed using ultra performance liquid chromatography-tandem MS (UPLC-MS/MS) using a Waters ACQUITY UPLC system coupled with a Sciex 4000QTRAP MS system as previously described (31). Vitamin B-12 concentrations were measured using the IMMULITE/IMMULITE 1000 Vitamin B12 solid-phase, competitive chemiluminescent enzyme immunoassay (Siemens Healthcare Diagnostics) (32). FSVs (retinol, α- and γ-tocopherol, α- and β-carotene, β-cryptoxanthin, lutein/zeaxanthin, lycopene) were analyzed as previously described (33) with a few modifications: 100-µL samples were used for protein precipitation with 0.1% butylated hydroxytoluene (BHT)in ethanol and saponification in the presence of 10% pyrogallol in ethanol and 200 µL aqueous potassium hydroxide (15%). FSVs were extracted with 4 mL hexane, and the organic phase was evaporated to dryness before reconstitution in 50 µL acetonitrile. Twenty microliters of the extract was injected into an Agilent 1260 HPLC system using a multiple wavelength detector (retinol: 325 nm; tocol (internal standard), α- and γ-tocopherols: 295 nm; carotenoids: 450 nm), and equipped with an Agilent Eclipse Plus C18 column (100 × 2.1 mm, 3.5 µm) held at 15°C, protected by a Hypersil BDS C18 Javelin guard (20 × 3 mm, 3 µm; Thermo Scientific). Total carbohydrate (CHO), fat, and protein were measured using the SpectraStar 2600 XT Neonatal Analyzer (Unity Scientific) according to the manufacturer's protocol. Energy, in kilocalories per liter, was calculated based on the results of the macronutrient analysis in percent (%) using the following equation:
 |
(1) |
Statistical analyses
SAS for Windows Release 9.4 (SAS Institute) was used for statistical analyses. The outcomes were concentrations of human milk fat, protein, CHO, energy, thiamin, TMP, TPP, vitamin B-1 (B-1; thiamin + TMP + TPP), free riboflavin, FAD, vitamin B-2 (riboflavin + FAD), vitamin B-3 (nicotinamide), vitamin B-5 (pantothenic acid), pyridoxal (PL), pyridoxine (PN), vitamin B-6 (PL + PN), vitamin B-7 (biotin), vitamin B-12, α-tocopherol (α-TPH), γ-tocopherol (γ-TPH), vitamin E (VE), vitamin A (retinol; VA), α-carotene (α-C), β-carotene (β-C), β-cryptoxanthin (β-Crp), lycopene (Lyc), and lutein/zeaxanthin (L/Z) reported within the 3 defined groups (control, low, high). Log (fat, TPP, thiamin, B-1, FAD, B-2, PL, B-6, B-7, B-12, VA, γ-TPH, α-C, β-C, β-Crp, Lyc, L/Z), square-root (B-1, riboflavin, B-3, B-5, α-TPH, VE), and inverse (1/x; PN, protein, energy) transformations were performed to normalize the distributions of the outcome variables. No transformations were necessary for TMP and CHO. FSVs were also expressed as concentration per gram of fat.
Demographic differences by fortification group were evaluated by 1-factor ANOVA or chi-square tests (Table 1). Fortification effects were examined using generalized linear models adjusted for time of sample collection (infant age) and multiple comparisons with Tukey–Kramer test (Table 2). Treatment groups were pooled and only outcome variables unaffected by fortification were included in the Pearson correlation analyses. The correlation plot is presented in Figure 1, and correlation coefficients and P values in Supplemental Table 1. The correlation strength was defined as follows: weak (ρ ≤ 0.3), moderate (ρ = 0.3–0.5), good (ρ = 0.5–0.7), or strong (ρ = 0.7–1.0). Measured milk nutrient concentrations were also compared with the AIs for infants aged 0–6 mo recommended by the IOM (32–35). The obtained dichotomous results were examined by chi-square tests for differences in percentage of samples meeting the requirements due to fortification. Fortification groups were pooled when no significant differences were found (Table 3). P values <0.05 were considered significant for all statistical tests.
TABLE 1.
Demographic characteristics of Cambodian women who participated in the thiamin-fortification trial1
| Fortification group | |||||
|---|---|---|---|---|---|
| Combined | Control | Low | High | P value | |
| Sample number, n | 68 | 23 | 26 | 19 | |
| Mother | |||||
| Age, y | 26.0 ± 4.7 | 26.7 ± 3.6 | 26.4 ± 5.4 | 24.8 ± 4.9 | 0.372 |
| Highest schooling completed | 0.173 | ||||
| None | 6 (9) | 2 (9) | 3 (12) | 1 (5) | |
| Primary | 31 (46) | 9 (39) | 15 (58) | 7 (37) | |
| Lower secondary | 26 (38) | 11 (48) | 5 (19) | 10 (53) | |
| Upper secondary | 5 (7) | 1 (4) | 3 (12) | 1 (5) | |
| Annual household income, US$ | 1459 ± 1162 | 1602 ± 1129 | 1263 ± 902 | 1553 ± 1500 | 0.552 |
| Parity, primipara | 35 (52) | 11 (48) | 14 (54) | 10 (53) | 0.913 |
| Infant | |||||
| Sex, girls | 30 (44) | 11 (48) | 11 (42) | 8 (42) | 0.913 |
| Birth weight, kg | 3.1 ± 0.6 | 3.1 ± 0.4 | 3.2 ± 0.4 | 3.1 ± 0.9 | 0.992 |
| Birth length, cm | 49.1 ± 2.3 | 49.3 ± 1.9 | 49.1 ± 1.9 | 48.7 ± 3.3 | 0.652 |
| Age at milk collection, wk | 15.6 ± 7.1 | 15.0 ± 7.7 | 17.1 ± 6.8 | 14.2 ± 6.7 | 0.382 |
Results are presented as mean ± SD or n (%).
One-factor ANOVA.
Chi-square test.
TABLE 2.
Concentrations of nutrients in milk from Cambodian women 3–27 wk postpartum1
| Fortification group | ||||
|---|---|---|---|---|
| Nutrient | Combined | Control | Low | High |
| Number of samples, n | 68 | 23 | 26 | 19 |
| Energy, kcal/L | 542 (568, 619) | 527 (486, 576) | 586 (545, 632) | 512 (474, 555) |
| Carbohydrates, g/L | 69.5 (68.7, 70.3) | 69.4 (68.1, 70.6) | 70.1 (68.6, 71.5) | 69.2 (67.4, 70.9) |
| Fat, g/L | 23.7 (21.2, 26.5) | 22.0 (17.6, 27.4) | 28.4 (24.1, 33.5) | 20.6 (16.3, 25.3) |
| Protein, g/L | 11.8 (11.3, 12.3) | 11.6 (10.8, 12.4) | 12.3 (11.5, 11.4) | 11.4 (10.5, 12.5) |
| Thiamin pyrophosphate,2 μg/L | 3.88 (3.34, 4.51) | 3.21 (2.51, 4.11) | 4.29 (3.39, 5.44) | 4.37 (3.33, 5.72) |
| Thiamin monophosphate,2 μg/L | 148 (135, 160) | 133 (112, 153) | 166 (146, 186) | 140 (111, 169) |
| Thiamin,2 μg/L | — | 12.1a (8.88, 16.5) | 49.1b (36.5, 66.1) | 39.4b (28.0, 55.4) |
| Vitamin B-1,2 μg/L | — | 131a (110, 154) | 203b (178, 231) | 172ab (146, 202) |
| Riboflavin, μg/L | 11.6 (8.87, 14.7) | 16.5 (11.4, 22.6) | 8.90 (5.33, 13.4) | 10.4 (6.04, 15.8) |
| FAD, μg/L | 103 (84.6, 125) | 99.3 (71.7, 138) | 108 (78.9, 148) | 102 (71.5, 147) |
| Vitamin B-2, μg/L | 60.2 (49.7, 73.0) | 62.2 (45.0, 85.9) | 60.2 (44.2, 82.1) | 59.4 (41.6, 84.7) |
| Vitamin B-3, μg/L | 442 (370, 519) | 421 (312, 552) | 454 (340, 583) | 468 (340, 617) |
| Vitamin B-5, mg/L | 1.81 (1.62, 2.00) | 1.93 (1.61, 2.26) | 1.70 (1.42, 2.01) | 1.79 (1.46, 2.15) |
| Pyridoxal, μg/L | 82.9 (72.2, 95.0) | 86.9 (69.0, 110) | 81.9 (65.6, 102) | 80.1 (62.1, 103) |
| Pyridoxine, μg/L | 0.24 (0.23, 0.26) | 0.26 (0.23, 0.30) | 0.24 (0.21, 0.27) | 0.23 (0.21, 0.27) |
| Vitamin B-6, μg/L | 83.7 (73.0, 95.8) | 87.8 (69.8, 110) | 83.1 (66.7, 104) | 80.4 (62.4, 103) |
| Vitamin B-7, μg/L | 5.44 (4.82, 6.13) | 6.29 (5.18, 7.64) | 5.14 (4.26, 6.19) | 4.84 (3.89, 6.04) |
| Vitamin B-12, pmol/L | 248 (205, 299) | 245 (180, 335) | 215 (159, 289) | 316 (224, 445) |
| Vitamin A, mg/L | 0.41 (0.35, 0.48) | 0.42 (0.31, 0.57) | 0.46 (0.38, 0.55) | 0.37 (0.25, 0.54) |
| α-Tocopherol, mg/L | 2.45 (2.07, 2.86) | 2.74 (1.88, 3.76) | 2.63 (2.12, 3.18) | 1.91 (1.35, 2.57) |
| γ-Tocopherol, mg/L | — | 0.18a (0.13, 0.25) | 0.20a (0.15, 0.26) | 0.09b (0.07, 0.13) |
| Vitamin E, mg/L | 2.67 (2.29, 3.09) | 2.97 (2.07, 4.05) | 2.94 (2.49, 3.43) | 2.03 (1.45, 2.70) |
| α-Carotene, µg/L | 9.63 (8.39, 11.0) | 11.4 (8.59, 15.2) | 9.19 (7.53, 11.2) | 8.37 (6.44, 10.9) |
| β-Carotene, µg/L | 48.6 (39.1, 60.4) | 63.4 (41.4, 97.1) | 47.9 (35.1, 65.4) | 36.4 (23.2, 57.2) |
| β-Cryptoxanthin, µg/L | 8.70 (7.42, 10.2) | 10.2 (7.36, 13.9) | 8.11 (6.42, 10.2) | 7.47 (5.53, 10.1) |
| Lutein/zeaxanthin, µg/L | 51.4 (43.6, 60.6) | 56.1 (40.7, 77.3) | 60.8 (47.8, 77.4) | 37.4 (27.2, 51.4) |
| Lycopene, µg/L | 8.33 (7.36, 9.43) | 8.87 (7.22, 10.9) | 9.33 (7.46, 11.7) | 6.66 (5.30, 8.37) |
| FSVs adjusted by milk-fat | ||||
| Vitamin A mg/g fat | 0.18 (0.16, 0.19) | 0.19 (0.17, 0.23) | 0.16 (0.14, 0.19) | 0.18 (0.14, 0.22) |
| α-Tocopherol, mg/g fat | 0.96 (0.86, 1.07) | 1.11 (0.91, 1.33) | 0.90 (0.76, 1.06) | 0.87 (0.67, 1.09) |
| γ-Tocopherol, µg/g fat | — | 81.9a (63.0, 107) | 70.6a (53.0, 94.1) | 46.7b (34.8, 62.5) |
| Vitamin E, mg/g fat | 1.06 (0.96, 1.17) | 1.21 (1.00, 1.44) | 1.02 (0.89, 1.16) | 0.92 (0.72, 1.15) |
| α-Carotene, µg/g fat | — | 5.76a (4.67, 7.11) | 3.95b (3.30, 4.72) | 4.16ab (3.22, 5.36) |
| β-Carotene, µg/g fat | 21.2 (17.7, 25.3) | 29.3 (22.0, 39.1) | 17.7 (13.1, 24.1) | 18.2 (12.7, 26.0) |
| β-Cryptoxanthin, µg/g fat | — | 5.13a (4.14, 6.34) | 3.56b (3.01, 4.22) | 4.16ab (3.32, 5.21) |
| Lutein/zeaxanthin, µg/g fat | 22.3 (19.9, 24.9) | 26.0 (21.6, 31.3) | 22.1 (18.3, 26.8) | 18.7 (15.0, 23.2) |
| Lycopene, µg/g fat | 4.12 (3.78, 4.48) | 4.57 (4.07, 5.13) | 3.98 (3.37, 4.71) | 3.77 (3.17, 4.48) |
Results are geometric means (95% CIs). Fortification effects were examined using generalized linear models adjusted for time of sample collection (infant age) and multiple comparisons (Tukey–Kramer). Different letters indicate significant differences (all P < 0.023), all adjusted by infant age. Vitamin B-1: thiamin + (thiamin monophosphate × 0.871) + (thiamin pyrophosphate × 0.707); vitamin B-2: riboflavin + (FAD × 0.479); vitamin B6: pyridoxal + (pyridoxine × 1.012). FSV, fast-soluble vitamin.
Published in Whitfield et al. (6).
FIGURE 1.
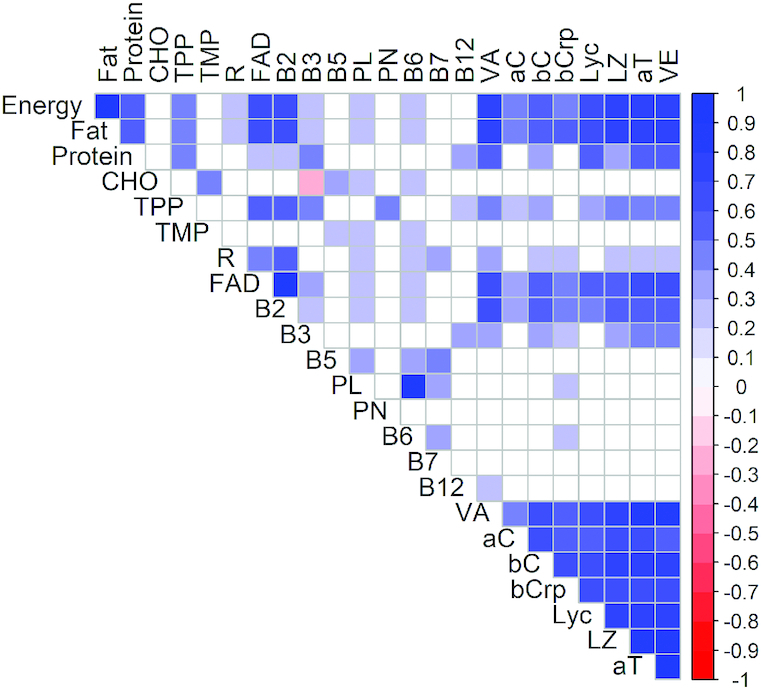
Correlation plot of B vitamins and vitamers in milk from Cambodian women 3–27 wk postpartum (n = 68). Pearson correlation analysis was used to examine nutrient associations. Fortification-affected thiamin, vitamin B-1, and γ-tocopherol were not included. Significant correlations are indicated by blue and red colors (P < 0.05). Correlation coefficients are provided for all significant correlations and are shown in Supplemental Table 1. aC, α-carotene; aT, α-tocopherol; bC, β-carotene; bCrp, β-cryptoxanthin; B2, vitamin B-2; B3, vitamin B-3; B5, vitamin B-5; B6, vitamin B-6; B7, vitamin B-7; B12, vitamin B-12; CHO, carbohydrates; Lyc, lycopene; LZ, lutein/zeaxanthin; PL, pyridoxal; PN, pyridoxine; R, free riboflavin; TPP, thiamin pyrophosphate; VA, vitamin A; VE, vitamin E.
TABLE 3.
Percentage of milk samples from Cambodian women 3–27 wk postpartum that met the recommended requirements for infants aged 0–6 mo by the Institute of Medicine1
| Nutrient | n | AI2 (IOM) | Percentage of samples reaching AI |
|---|---|---|---|
| Energy, kcal/L | 68 | 711.74 | 10.3 |
| Carbohydrate, g/L | 68 | 76.9 | 1.49 |
| Fat, g/L | 68 | 39.7 | 11.8 |
| Protein, g/L | 68 | 11.7 | 48.5 |
| Vitamin B-13 | 256 | ||
| Control, µg/L | 23 | 0 | |
| Low, µg/L | 26 | 24.0 | |
| High, µg/L | 19 | 10.5 | |
| Vitamin B-2, µg/L | 68 | 385 | 0 |
| Vitamin B-3, mg/L | 68 | 2.56 | 0 |
| Vitamin B-5, mg/L | 68 | 2.18 | 33.8 |
| Vitamin B-6, µg/L | 68 | 128 | 17.7 |
| Vitamin B-7, µg/L | 68 | 6.41 | 37.3 |
| Vitamin B-12, pmol/L | 68 | 376 | 26.5 |
| Vitamin A, mg RAE/L | 68 | 0.515 | 38.2 |
| Vitamin E, mg α-TPH/L | 68 | 5.136 | 8.82 |
Treatment groups from the thiamin fortification trial were combined when chi-square test did not reveal significant differences between groups. Vitamin B-1: thiamin + (thiamin monophosphate × 0.871) + (thiamin pyrophosphate × 0.707); vitamin B-2: riboflavin + (FAD × 0.479); vitamin B-6: pyridoxal + (pyridoxine × 1.012). AI, Adequate Intake; IOM, Institute of Medicine; RAE; retinol activity equivalent; TPH, tocopherol.
Adequate Intake as recommended by the Institute of Medicine expressed as concentrations per liter based on a milk consumption of 780 mL/d (34–37).
Published in Whitfield et al. (6).
AI for energy is calculated based on AI for macronutrients.
The IOM does not consider carotenoids in the infant AI for vitamin A.
The IOM only uses α-tocopherol for the infant AI for vitamin E.
R Studio for Windows, Version 1.1453 (RStudio Inc) was used to create the correlation plot (corrplot) in Figure 1.
Results
Maternal and infant characteristics
Demographic characteristics were comparable among study participants (P > 0.05; Table 1). On average, women were 26 y old, half were first-time mothers, and nearly half of the infants were female. The participant flow and follow-up is published elsewhere (6). At the time of milk sample collection 88.1% (59/67) of the participants were EBF.
Vitamin and macronutrient concentrations and comparison with AI values for infants aged 0–6 mo
The effects of thiamin fortification on human milk B-1 concentrations are reported elsewhere (6). As shown by Whitfield et al. (6), thiamin and B-1 were increased by thiamin fortification; however, we found that γ-TPH, and fat-adjusted γ-TPH, α-C, and β-Crp also responded to the fortification (Table 2). All other results were pooled for further analyses. As expected, TMP, FAD, and PL represented the main vitamers of their respective vitamins (B-1, B-2, and B-6).
When comparing the milk vitamin concentrations with the values used for setting the AI for infants aged 0–6 mo (32–37), none of the samples met the accepted value for vitamin B-2 or B-3 (Table 3). Vitamins B-5, B-6, B-7, B-12, and VA revealed somewhat higher concentrations, with 17.7–38.2% of the milk samples meeting the AI recommendations, whereas VE was only adequate in 8.8% of the analyzed samples. As previously shown (6), none of the samples in the control group met the AI value for B-1, whereas only 24.0% and 10.5% of the samples in the low and high groups, respectively, met the AI value despite maternal consumption of thiamin-fortified fish sauce. CHO, fat, and energy values met the AI in 1.49–11.8% of the samples, whereas almost half of all samples were sufficient in protein. Although no AI is provided for carotenoids, the infant's β-carotene intake has been estimated to be 8–163 µg/d (10.3–209 µg/L); 89.7% of the samples analyzed were within this range, whereas 4.4% were below and 5.9% were above.
Using the more recently reviewed EFSA ARs (21), the same percentage of samples reached the AR for vitamins B-1, B-2, B-3, and B-12 as when using the IOM's AIs, whereas the biggest differences in reaching recommendation values were found for vitamins B-5, B-7, and E (AI compared with AR: 33.8% compared with 19.1%; 37.3% compared with 56.7%; 8.8% compared with 22.1%).
Correlations among milk nutrients
All intervention groups were pooled for this analysis to increase sample size. Correlations were not evaluated for nutrient affected by the intervention (B-1, thiamine, and γ-TPH; Table 2). Fat-adjusted concentrations for FSVs were not considered because milk fat was included in this correlation matrix.
Macronutrient associations
Good to strong correlations (r = 0.51–0.99; P < 0.0001; Figure 1, Supplemental Table 1) were found between fat, protein, and energy, whereas CHO revealed no associations with any of these macronutrients or energy. About half of the correlations of the macronutrients with WSVs in milk were weak (r < 0.30); only vitamin B-2 and FAD had strong correlations with fat and energy (r = 0.61–0.66; P < 0.0001). CHO had moderate correlations with TMP, B-5, B-6, and PL (r = 0.29–0.49; P < 0.017). TPP was moderately correlated with all macronutrients (r = 0.42–0.45; P < 0.0004) except CHO. CHO had a weak inverse association with B-3 (r = −0.26; P = 0.031), the only inverse correlation in the dataset.
Almost all correlations (>95%) found between macronutrients and energy with FSVs were at least moderately strong (r > 0.3). Unsurprisingly, all FSVs had moderate to good associations with milk fat (r = 0.42–0.79; P < 0.0004) and energy (r = 0.41–0.78; P < 0.0007). Of the FSVs, only α-C and β-Crp showed no relation to protein, and none of the FSVs correlated with CHO (P > 0.05).
Micronutrient correlations
The observed significant correlations among WSVs and their vitamers in human milk were all positive but mostly weak or moderate (r < 0.5; P < 0.05; Figure 1, Supplemental Table 1). Good to strong correlations were observed between vitamers of each vitamin (B-1, B-2, B-6; r > 0.6; P < 0.001). Whereas TPP was not correlated with TMP, the only other B-1 vitamer unaffected by fortification, it revealed moderate intervitamin associations with B-2, FAD, B-3, PN, B-7 (r = 0.36–0.57; P < 0.003). B-5 was moderately correlated with PL, B-6, and B-7 (r = 0.38–0.47; P < 0.001).
Almost all correlations between FSVs were good or strong (r = 0.53–0.98; P < 0.0001; Figure 1, Supplemental Table 1). α-TPH, the main vitamer of VE, was strongly correlated with VE (r = 0.98), and both were good to strongly associated with VA and all carotenoids (r = 0.61–0.83). VA was associated with all measured carotenoids, with the weakest relation to α-C (r = 0.44) and the strongest with L/Z (r = 0.71). All 5 measured carotenoids were correlated with each other (r = 0.56–0.78).
Significant correlations between WSVs and FSVs were all positive (P < 0.044; Figure 1, Supplemental Table 1). Only ∼29% were weak correlations (r < 0.28) and none were strong (r > 0.7). Of all WSVs analyzed, only B-2 and its main vitamer FAD correlated with all FSVs (r = 0.34–0.62). TPP was the only B-1 vitamer with significant associations with FSVs, with the weakest association to α-C (r = 0.24); the remaining FSVs had good to strong correlations with TPP (r = 0.35–0.49). Whereas B-3 was correlated with all FSVs except α-C and Lyc, and more strongly with VE and α-TPH (r = 0.46–0.47) than with VA and carotenoids (r = 0.28–0.4), PL, B-6, and B-12 were only weakly correlated with β-Crp and α-C (r < 0.28). The remaining WSVs were not significantly correlated with any FSV (P > 0.05).
Discussion
Comparison of human milk composition with other studies
The nutrient composition from our samples is comparable with values from women in other low-income countries. Our Cambodian milk was lower in fat and VE but higher in B-2, B-3, and B-12 compared with Bangladeshi women 2–4 mo postpartum (19), possibly due to the known low B-2 and B-12 intakes (38) and low meat consumption in Bangladesh. Conversely, people in Southeast Asia have high intakes of nuts and seeds, good VE sources (39). Another Bangladeshi study on milk FSVs (1.5–26 mo postpartum) was in agreement with our Cambodian results (40). Japanese women had similar concentrations of most milk WSVs, except lower B-6 and higher B-2, B-5, and B-12 (41). The typical higher intake of animal-source foods (ASFs; e.g., meat, eggs, dairy) in Japan could be reflected in the higher ASF-derived B-2, B-5, and B-12 in the milk (8). A recent study in Indonesia found lower milk B-1, B-3, B-5, B-6, and B-12, whereas B-2, B-7, and the FSVs were higher (42). Low daily micronutrient intakes of these Indonesian mothers could contribute to the low milk micronutrient content; in fact intakes of vitamins A, niacin, and riboflavin were positively correlated with their milk concentrations (42).
Comparing milk macronutrients with available data from Finland, Spain, Australia, and the United States obtained with similar analytical techniques (43–46), our Cambodian sample set contained comparable amounts of CHO (Finland, United States) and protein (Finland, Australia), whereas the fat content was up to 60% lower (29). The Australian and Spanish samples were lower in CHO, and the Spanish and US samples were lower in protein. However, the use of different analytical approaches, instruments, and lactation stages in these studies, plus the naturally occurring macronutrient-specific diurnal and other variations in concentrations (47, 48) could contribute to these observed differences.
Vitamin and macronutrient concentrations and comparison with AIs for infants aged 0–6 mo
Our milk samples were low in all measured WSVs and FSVs. No sample met the AI values for B-2 or B-3. Given that the measured B-2 vitamers represent >90% of total milk B-2, the low concentrations could indicate that EBF infants in Cambodia might be at risk of B-2 deficiency (18, 49). This is not surprising given that thiamin, a known public health concern in Cambodia, and riboflavin are found in similar foods, and it aligns with previous work reporting that 78% of urban and 82% of rural Cambodian women of reproductive age are riboflavin deficient (50). B-3 in this study was solely represented by nicotinamide. However, nicotinamide mononucleotide, NAD, and nicotinamide riboside have been reported in human milk (51), but were not analyzed here. Thus, the total B-3 concentration in this sample is unknown because possible significant contributions of other B-3 vitamers were not included.
As previously reported (6), no sample of the control group met the AI for B-1, but the geometric mean (131 µg/L) was comparable with milk B-1 from US women (22). Even when thiamin fortification was most effective, only 24% of the samples reached the AI value (Table 3) (34). The highest proportion of samples reaching AI was found for VA, yet this number was still <40%. VA supplementation for lactating mothers ceased in Cambodia in 2012 and thus was not a contributing factor to our findings. Milk macronutrients were also low: 12% reached the AI for fat, 10% for energy, and <2% for CHO. The geometric mean of CHO, fat, and energy, however, reflected 90%, 60%, and 76% of the respective AI; thus, the macronutrient concentrations are not as alarmingly lower than the AI as the dichotomous comparison might suggest. Nevertheless, 10 samples (14.7%) did not meet any AI value for any nutrient evaluated.
The similar results using IOM's AIs and EFSA's ARs for most of the milk nutrients are not unexpected given the similarities between the AI and AR values; the ARs are often based on the AIs. The notable differences between AIs and ARs for vitamins B-5, B-7, and E reflect the new evidence available to EFSA that warranted an adjustment of the recommendations as set by the IOM.
As noted, AIs are set when there are insufficient data available to establish an EAR and RDA. The AI is not a requirement, but the recommended intake expected to meet or exceed the needs of individuals of specific life-stage groups (14). Although AIs are the currently accepted estimates of milk concentrations adequate for infant growth and development, these values are based on few reports and outdated data with missing information regarding validation for the methods applied, which could be unsuitable for the complex milk matrix (18, 49). Furthermore, the IOM does not subdivide AIs during the first 6 mo of life despite the known physiological alterations in nutrient concentrations (13, 52). Therefore, AI has very limited use in assessment and is used here with the understanding that nutrient values below those used to set AIs do not signify inadequacy. The EFSA's ARs, although including more recent literature in their recommendations, should still be viewed in a similar fashion, because the EFSA continues to use available reports in the literature, none of which were conducted for the purpose of reviewing intake recommendations.
Possible reasons for correlations among milk nutrients
Human milk is the sole food matrix for EBF infants, and therefore the single source of all nutrients required for growth and development (1). Consequently, the milk matrix is thought to supply these nutrients in distinct concentrations throughout lactation. Thus, examining the internutrient relations in human milk can help gain further insight into milk nutrient secretion and nutrient availability to the EBF infant.
There has been relatively little investigation of associations among milk macronutrients, and especially micronutrients. The new analytical methods pioneered in our laboratory for adequate and reliable analysis of vitamins and vitamers in the complex human milk matrix enable us to produce data that can explore these correlations. The strong associations found in this study could result from multiple factors, possibly including similar maternal diets. Unfortunately, dietary intake was not measured, but intake of the measured vitamins would affect concentrations of the milk nutrients. This is likely not the case for the macronutrients and does not explain the observed correlations between some milk macro- and micronutrients. Also, milk volume could affect milk nutrients, with higher concentrations possibly coinciding with lower milk production. This hypothesis has not been adequately explored but is being investigated in our ongoing studies. However, it does not explain the variability in correlation strength among the nutrients. Finally, correlations might be affected by maternal physiology and nutrient transport mechanisms in the mammary gland.
Macronutrient associations
The concentrations of milk macronutrients vary throughout lactation and even within a feed. Fat has been reported to be the most variable, whereas lactose, the principal CHO, is the most stable (44), as we also observed here. Whereas fat and protein were strongly correlated, neither was associated with CHO. The calculated energy only correlated with fat and protein. Because fat is one of the main energy sources in human milk (47), its strong relation with energy is expected, and has been previously reported (47, 53).
Nommsen et al. (53) showed that milk fat, but not protein, is significantly correlated with maternal protein intake. Others reported significant relations between dietary and milk protein (54), and higher milk protein in colostrum of well-nourished mothers compared with undernourished women (55). Thus, the evidence base remains inconsistent. Mucins, a family of glycosylated proteins surrounding the lipid globules in milk (56), might contribute to the relation between milk fat and protein, but given they are only a minor protein fraction (57), mucins are unlikely to drive this assocation.
The protein fraction in milk consists of proteins synthesized in the mammary gland, which decrease during early lactation (e.g., lactoferrin, caseins, α-lactalbumin), and proteins derived from the maternal bloodstream (e.g., serum albumin), which are mainly synthesized in the liver and remain constant (48, 58). Thus, associations with dietary protein could be driven by proteins derived from the mother's blood, and depending on the ratio of milk-specific and blood-derived proteins, a potential relation with dietary protein could be masked.
CHO was the sole macronutrient that showed no correlation with any other macronutrient or energy, even though CHO is a major contributor to energy. Stable lactose concentrations are needed to regulate milk osmolality and volume, and our sample set revealed only very limited variation (CV <5%). Thus, CHO should be viewed as a constant and therefore would not correlate with milk nutrients with varying concentrations throughout lactation.
FSVs are associated with the milk-fat globules (59–61), thus the observed relations between milk fat/energy and FSVs were expected. Little information is available regarding WSVs and macronutrient relations. Particularly, the strong relation between FAD (and B-2) and fat/energy remains to be elucidated. Coenzymatic forms of vitamins such as FAD or TPP could be involved in enzymatic processes, such as lactose synthesis, which requires a coupled reaction of α-lactalbumin and galactosyltransferase (62). TPP has been shown to possess a close topological association to this transferase in trans-Golgi cisternae (63). TMP, the main B-1 vitamer in milk, had the strongest correlation to CHO, but has no known role in metabolic processes (64). Its secretion into human milk might occur via transporters closely related to thiamin transporters (23, 64) yet it does not represent the main B-1 vitamer in food items (65). Thus, its function and relations with other milk nutrients are not yet well understood. However, dietary CHO intake has been shown to affect thiamin status of adults but not enzyme activities (66), indicating the existence of such interrelation in human metabolism.
The only inverse association in this dataset was between nicotinamide and CHO (r = −0.26). Vitamin B-3’s coenzymatic form NAD and its reduced form NAD(H) are required in many redox reactions including their function as electron carriers in the Krebs cycle (9), which would suggest a positive relation. However, this weak association was exclusively based on free nicotinamide; thus, we cannot examine the true nature of this relation.
Micronutrient correlations
All WSV vitamers contributing to total WSV content were strongly correlated with each other. TPP was linked to FAD (and therefore to B-2), B-3, and the minor B-6 contributor PN. All these vitamers are coenzymes or coenzyme precursors (18) and interact in energy metabolism, including the Krebs cycle, respiratory chain complexes I and II, or mitochondrial 1-carbon transfer (67), and therefore essential for the EBF infant. B-5 and B-7 are involved in heme biosynthesis (68), which could be a contributing factor to their connected milk concentrations.
Besides their importance as antioxidants and in immune response (68), carotenoids function as provitamin A and are therefore a VA source for the infant. All FSVs, including carotenoids, decrease during lactation (62, 68), and are associated with milk fat, which all could contribute to the correlations identified with FSVs in our samples.
Relations between WSVs and FSVs were mainly observed for FAD, B-2, and B-3, thus involving coenzymatic or pre-coenzymatic forms. Many metabolic processes in the human body require complex interactions between WSVs and FSVs. FAD, FMN, and NAD(P)H, are involved in the production of oxygen radicals, whereas these cofactors and VE are part of the scavenging system against reactive oxygen species (69, 70). Retinal oxidase, a metalloflavoenzyme involved in retinoic acid synthesis, contains 2 FAD molecules (71), and animal studies have reported riboflavin-dependent photoreceptors involved in the dark adaptation process by stimulating the neuronal signal for pupillary response. Thus, it has been speculated that B-2 deficiency could contribute to increased risk of night blindness, a condition mainly caused by VA deficiency (72).
These relations between macro- and micronutrients could indicate just how precisely human milk is produced for optimal and efficient provision of nutrients to the EBF infant to ensure sufficient energy and availability of enzymes/coenzymes for healthy growth and development.
Limitations
Although our data are, to our knowledge, the first to examine human milk macro- and micronutrient status in Cambodia and novel aspects of internutrient relations in human milk, the small sample size did not permit examining the effects of thiamin fortification on associations among the affected nutrients. Because maternal dietary data were not collected, the nutritional status of the participants remains unknown, as well as the extent to which maternal diet, or other factors such as milk volume, maternal physiology, or genetics, contribute to observed relations among milk macronutrients and vitamins.
The samples were not collected at a fixed time point but between 3 and 27 wk of lactation; consequently, the milk nutrients were subject to the naturally occurring changes in concentrations over time. However, all samples were collected using a standard protocol with the same pump as a full-breast expression in the morning, limiting effects introduced by collecting convenience sample aliquots and interparticipant diurnal variations (19).
Conclusion
Milk from Cambodian mothers revealed low concentrations of macro- and micronutrients, indicating a potential for higher risk of deficiency of the EBF infant, particularly for vitamin B-2, because none of the samples met the AI value. Multiple observed internutrient associations could be due to the intertwined relations of the nutrients in metabolic processes needed for healthy growth and development, as well as shared maternal food sources of these nutrients. More research is needed to gain better insight into these interconnections, in which maternal diet could also be an important contributor.
Supplementary Material
Acknowledgments
We thank Larisse Melo and Julianne Sarancha for analytical support. USDA is an equal opportunity employer and provider.
The authors’ responsibilities were as follows—KCW: designed and conducted research, and cowrote the paper; SS-F: analyzed data, performed statistical analysis; HK and PS: aided in the design, implementation, and data and sample collection of the original study; LHA: provided essential reagents and materials, and manuscript revisions; TJG: led the conceptualization and design of the original study, data collection and management, and provided manuscript revisions; DH: analyzed data, performed statistical analysis, and cowrote the paper; and all authors: read and approved the final manuscript.
Notes
The study was supported by the Grand Challenges Canada Stars in Global Health Grant (S6 0490-01-10), International Development Research Centre, Canadian Institutes of Health Research, and Intramural USDA/ARS Project 5306-51000-003-00D.
Author disclosures: The authors report no conflicts of interest.
Supplemental Table 1 is available from the “Supplementary data” link in the online posting of the article and from the same link in the online table of contents at https://academic.oup.com/jn/.
Abbreviations used: A, vitamin A; AI, Adequate Intake; AR, average requirement; ASF, animal-source food; B-1, vitamin B-1 (thiamin + TMP + TPP); B-2, vitamin B-2 (riboflavin + FAD); B-3, niacin (nicotinamide); B-5, vitamin B-5 (pantothenic acid); B-6, vitamin B-6 (PL + PN); B-7, vitamin B-7 (biotin); B-12, vitamin B-12; CHO, carbohydrate; E, vitamin E (α-TPH + γ-TPH); EAR, estimated average requirement; EBF, exclusive breastfeeding; EFSA, European Food Safety Authority; FLD, fluorescence detection; FSV, fat-soluble vitamin; lyc, lycopene; IOM, Institute of Medicine; LZ, lutein/zeaxanthin; PL, pyridoxal; PN, pyridoxine; TMP, thiamin monophosphate; TPP, thiamin pyrophosphate; UPLC, ultra-performance liquid chromatography; WSV, water-soluble vitamin; α-C, α-carotene; α-TPH, α-tocopherol; β-C, β-carotene; β-CRP, β-cryptoxanthin; γ-TPH, γ-tocopherol.
References
- 1. Kramer MS, Kakuma R. Optimal duration of exclusive breastfeeding. Cochrane Database Syst Rev. 2012;8:CD003517.[Internet]. [Cited 2019 Jan 8]. Available from: 10.1002/14651858.CD003517.pub2. [DOI] [PMC free article] [PubMed] [Google Scholar]
- 2. Allen LH, Donohue JA, Dror DK. Limitations of the evidence base used to set recommended nutrient intakes for infants and lactating women. Adv Nutr. 2018;9(1 Suppl):295S–312S. [DOI] [PMC free article] [PubMed] [Google Scholar]
- 3. Montalbetti N, Dalghi MG, Albrecht C, Hediger MA. Nutrient transport in the mammary gland: calcium, trace minerals and water soluble vitamins. J Mammary Gland Biol Neoplasia. 2014;19(1):73–90. [DOI] [PubMed] [Google Scholar]
- 4. Dror DK, Allen LH. Overview of nutrients in human milk. Adv Nutr. 2018;9(1 Suppl):278S–94S. [DOI] [PMC free article] [PubMed] [Google Scholar]
- 5. Whitfield KC, Bourassa MW, Adamolekun B, Bergeron G, Bettendorff L, Brown KH, Cox L, Fattal‐Valevski A, Fischer PR, Frank EL et al.. Thiamine deficiency disorders: diagnosis, prevalence, and a roadmap for global control programs. Ann N Y Acad Sci. 2018;1430(1):3–43. [DOI] [PMC free article] [PubMed] [Google Scholar]
- 6. Whitfield KC, Karakochuk CD, Kroeun H, Hampel D, Sokhoing L, Chan BB, Borath M, Sophonneary P, McLean J, Talukder A et al.. Perinatal consumption of thiamine-fortified fish sauce in rural Cambodia: a randomized clinical trial. JAMA Pediatr. 2016;170(10): e162065. [DOI] [PubMed] [Google Scholar]
- 7. Allen LH. B vitamins in breast milk: relative importance of maternal status and intake, and effects on infant status and function. Adv Nutr. 2012;3(3):362–9. [DOI] [PMC free article] [PubMed] [Google Scholar]
- 8. Gropper SS, Smith JL, Carr TP. Water soluble vitamins. Advanced nutrition and human metabolism. Boston (MA): Cengage Learning; 2018. [Google Scholar]
- 9. Ross A, Caballero B, Cousins R, Tucker K, Ziegler T. Modern nutrition in health and disease, Philadephia (PA): Wolters Kluwer/Lippincott Williams & Wilkins; 2014. [Google Scholar]
- 10. Kuksis A. Fat absorption, vol. II. Boca Raton (FL): CRC Press; 2017; [Google Scholar]
- 11. Moran VH. Nutrition requirements during lactation. : Karakochuk CD, , Whitfield KC, , Green TJ, , Kraemer K, The biology of the first 1,000 days. Boca Raton (FL): CRC Press; 2018. pp.; 53–73. [Google Scholar]
- 12. Bhutta ZA, Das JK, Rizvi A, Gaffey MF, Walker N, Horton S, Webb P, Lartey A, Black RE, The Lancet Nutrition Interventions Review Group, the Maternal and Child Nutrition Study group. Evidence-based interventions for improvement of maternal and child nutrition: what can be done and at what cost?. Lancet. 2013;382(9890):452–77. [DOI] [PubMed] [Google Scholar]
- 13. Hampel D, Shahab‐Ferdows S, Gertz E, Flax VL, Adair LS, Bentley ME, Jamieson DJ, Tegha G, Chasela CS, Kamwendo D et al.. The effects of a lipid‐based nutrient supplement and antiretroviral therapy in a randomized controlled trial on iron, copper, and zinc in milk from HIV‐infected Malawian mothers and associations with maternal and infant biomarkers. Matern Child Nutr. 2018;14(2):e12503. [DOI] [PMC free article] [PubMed] [Google Scholar]
- 14. Otten JJ, Hellwig JP, Meyers LD. Dietary reference intakes: the essential guide to nutrient requirements. Washington (DC): National Academies Press; 2006. [Google Scholar]
- 15. Committee on Nutrition. Pediatric nutrition handbook. 2nd ed.Elk Grove Village (IL): American Academy of Pediatrics; 1985. [Google Scholar]
- 16. Nail P, Thomas M, Eakin R. The effect of thiamin and riboflavin supplementation on the level of those vitamins in human breast milk and urine. Am J Clin Nutr. 1980;33(2):198–204. [DOI] [PubMed] [Google Scholar]
- 17. Thomas MR, Sneed SM, Wei C, Nail PA, Wilson M, Sprinkle E. The effects of vitamin C, vitamin B6, vitamin B12, folic acid, riboflavin, and thiamin on the breast milk and maternal status of well-nourished women at 6 months postpartum. Am J Clin Nutr. 1980;33(10):2151–6. [DOI] [PubMed] [Google Scholar]
- 18. Hampel D, Allen LH. Analyzing B-vitamins in human milk: methodological approaches. Crit Rev Food Sci Nutr. 2016;56(3):494–511. [DOI] [PubMed] [Google Scholar]
- 19. Hampel D, Shahab-Ferdows S, Islam MM, Peerson JM, Allen LH. Vitamin concentrations in human milk vary with time within feed, circadian rhythm, and single-dose supplementation. J Nutr. 2017;147(4):603–11. [DOI] [PMC free article] [PubMed] [Google Scholar]
- 20. Wiedeman AM, Whitfield KC, March KM, Chen NN, Kroeun H, Sokhoing L, Sophonneary P, Dyer RA, Xu Z, Kitts DD et al.. Concentrations of water-soluble forms of choline in human milk from lactating women in Canada and Cambodia. Nutrients. 2018;10(3):381. [DOI] [PMC free article] [PubMed] [Google Scholar]
- 21. European Food Safety Authority (EFSA). Scientific opinion on nutrient requirements and dietary intakes of infants and young children in the European Union. ESFA J. 2013;11(10):3408. [Google Scholar]
- 22. Coats D, Frank EL, Reid JM, Ou K, Chea M, Khin M, Preou C, Enders FT, Fischer PR, Topazian M. Thiamin pharmacokinetics in Cambodian mothers and their breastfed infants. Am J Clin Nutr. 2013;98(3):839–44. [DOI] [PubMed] [Google Scholar]
- 23. Hampel D, Shahab-Ferdows S, Adair LS, Bentley ME, Flax VL, Jamieson DJ, Ellington SR, Tegha G, Chasela CS, Kamwendo D et al.. Thiamin and riboflavin in human milk: effects of lipid-based nutrient supplementation and stage of lactation on vitamer secretion and contributions to total vitamin content. PLoS One. 2016;11(2):e0149479. [DOI] [PMC free article] [PubMed] [Google Scholar]
- 24. Chebaya P, Karakochuk CD, March KM, Chen NN, Stamm RA, Kroeun H, Sophonneary P, Borath M, Shahab-Ferdows S, Hampel D et al.. Correlations between maternal, breast milk, and infant vitamin B12 concentrations among mother-infant dyads in Vancouver, Canada and Prey Veng, Cambodia: an exploratory analysis. Nutrients. 2017;9(3):270. [DOI] [PMC free article] [PubMed] [Google Scholar]
- 25. Williams AM, Chantry CJ, Young SL, Achando BS, Allen LH, Arnold BF, Colford JM, Dentz HN, Hampel D, Kiprotich MC et al.. Vitamin B-12 concentrations in breast milk are low and are not associated with reported household hunger, recent animal-source food, or vitamin B-12 intake in women in rural Kenya. J Nutr. 2016;146(5):1125–31. [DOI] [PMC free article] [PubMed] [Google Scholar]
- 26. Deegan KL, Jones KM, Zuleta C, Ramirez-Zea M, Lildballe DL, Nexo E, Allen LH. Breast milk vitamin B-12 concentrations in Guatemalan women are correlated with maternal but not infant vitamin B-12 status at 12 months postpartum. J Nutr. 2012;142(1):112–6. [DOI] [PubMed] [Google Scholar]
- 27. Allen LH, Hampel D, Shahab-Ferdows S, York ER, Adair LS, Flax VL, Tegha G, Chasela CS, Kamwendo D, Jamieson DJ et al.. Antiretroviral therapy provided to HIV-infected Malawian women in a randomized trial diminishes the positive effects of lipid-based supplements on breast-milk B vitamins. Am J Clin Nutr. 2015;102(6):1468–74. [DOI] [PMC free article] [PubMed] [Google Scholar]
- 28. Daniels L, Gibson RS, Aly D, Haszard JJ, Rahmannia S, Luftimas DE, Hampel D, Shahab-Ferdows S, Reid M, Melo L et al.. Micronutrient intakes of lactating mothers and their association with breast milk concentrations and micronutrient adequacy of exclusively breastfed Indonesian infants. Am J Clin Nutr. 2019;110(2):391–400. [DOI] [PMC free article] [PubMed] [Google Scholar]
- 29. Gao C, Liu G, Whitfield KC, Kroeun H, Green TJ, Gibson RA, Makrides M, Zhou SJ. Comparison of human milk fatty acid composition of women from Cambodia and Australia. J Hum Lact. 2018:34(3):585–91. [DOI] [PubMed] [Google Scholar]
- 30. Senior Minister of Planning and Chairman of National Council for Nutrition. Proclamation for production and consumption or iron fortified fish sauce and soy sauce. 048NCNCambodia: Kingdom of Cambodia, Phnom Penh; 2012. [Google Scholar]
- 31. Hampel D, York ER, Allen LH. Ultra-performance liquid chromatography tandem mass-spectrometry (UPLC-MS/MS) for the rapid, simultaneous analysis of thiamin, riboflavin, flavin adenine dinucleotide, nicotinamide and pyridoxal in human milk. J Chromatogr B. 2012;903:7–13. [DOI] [PubMed] [Google Scholar]
- 32. Hampel D, Shahab-Ferdows S, Domek JM, Siddiqua T, Raqib R, Allen LH. Competitive chemiluminescent enzyme immunoassay for vitamin B12 analysis in human milk. Food Chem. 2014;153:60–5. [DOI] [PubMed] [Google Scholar]
- 33. Turner T, Burri BJ.. Rapid isocratic HPLC method and sample extraction procedures for measuring carotenoid, retinoid, and tocopherol concentrations in human blood and breast milk for intervention studies. Chromatographia. 2012;75(5-6):241–52. [Google Scholar]
- 34. Institute of Medicine. Dietary reference intakes for thiamin, riboflavin, niacin, vitamin B6, folate, vitamin B12, pantothenic acid, biotin, and choline. Washington (DC): National Academies Press; 1998. [PubMed] [Google Scholar]
- 35. Institute of Medicine. Dietary reference intakes for vitamin C, vitamin E, selenium, and carotenoids. Washington (DC): National Academies Press; 2000. [PubMed] [Google Scholar]
- 36. Institute of Medicine. Dietary reference intakes for vitamin A, vitamin K, arsenic, boron, chromium, copper, iodine, iron, manganese, molybdenum, nickel, silicon, vanadium, and zinc. Washington (DC): National Academies Press; 2001. [PubMed] [Google Scholar]
- 37. Institute of Medicine. Dietary reference intakes for energy, carbohydrate, fiber, fat, fatty acids, cholesterol, protein and amino acids. Washington (DC): National Academies Press; 2002. [DOI] [PubMed] [Google Scholar]
- 38. Arsenault JE, Yakes EA, Islam MM, Hossain MB, Ahmed T, Hotz C, Lewis B, Rahman AS, Jamil KM, Brown KH. Very low adequacy of micronutrient intakes by young children and women in rural Bangladesh is primarily explained by low food intake and limited diversity. J Nutr. 2012;143(2):197–203. [DOI] [PubMed] [Google Scholar]
- 39. Micha R, Khatibzadeh S, Shi P, Andrews KG, Engell RE, Mozaffarian D. Global, regional and national consumption of major food groups in 1990 and 2010: a systematic analysis including 266 country-specific nutrition surveys worldwide. BMJ Open. 2015;5:e008705. [DOI] [PMC free article] [PubMed] [Google Scholar]
- 40. Barua S, Tarannum S, Nahar L, Mohiduzzaman M. Retinol and alpha-tocopherol content in breast milk of Bangladeshi mothers under low socio-economic status. Int J Food Sci Nutr. 1997;48(1):13–8. [DOI] [PubMed] [Google Scholar]
- 41. Sakurai T, Furukawa M, Asoh M, Kanno T, Kojima T, Yonekubo A. Fat-soluble and water-soluble vitamin contents of breast milk from Japanese women. J Nutr Sci Vitaminol (Tokyo). 2005;51(4):239–47. [DOI] [PubMed] [Google Scholar]
- 42. Daniels L, Gibson RS, Diana A, Haszard JJ, Rahmannia S, Luftimas DE, Hampel D, Shahab-Ferdows S, Reid M, Melo L et al.. Micronutrient intakes of lactating mothers and their association with breast milk concentrations and micronutrient adequacy of exclusively breastfed Indonesian infants. Am J Clin Nutr. 2019;110(2):391–400. [DOI] [PMC free article] [PubMed] [Google Scholar]
- 43. Saarela T, Kokkonen J, Koivisto M. Macronutrient and energy contents of human milk fractions during the first six months of lactation. Acta Paediatr. 2007;94:1176–81. [DOI] [PubMed] [Google Scholar]
- 44. Silvestre D, Fraga M, Gormaz M, Torres E, Vento M. Comparison of mid‐infrared transmission spectroscopy with biochemical methods for the determination of macronutrients in human milk. Matern Child Nutr. 2012;10(3):373–82. [DOI] [PMC free article] [PubMed] [Google Scholar]
- 45. Smilowitz JT, Gho DS, Mirmiran M, German JB, Underwood MA. Rapid measurement of human milk macronutrients in the neonatal intensive care unit: accuracy and precision of Fourier transform mid-infrared spectroscopy. J Hum Lact. 2014;30(2):180–9. [DOI] [PubMed] [Google Scholar]
- 46. Casadio YS, Williams TM, Lai CT, Olsson SE, Hepworth AR, Hartmann PE. Evaluation of a mid-infrared analyzer for the determination of the macronutrient composition of human milk. J Hum Lact. 2010;26(4):376–83. [DOI] [PubMed] [Google Scholar]
- 47. Ballard O, Morrow AL. Human milk composition: nutrients and bioactive factors. Pediatr Clin North Am. 2013;60(1):49–74. [DOI] [PMC free article] [PubMed] [Google Scholar]
- 48. Emmett PM, Rogers IS. Properties of human milk and their relationship with maternal nutrition. Early Hum Dev. 1997;49(Suppl):S7–S28. [DOI] [PubMed] [Google Scholar]
- 49. Hampel D, Dror DK, Allen LH. Micronutrients in human milk: analytical methods. Adv Nutr. 2018;9(1 Suppl):313S–31S. [DOI] [PMC free article] [PubMed] [Google Scholar]
- 50. Whitfield KC, Karakochuk CD, Liu Y, McCann A, Talukder A, Kroeun H, Ward M, McNulty H, Lynd LD, Kitts DD et al.. Poor thiamine and riboflavin status is common among women of childbearing age in rural and urban Cambodia. J Nutr. 2015;145(3):628–33. [DOI] [PubMed] [Google Scholar]
- 51. Ummarino S, Mozzon M, Zamporlini F, Amici A, Mazzola F, Orsomando G, Ruggieri S, Raffaelli N. Simultaneous quantitation of nicotinamide riboside, nicotinamide mononucleotide and nicotinamide adenine dinucleotide in milk by a novel enzyme-coupled assay. Food Chem. 2017;221:161–8. [DOI] [PubMed] [Google Scholar]
- 52. Greibe E, Lildballe DL, Streym S, Vestergaard P, Rejnmark L, Mosekilde L, Nexo E. Cobalamin and haptocorrin in human milk and cobalamin-related variables in mother and child: a 9-mo longitudinal study. Am J Clin Nutr. 2013;98(2):389–95. [DOI] [PubMed] [Google Scholar]
- 53. Nommsen LA, Lovelady CA, Heinig MJ, Lönnerdal B, Dewey KG. Determinants of energy, protein, lipid, and lactose concentrations in human milk during the first 12 mo of lactation: the DARLING Study. Am J Clin Nutr. 1991;53(2):457–65. [DOI] [PubMed] [Google Scholar]
- 54. Karmarkar M, Ramakrishnan C.. Studies in human lactation. Relation between the dietary intake of lactating women and the chemical composition of milk with regard to principal and certain inorganic constituents. Acta Paediatr. 1960;49(5):599–604. [PubMed] [Google Scholar]
- 55. Garg M, Thirupuram S, Saha K. Colostrum composition, maternal diet and nutrition in North India. J Trop Pediatr. 1988;34(2):79–87. [DOI] [PubMed] [Google Scholar]
- 56. Lönnerdal B. Nutritional and physiologic significance of human milk proteins. Am J Clin Nutr. 2003;77(6):1537S–43S. [DOI] [PubMed] [Google Scholar]
- 57. Casado B, Affolter M, Kussmann M. OMICS-rooted studies of milk proteins, oligosaccharides and lipids. J Proteomics. 2009;73(2):196–208. [DOI] [PubMed] [Google Scholar]
- 58. Lönnerdal B, Forsum E, Hambraeus L. A longitudinal study of the protein, nitrogen, and lactose content of human milk from Swedish well-nourished mothers. Am J Clin Nutr. 1976;29(10):1127–33. [DOI] [PubMed] [Google Scholar]
- 59. Dror DK, Allen LH. Retinol-to-fat ratio and retinol concentration in human milk show similar time trends and associations with maternal factors at the population level: a systematic review and meta-analysis. Adv Nutr. 2018;9(1 Suppl):332S–46S. [DOI] [PMC free article] [PubMed] [Google Scholar]
- 60. Boersma ER, Offringa PJ, Muskiet F, Chase WM, Simmons IJ. Vitamin E, lipid fractions, and fatty acid composition of colostrum, transitional milk, and mature milk: an international comparative study. Am J Clin Nutr. 1991;53(5):1197–204. [DOI] [PubMed] [Google Scholar]
- 61. Lopez C. Milk fat globules enveloped by their biological membrane: unique colloidal assemblies with a specific composition and structure. Curr Opin Colloid Interface Sci. 2011;16(5):391–404. [Google Scholar]
- 62. Picciano MF. Human milk: nutritional aspects of a dynamic food. Neonatology. 1998;74:84–93. [DOI] [PubMed] [Google Scholar]
- 63. Roth J, Berger E. Immunocytochemical localization of galactosyltransferase in HeLa cells: codistribution with thiamin pyrophosphatase in trans-Golgi cisternae. J Cell Biol. 1982;93:223–9. [DOI] [PMC free article] [PubMed] [Google Scholar]
- 64. Bettendorff L, Wins P. Critical review: biological functions of thiamin derivatives: focus on non-coenzyme roles. OA Biochemistry. 2013;1(1):1–9. [Google Scholar]
- 65. Ball GFM. Bioavailability and analysis of vitamins in foods. Berlin: Springer; 2013. [Google Scholar]
- 66. Elmadfa I, Majchrak D, Rust P, Genser D. The thiamine status of adults depends on carbohydrate intake. Int J Vitam Nutr Res. 2001;71(4):217–21. [DOI] [PubMed] [Google Scholar]
- 67. Huskisson E, Maggini S, Ruf M. The role of vitamins and minerals in energy metabolism and well-being. J Int Med Res. 2007;35(3):277–89. [DOI] [PubMed] [Google Scholar]
- 68. Macias C, Schweigert FJ. Changes in the concentration of carotenoids, vitamin A, alpha-tocopherol and total lipids in human milk throughout early lactation. Ann Nutr Metab. 2001;45(3):82–5. [DOI] [PubMed] [Google Scholar]
- 69. Fang Y-Z, Yang S, Wu G. Free radicals, antioxidants, and nutrition. Nutrition. 2002;18(10):872–9. [DOI] [PubMed] [Google Scholar]
- 70. Barile M, Giancaspero TA, Leone P, Galluccio M, Indiveri C. Riboflavin transport and metabolism in humans. J Inherit Metab Dis. 2016;39(4):545–57. [DOI] [PubMed] [Google Scholar]
- 71. Tsujita M, Tomita S, Miura S, Ichikawa Y. Characteristic properties of retinal oxidase (retinoic acid synthase) from rabbit hepatocytes. Biochim Biophys Acta. 1994;1204(1):108–16. [DOI] [PubMed] [Google Scholar]
- 72. Graham JM, Haskell MJ, Pandey P, Shrestha RK, Brown KH, Allen LH. Supplementation with iron and riboflavin enhances dark adaptation response to vitamin A–fortified rice in iron-deficient, pregnant, nightblind Nepali women. Am J Clin Nutr. 2007;85(5):1375–84. [DOI] [PubMed] [Google Scholar]
Associated Data
This section collects any data citations, data availability statements, or supplementary materials included in this article.