

Abstract
Plasma membrane carboxypeptidase-D (CPD) hydrolyzes C-terminal arginine (Arg) from extracellular substrates, and Arg is converted into nitric oxide (NO) in the cell. CPD is upregulated by prolactin (PRL) and androgens in breast cancer (BCa) cells, increasing NO production to promote cell survival. EDD E3 ubiquitin ligase, upregulated by PRL/androgens, is implicated in TORC1 signaling. This study investigated CPD and EDD in triple-negative (TNBC) and HER2+ BCa. Kaplan-Meier analysis showed a negative correlation between CPD or EDD mRNA expression in TNBC patients and relapse-free survival. Immunohistochemistry showed that benign and malignant breast tissues stained abundantly for the PRL receptor (PRLR) and androgen receptor (AR). CPD and EDD staining were elevated in TNBC and HER2+ tumors as compared to benign tissues. In TNBC/HER2+ cell lines, CPD and EDD protein expression were upregulated by PRL or synthetic androgen methyltrienolone (R1881) at 3-6 h. PRL/R1881-induced CPD in TNBC and HER2+ cells increased intracellular NO production, which was abolished by PRLR antagonist ∆1-9-G129R-hPRL and AR antagonist flutamide. In turn, treatment with NO increased viability and decreased apoptosis in Arg-deprived TNBC cells. Cell viability and apoptosis were also affected in HER2+ cells with CPD knockdown. Lastly, EDD knockdown decreased PRL/R1881-induced phosphorylation of initiation factor 4E binding protein-1 and decreased 4E release in TNBC cells. In summary, PRL/R1881-induced CPD promotes TNBC/HER2+ cell survival through production of NO, and EDD promotes TNBC cell survival by TORC1 activation. This study implicates CPD and EDD as useful therapeutic targets for TNBC/HER2+ tumors, and suggests that PRLR and AR blockade are also beneficial to these patients.
Keywords: Prolactin, androgen, carboxypeptidase-D, EDD E3 ligase, cell survival, breast cancer
Introduction
Breast cancer (BCa) is classified into four main molecular subtypes, namely, luminal-A, luminal-B, HER2+ and triple-negative (TNBC), that are used to determine the choice of therapy. The luminal-A subtype, representing 50-60% of all BCa, is characterized by high expression of the estrogen receptor (ER) and/or progesterone receptor (PR) but negative expression of human epidermal growth factor receptor-2 (HER2), and low levels of proliferation marker Ki-67 [1,2]. Luminal-A BCa patients have a good prognosis with a low relapse rate as compared to other BCa subtypes. The luminal-B subtype (15-20% of BCa) is ER+, PR+/-, HER2+/-, has high levels of Ki-67 [2], a more aggressive phenotype, and worse patient prognosis than luminal-A [3,4]. The HER2+ subtype (15-20% of BCa) can be ER+, albeit at lower levels [2], is aggressive, highly proliferative, and patients have a poor prognosis if not treated [2]. Finally, the TNBC subtype (8-20% of BCa) is ER-, PR-, HER2-, has high mortality rates due to high cell proliferation rates, copy number imbalances and, in most cases, mutations in the TP53 gene [5-8]. TNBC can be further sub-classified as basal-like or claudin-low, both are highly aggressive, highly metastatic to the brain and lung, and patients have poor prognosis [2,7,9-11].
The main treatment modalities for BCa are surgery, radiation, endocrine, chemo, and targeted therapies. ER+ luminal-A/-B tumors are treated by endocrine therapy, e.g., with tamoxifen, and sometimes combined with systemic chemotherapy [12]. HER2-enriched BCa are subjected to anti-HER2 targeted therapy, e.g., with trastuzumab, coupled with chemotherapy [13]. For the TNBC subtype, chemotherapy regimens are recommended, and although initially effective, resistance to chemotherapeutic drugs often occurs in recurrent tumors. Therefore, despite advances made in the treatment of BCa, it is desirable to identify additional molecular targets that contribute to their high histological grade, poor differentiation, and aggressiveness. These may include the androgen receptor (AR) and prolactin receptor (PRLR), which are expressed in some TNBC tumors [11,14-17]. AR+ TNBC respond to androgens for cell growth and patients benefit from AR-targeted therapies [11,14-16]. In contrast, expression of PRLR in TNBC is reported to promote pro-differentiation pathways and better patient survival outcomes [17].
In our study of hormone-responsive genes, we reported that androgens and prolactin (PRL) activate pro-survival pathways involving metalloproteinase carboxypeptidase-D (CPD) [18-21] and EDD E3 ubiquitin ligase (UBR5) [22-24] in BCa cells. CPD, located in the plasma membrane, cleaves C-terminal arginine (Arg) from extracellular substrates, and Arg is taken into cells to produce nitric oxide (NO) [25,26]. CPD gene expression is upregulated by PRL, 17β-estradiol, and androgens, and activation of the CPD-Arg-NO pathway increases viability and decreases apoptosis of human luminal-A BCa cell lines in vitro [19]. Immunohistochemical analysis of human breast tissues has shown progressive increases in CPD, nitrotyrosine (indicating NO-nitrosylated tyrosine residues in tissues), Ki-67, and BCa progression marker Cullin-3, from low levels in benign tissues to high levels in ductal carcinoma in situ, low-grade, and high-grade BCa [21], supporting a pro-survival CPD-Arg-NO pathway in vivo.
EDD (E3 isolated by differential display) or UBR5 was first reported as a progestin-inducible gene in human T47D BCa cells [27,28]. EDD is the mammalian ortholog of the Drosophila hyperplastic discs gene that controls cell proliferation during development [29]. Human EDD is ubiquitously expressed and its elevated level in some solid tumors implies a role in tumorigenesis [30,31]. EDD is recognized as a key regulator of various cellular processes in cancer, including gene expression, genome integrity, and chemo-resistance [32]. Through yeast 2-hybrid analysis, we identified EDD as a novel protein partner of the TORC1-associated protein complex comprising α4-phosphoprotein and the catalytic subunit of protein phosphatase 2A (PP2Ac) [22]. The α4-PP2Ac complex regulates TORC1 phosphorylation of ribosomal S6 kinase and eukaryotic initiation factor 4E (eIF4E)-binding protein 1 (4EBP1), leading to the initiation of protein translation, cell-cycle progression, and cell proliferation [33-36]. We showed that PP2Ac, polyubiquitinated by EDD, undergoes proteasomal degradation, and EDD upregulation by progesterone and PRL in human luminal-A MCF-7 and T47D cell lines is accompanied by a decrease in PP2Ac levels [23]. We also reported that knockdown of EDD gene expression decreases both PRL-induced phosphorylation of 4EBP1 and the release of eIF4E, events that inhibit protein translation and cell cycle progression [24].
The present study investigated the biological significance of CPD and EDD in TNBC and HER2+ subtypes specifically. In vivo studies involved immunohistochemical analysis of archival formaldehyde-fixed, paraffin-embedded (FFPE) human benign and malignant breast tissues, and Kaplan Meier-plot analysis of CPD and EDD mRNA expression in TNBC patients. The effects of CPD and EDD gene knockdown were determined using TNBC and HER2+ cell lines in vitro.
Materials and methods
Antibodies and reagents
Rabbit anti-CPD antibody, raised to synthetic (HRLRQHHDEYEDEIR) 8-multiantigen peptide, was custom-made and affinity-purified, as previously described [18]. Primary antibodies used (and sources) were: rabbit anti-PRLR polyclonal antibody H-300 (Cat. #sc-20992) or its replacement mouse anti-PRLR monoclonal antibody D-7 (Cat. #sc-377098), both raised against amino acids 323-622 at the hPRLR C-terminus, and mouse anti-EDD (Cat. #sc-515494) (all from Santa Cruz Biotechnology, Santa Cruz, CA); rabbit anti-androgen receptor (AR) (Cat#. ab74272) recognizing the N-terminus, and anti-phospho-Stat5a (Y694) clone E208 (Cat. #ab32364) (Abcam Inc., Toronto, ON, Canada); rabbit anti-nitrotyrosine (Cat. #06-284) which detected all nitrosylated proteins (Millipore Corp., Temecula, CA); rabbit anti-4EBP1 (Cat. #9452) which detected total 4EBP1, independent of phosphorylation, and rabbit anti-eIF4E (Cat. #9742) (Cell Signaling Technology, Danvers, MA). Anti-CPD, EDD, PRLR (H-300), AR, phospho-Stat5a, and nitrotyrosine antibody specificities have been determined in our studies [21,24,37,38]. Anti-PRLR (H-300) has also been validated by others [17,39-45]. Rabbit anti-β-actin (1:20,000), secondary antibodies goat anti-rabbit IgG (1:5000) and goat anti-mouse IgG (1:5000) horse radish peroxidase (HRP) conjugates were from Sigma-Aldrich (Oakville, ON, Canada).
Other reagents include AR antagonist flutamide and recombinant human PRL (both from Sigma-Aldrich Canada), and synthetic androgen methyltrienolone (R1881) (GE Healthcare, Chicago, IL). PRL receptor antagonist ∆1-9-G129R-hPRL was a generous gift from Dr. Vincent Goffin (Inserm, France).
Kaplan-Meier survival analysis
Online database (http://kmplot.com/analysis/) was used to determine the clinical relevance of CPD or EDD mRNA expressions to relapse-free survival of TNBC patients. Survival hazard ratio, 95% confidence intervals, and the log rank P were calculated and displayed on the respective webpages.
Tissue collection
Anatomical pathology electronic files (Cerner Millenium) for the Queen Elizabeth II Health Sciences Centre, Nova Scotia Health Authority were retrospectively searched for a cohort of invasive breast carcinomas beginning January 1, 2011, as previously described [21]. For this study, FFPE breast tissues were used with approval from the QEII Research Ethics Board, and Materials Transfer and Collaboration Agreement between the Nova Scotia Health Authority, Central Zone, and Dalhousie University. A total of 52 cases of invasive BCa were analyzed, along with 36 matched benign breast tissues. The invasive BCa samples included 23 from TNBC patients and 15 from HER2+ BCa patients.
Immunohistochemistry (IHC)
FFPE sections (5 mm) were deparaffinized, rehydrated and immunostained for AR, PRLR, phospho-Stat5, CPD, nitrotyrosine, or EDD using the following staining systems: for AR, PRLR, phospho-Stat5 and CPD, UltraTek HRP Anti-Polyvalent Ready-To-Use Staining Kit (ScyTek Laboratories, Logan, Utah); for EDD, iDetect Super Stain System (Empire Genomics, Williamsville, NY); following the manufacturers’ instructions. Immunostainings for EDD, AR, nitrotyrosine and phospho-Stat5 were improved using antigen target retrieval for 20-30 min in 96°C citrate buffer (Dako Target Retrieval Solution), as previously described [24]. Immunostaining was analyzed by computerized image analysis of 4-7 fields per slide using ImageJ64 (NIH), as previously described [38]. All slides were evaluated by one person (LT) to ensure consistency.
Cell culture
Human BCa cell lines were maintained as follows: MCF-7 (luminal-A) cells in high-glucose Dulbecco’s Modified Eagle’s Medium (DMEM) containing 10% heat-inactivated fetal bovine serum (FBS), 2 mM L-glutamine, 1X non-essential amino acids, 1 mM sodium pyruvate and 1X penicillin-streptomycin; MDA-MB-231 (TNBC) and SKBR3 (HER2-enriched) cells in high-glucose DMEM containing 10% heat-inactivated FBS, 2 mM glutamine, 5 mM 4-(2-hydroxyethyl)-1-piperazineethane sulfuric acid (HEPES) and 1X penicillin-streptomycin; MDA-MB-468 (TNBC) cells in high-glucose DMEM containing 10% heat-inactivated FBS, 2 mM glutamine and 1X penicillin-streptomycin. Before hormone treatment, cells were made quiescent for 24 h in phenol red-free DMEM containing 1% charcoal-stripped heat-inactivated FBS and all additives in the maintenance medium.
Preparation of total cell lysates
Cells were harvested in RIPA lysis buffer containing 100:1 (v/v) of protease inhibitor cocktail P8340 (Sigma-Aldrich), 1 mM sodium orthovanadate and 1 mM phenylmethylsulphonyl fluoride, and homogenized through 21-gauge needles. The 13,000 rpm supernatant was collected as previously described [20] and used immediately or frozen at -30°C until further analysis.
Transfection of siRNA
Silencer® Select Negative Control siRNA #1 and #2, pre-designed UBR5 Silencer® Select siRNA targeting hEDD (ID #s28025: siEDD) or hCPD (ID #103996: siCPD1, ID #103997: siCPD2) (ThermoFisher Scientific, Burlington, ON, Canada) were previously described [19,23]. Cells were plated in complete medium at 3-5 × 10⁵ cells/well in 6-well plates for 24 h, then transfected with 40 pmol of siRNA (siCPD or siEDD) or non-targeting siRNA (siNT) as negative control, using RNAiMAXTM (Life Technologies) following the manufacturer’s protocol. After 24-120 h (Days 1-5), cells were processed for RT-PCR, immunoblotting, or flow cytometry.
Reverse transcription-polymerase chain reaction (RT-PCR)
Total RNA, extracted from cells using EZ-10 DNAaway RNA mini-prep kits (BioBasic, Markham, ON, Canada), was treated with DNase 1, reversed transcribed, and used (1 µg/reaction) for semi-quantitative PCR [19] or quantitative-PCR (qPCR) using the Comparative Cycle Threshold (Ct) method [20], with β-actin as a control. The following forward and reverse primer sets were used: Human CPD: 5’-ATG-GCA-GGG-GTA-TAT-TAA-ATG-CCA-3’ and 5’-GGA-TAC-CAG-CAA-CAA-AAC-GAA-TCT-3’ (576-bp product for semi-quantitative PCR) [19], and 5’-ACC-AAT-TTG-GGA-CAG-AGC-AC-3’ and 5’-TTG-GGT-AAC-AGC-TGG-GTT-CT-3’ (201 bp for qPCR) [20]. Human EDD: 5’-GAC-GCG-AGA-ACT-CTT-GGA-AC-3’ and 5’-TTC-AAA-TGG-ATT-TGG-GGG-TA-3’ (196 bp product; for qPCR) [24]; β-actin: 5’-AAA-CTG-GAA-CGG-TGA-AGG-TG-3’ and 5’-AGA-GAA-GTG-GGG-TGG-CTT-TT-3’ (172 bp; for both semi-quantitative and qPCR) [20]. For semi-quantitative PCR, PCR cycle numbers and annealing temperatures were predetermined to ensure linear range of amplification: 30 cycles for CPD primers (0.5 μM) and 25 cycles for β-actin primers (0.5 μM), both at 54°C. For qPCR, the annealing temperatures were: EDD primers (1 μM) at 52°C and β-actin primers (0.5 μM) at 54°C. PCR products were resolved in 1.5% agarose gels containing 0.5 μg/ml ethidium bromide and visualized using a Versadoc UV-transilluminator (Bio-Rad). Densitometry was performed using ImageLab™ (Bio-Rad) with β-actin as a control.
Trypan blue cell viability assay
Cells were detached using 0.25% trypsin-EDTA, then inactivated with an equal volume of growth medium before mixing with 0.4% trypan blue solution (1:1). Cells were counted using a TC20 cell counter (Bio-Rad Laboratories, Montreal, QC, Canada).
DAF-2T analysis for intracellular NO
Cells were seeded at a density of 25,000-50,000 cells/well onto Lab-Tek II CC2 glass 4-chambered slides (ThermoFisher Scientific). After 24 h, the cells were made quiescent in Arg-free DMEM containing 2% charcoal-stripped-FBS for 48 h. Quiescent cells were treated with PRL (20 ng/ml) and/or R1881 (10 nM) for 2-3 h, and some were also pre-treated with Δ1-9-G129R-hPRL (40 ng/ml) and/or flutamide (20 μM) 15 min prior to the addition of hormones. Cells were washed thrice with PBS and incubated with 4,5-diaminofluorescein diacetate (DAF2-DA; 10 μM; Abcam) for 30 min (for MDA-MB-231 and MDA-MB-468) or 60 min (for SKBR3). When taken into cells, non-fluorescent DAF-2DA is hydrolyzed by intracellular esterases to membrane-impermeable 4,5-diaminofluorescein (DAF-2), which reacts with NO to produce fluorescent 4,5-diaminofluorescein triazole (DAF-2T). The cells were then washed with PBS, incubated with synthetic CPD substrate furylacryloyl-alanyl-Arg (FAR, 4 mM; Bachem, Torrance, CA) for 30 min, washed once in PBS, then fixed onto the slides with 2% (w/v) paraformaldehyde in PBS for 3 min on ice. The chambers were removed and cover slips put on using glycerol-gelatin mounting medium (Sigma-Aldrich). Fluorescence was examined using a Zeiss Axiovert 200M inverted microscope. Images were captured using a Hamamatsu Orca-R2 camera and analyzed using Cell Profiler™ image analysis software. Fluorescent SKBR3 cells were also counted using Adobe Photoshop and results confirmed using the Cell Profiler™ software.
Treatment with NO donor
MDA-MB-231 or MDA-MB-468 cells were seeded in complete medium at a density of 100,000 cells per well in 6-well plates. After 24 h, the culture medium was changed to Arg-free medium containing 5% charcoal-stripped FBS. After another 24 h, the cells were treated with increasing concentrations of synthetic NO donor (Z)-1-[N-(2[aminoethyl])-N-(2-ammonioethyl)amino]-diazen-1-ium-1,2-diolate (DETA-NONOate; Sigma-Aldrich Canada) and 3 days later, viable cells were counted.
Western analysis
Sodium dodecyl sulphate-polyacrylamide gel electrophoresis (SDS-PAGE) was performed with 10-20 µg protein/lane. After immunoblotting, immunoreactive signals were detected using Clarity Western ECL Substrate (Bio-Rad). Densitometry was performed using ImageJ64 (NIH, Bethesda, MD) with β-actin as a control.
Annexin V-staining for apoptosis
Annexin-V-FLUOS (FITC) staining (Roche Diagnostics, Mannheim, Germany) was performed following the manufacturer’s protocol. Briefly, both floating and adherent cells were collected, washed once with PBS, pelleted, and resuspended in 100 µL of incubation buffer containing Annexin V-FITC labeling reagent and propidium iodide (PI). Cell samples were incubated in the dark at room temperature for 5-10 min and diluted with another 0.3 mL of incubation buffer before flow cytometry at λexcitation 488 nm and detection at λemission 515 nm (Annexin V) and 600 nm (PI). Data was analyzed using FCS Express-3 DeNovo Software (Glendale, CA). The percentage of cell death was calculated from cells that stained positive for either Annexin V-FITC (early apoptosis) or Annexin V-FITC and PI (late apoptosis).
CAP-binding assay
Cell lysates were prepared from cells transfected ± siNT1 or siEDD, and treated ± PRL (10 ng/ml) or R1881 (10 nM) for 1 h, followed by CAP-binding assays as previously described [24]. Briefly, immobilized γ-aminophenyl-m7GTP (C10-spacer) agarose beads (Jena Biosciences, Germany) were pre-washed thrice with freshly-prepared RIPA lysis buffer containing 100:1 (v/v) of protease inhibitor cocktail P8340 (Sigma-Aldrich), 1 mM sodium orthovanadate and 1 mM phenylmethylsulphonyl fluoride. Each cell lysate sample (100 µg protein) and pre-washed m7GTP-agarose beads (25 µl) were incubated together in a microfuge tube, gently agitated on a nutator at 4°C for 3 h, and the 500 × g (1 min) supernatants were removed. The protein-bound m7GTP-agarose beads in each tube were washed thrice with 1 ml RIPA buffer, re-centrifuged at 500 × g, and the supernatants were removed. The protein-bound m7GTP-agarose beads were boiled in 50 μl of 1X SDS-PAGE buffer at 100°C for 15 min to elute m7GTP CAP-binding proteins. Eluted fractions and the corresponding whole cell lysates were resolved by SDS-PAGE and analyzed by Western blotting for eIF4E, 4EBP1, and β-actin.
Statistics
Statistical analyses were performed using GraphPad Prism. Results were expressed as mean ± SEM. ANOVA was used to compare mean values. P-values ≤ 0.05 were considered significant.
Results
High CPD and EDD mRNA expressions correlate with poor TNBC patient survival
We previously reported that BCa patients with high EDD mRNA expression had significantly lower probability of overall survival [24]. In the present study, Kaplan-Meier-Plot analyses (http://kmplot.com/analysis/), performed specifically on TNBC, showed that basal-like TNBC patients with high mRNA expression of CPD or EDD (Figure 1) had a significantly lower probability of relapse-free survival.
Figure 1.

Kaplan-Meier Plots: prognostic value of CPD or EDD mRNA expression in TNBC patients. (A, B) KM plots were obtained from online database (http://kmplot.com/analysis/) to show the impact of CPD or EDD mRNA expression on relapse-free survival in TNBC patients. Survival curves for (A) CPD (Affymetrix ID: 201941_) in basal-like patients (n=618) or (B) EDD (UBR5), Affymetrix ID: 208882_s_, in basal-like (high-grade 3) patients (n=293). Patient samples were bifurcated by the median into low (black) and high (red) expression groups for each gene. Survival hazard ratio, 95% confidence intervals, and log rank P were displayed on the webpage. P value of <0.05 was considered statistically significant.
IHC: AR, PRLR and phospho-Stat5 are abundant in TNBC and HER2+ tumors
To study the biological significance of CPD and EDD in TNBC and HER2+ subtypes, the presence of AR and PRLR in these tumors were examined since both CPD and EDD are induced by androgens and PRL. Paraffin-embedded human breast tissues were used for IHC analysis of AR and PRLR, and of phospho-Stat5, the primary PRLR signaling mediator. Comparisons were made among the following groups: high-grade BCa regardless of receptor status (ER+/-, PR+/-, HER2+/-, including TNBC), TNBC, HER2+ BCa, and benign breast tissues. All TNBC and HER2+ tissues analyzed were high-grade BCa (or grade 3), except for one TNBC sample, which was a grade 2 malignancy (shown as a red dot in the IHC results).
IHC analysis showed the presence of AR and PRLR in TNBC and HER2+ tumors. Average AR staining levels were high in benign and malignant breast tissues (Figure 2A). Both nuclear and cytoplasmic AR staining were observed in all groups. Specifically, AR staining as a percentage of total area (mean ± SEM) was 55.44±10.35, 44.96±5.39, 33.76±6.87 and 58.85±11.95% in benign, total high-grade, TNBC and HER2+ tissues, respectively. Staining levels were variable in all tissue types and there were no significant differences among them. Importantly, Figure 2 showed that TNBC and HER2+ tumors, as well as corresponding benign tissues, express the AR, suggesting that they could respond to androgens and express AR-regulated signaling pathways leading to survival and/or growth of tumor cells, even in the absence of ER, PR and HER2+ signaling. This is less important in benign tissues, which do contain these receptors, but may be critically important for growth of TNBC. The anti-AR antibody (Cat#. ab74272) is widely used for IHC immunostaining for AR in various tissues, including BCa and prostate cancer [46-51]. Others have reported AR expression in TNBC classified as the luminal AR-(LAR) subtype, [11,14-16]. LAR patients have decreased relapse-free survival, likely due to local metastasis [11]. LAR cell lines have lower cell proliferation rates than other TNBC subtypes, resulting in partial chemo-resistance [52], but are particularly sensitive to AR antagonists bicalutamide and enzalutamide [11,53,54].
Figure 2.

IHC: AR staining is high in benign and malignant breast tissues. FFPE high-grade (HG; grade-3, regardless of receptor status), TNBC, HER2+ tumors or matched benign breast tissues were sectioned at 5 µm and used in IHC analysis for AR levels and distribution (see Materials and Methods). A. Representative AR staining in benign breast tissue, HG, TNBC and HER2+ tumors. B. Graph depicts AR staining area as a % of total area; mean ± SEM, along with individual data points. Red dot indicates a grade-2 TNBC sample. n = number of specimens for each group.
We have reported that PRLR immunostaining was abundant in benign breast tissues and in low-grade and high-grade BCa [21]. While the rabbit polyclonal PRLR antibody H-300 that we, and many others [17,39-45], have used for PRLR IHC is no longer available commercially, its replacement, mouse monoclonal antibody clone D-7, was raised against the same epitope. However, a comparison of the two anti-PRLR antibodies using near adjacent sections of three different BCa specimens showed that D-7 gave positive staining in only one specimen, whereas H-300 was robustly positive in all three (Figure 3A). Therefore, we used phospho-Stat5 to represent the activated PRLR. Phospho-Stat5 levels were variable but average staining was high, with both nuclear and cytoplasmic staining, in all groups (Figure 3B). As before [21], IHC analysis of near adjacent tissue sections showed that phospho-Stat5 co-stained with PRLR (detected using H-300). Phospho-Stat5 staining, as a percentage of total area (mean ± SEM), was 37.36±5.91, 46.51±3.33, 38.96±4.80 and 61.70±5.21% in benign, total high-grade, TNBC and HER2+ tissues, respectively (Figure 3C). Staining in HER2+ tissues was significantly higher than in benign and total high-grade tissues. Others have reported that PRLR in TNBC promotes pro-differentiation pathways that predict better patient survival outcomes [17]. Similarly, nuclear localized, phospho-Stat5a that was detected in a high proportion (up to 75%) of BCa that were primarily ER+, but also HER2+ and TNBC, was associated with tumor differentiation and better patient survival [55-57].
Figure 3.

PRLR and phospho-Stat5 stainings are high in benign and malignant breast tissues. A. Comparison of anti-PRLR antibodies H-300 and D-7. Three different FFPE BCa tumors were cut and near-adjacent sections from each were immunostained for PRLR, using either rabbit polyclonal H-300 or its replacement mouse monoclonal clone D-7, each raised to the same epitope in the hPRLR (see Materials and Methods). B, C. As in Figure 2, FFPE breast tissues were used in IHC analysis for phospho-Stat5. Some near-adjacent sections were also stained for PRLR, using anti-PRLR H-300 antibody. B. Representative phospho-Stat5 and PRLR immunostaining as indicated. C. Graph depicts phospho-Stat5 staining as a % of total area; mean ± SEM. Red dot indicates a grade-2 TNBC sample. *, significantly higher (P<0.05) staining in HER2+ tissues than in benign. #, significantly higher (P<0.05) staining in HER2+ than in HG tissues.
CPD and EDD immunostaining are elevated in TNBC and HER2+ tumors
CPD staining was widely variable, but average levels were significantly higher in malignant than in benign breast tissues (Figure 4A). CPD staining was mainly cytoplasmic but also strongly pericellular, which is consistent with CPD localization in the trans-Golgi network and plasma membrane, respectively. CPD staining, as a percentage of total area (mean ± SEM), was 8.43±1.74, 39.54±4.27, 37.75±6.39 and 53.93±9.37% in benign, total high-grade, TNBC and HER2+ tissues, respectively (Figure 4B). The one TNBC that was a grade 2 malignancy (red dot) had high CPD staining of 29.96%, despite its lower grade status. Staining in all cancer groups was significantly higher than in benign tissues. Furthermore, IHC analysis of adjacent sections showed that CPD and nitrotyrosine staining often co-localized in TNBC and HER2+ tissues (Figure 4C). Tumor areas that stained strongly for CPD also stained strongly for nitrotyrosine, whereas other areas stained weakly for both CPD and nitrotyrosine. Costaining of CPD and nitrotyrosines supports a role for CPD in NO production.
Figure 4.

CPD staining is high in TNBC and HER2+ BCa. As in Figure 2, FFPE breast tissues were used in IHC analysis for CPD. A. Representative CPD staining as indicated. B. Graph depicts CPD staining area as a % of total area; mean ± SEM. Red dot indicates a grade-2 TNBC sample. * significantly higher (P<0.05) staining in all BCa tissues than benign tissues. C. CPD co-localized with nitrotyrosine (NT) staining. Adjacent sections of FFPE high-grade TNBC and HER2+ tumors were immunostained for CPD or NT. Closed black arrows: areas with intense staining for both CPD and NT. Open black arrows: areas with weak staining for both.
EDD staining levels were significantly higher in malignant than in benign breast tissues (Figure 5A). EDD staining was mainly cytoplasmic, but nuclear staining was also present especially in malignant tissues. EDD staining, as a percentage of total area (mean ± SEM), increased from 20.24±5.81 in benign tissues to 61.26±3.99, 63.99±5.40 and 47.25±5.81 in total high-grade, TNBC and HER2+ tissues, respectively. EDD staining was lower in HER2+ than in other malignant tissues but this was not statistically significant. The one TNBC sample that was a grade 2 malignancy (red dot) had high EDD staining of 66.81%, despite its lower grade status.
Figure 5.

EDD staining is high in TNBC and HER2+ BCa. As in Figure 2, FFPE breast tissues were used in IHC analysis for EDD. A. Representative EDD staining as indicated. B. Graph depicts EDD staining levels as a % of total area; mean ± SEM. Red dot indicates a grade-2 TNBC sample. * significantly higher (P<0.05) staining in all BCa tissues than benign tissues.
PRL and R1881 upregulate CPD and EDD in TNBC and HER2-enriched cell lines
In vitro studies were next performed to investigate hormonal regulation of CPD and EDD gene expression in TNBC (MDA-MB-231, MDA-MB-468) and HER2-enriched (SKBR3) cell lines. The biological effects of CPD and EDD were examined, first to determine the effects of CPD and CPD-mediated production of NO on cell survival, and second, the effects of EDD on hormone-induced phosphorylation of TORC1 signaling.
MDA-MB-231, MDA-MB-468, and SKBR3 cell lines express PRLR (long and short isoforms), AR, CPD and EDD, as shown by Western analysis (Figure 6A). MDA-MB-231 cells have low, but detectable, levels of AR as compared to the other cell lines. Quiescent cells were treated with PRL or R1881 for 3 and 6 h. In MDA-MB-231 cells, PRL and R1881 upregulated CPD protein levels by over 2-fold (Figure 6B), with a significant increase at 6 h with PRL (P<0.001) and at 3 h with R1881 (P<0.05). PRL and R1881 also upregulated EDD protein levels by about 4-fold in this cell line, with a significant increase at 6 h with PRL (P<0.01), and at 3 h and 6 h with R1881 (P<0.01 at both time points).
Figure 6.
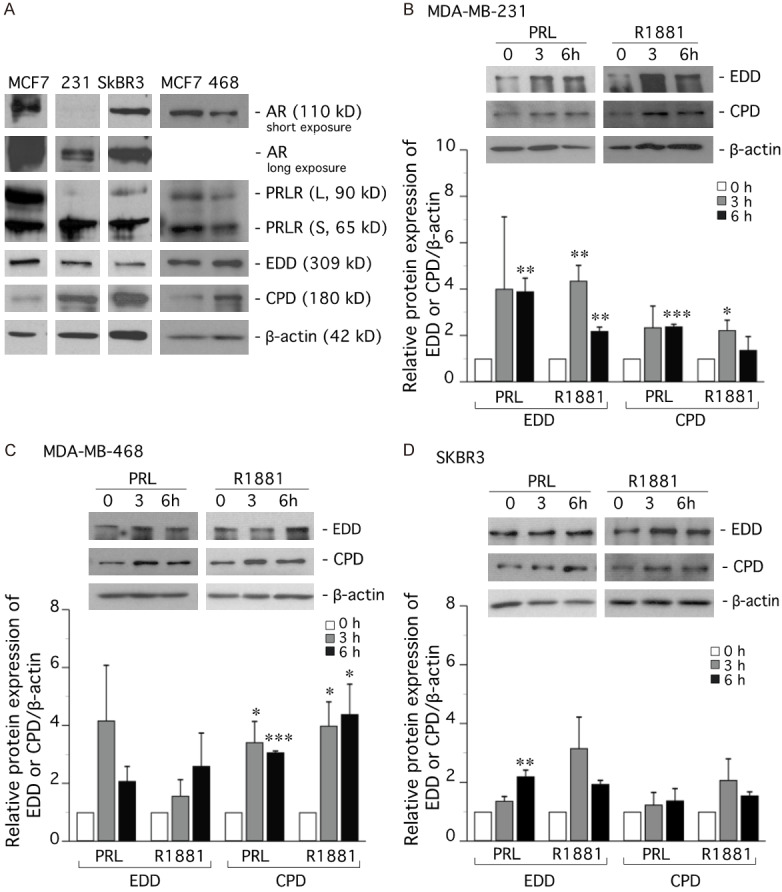
PRL and R1881 upregulate CPD and EDD in TNBC and HER-2-enriched cell lines. (A) Western analysis of PRLR (long and short forms), AR, CPD and EDD in TNBC (MDA-MB-231, MDA-MB-468) and HER2-enriched (SKBR3) cell lines. (B) MDA-MB-231, (C) MDA-MB-468, and (D) SKBR3 cells were made quiescent in DMEM supplemented with 1% charcoal-stripped FBS (charcoal removed steroids and PRL). After 24 h, the cells were treated with PRL (10 ng/ml) or R1881 (10 nM) for 3 or 6 h. Cell lysates were subjected to Western analysis and representative blots are displayed. Graphs show EDD and CPD expression as mean ± SEM of at least three independent experiments. *P<0.05 ; **P<0.01 ; ***P<0.001, compared to 0 h control.
In MDA-MB-468 cells, CPD levels were increased significantly (P<0.5 or P<0.001) from 3- to 4-fold by PRL or R1881 at 3 and 6 h. EDD protein levels were increased from 2 to 4-fold by each hormone (Figure 6C).
In SKBR3 cells, the hormonal effect was less pronounced. CPD protein levels were modestly increased with R1881 treatment at 3 h, whereas PRL treatment had little effect (Figure 6D). EDD protein levels increased following PRL or R1881 treatment, with a significant increase (P<0.01) at 6 h with PRL.
PRL/R1881 increase CPD-mediated NO production in TNBC and HER2-enriched cells
MDA-MB-231, MDA-MB-468 and SKBR3 cells were used to further examine activation of the CPD-Arg-NO pathway and intracellular NO production. MDA-MB-231 cells cultured in Arg-free medium displayed low or undetectable levels of intracellular NO (Figure 7A). The addition of synthetic CPD substrate FAR in the culture medium slightly increased intracellular NO production, which was further enhanced by the addition of PRL or R1881 alone, or these hormones in combination. Figure 7B showed that NO production increased by nearly 20-fold following FAR, PRL and R1881 treatment in combination, as compared to cells treated with FAR only. However, this production of NO was abolished by PRLR antagonist Δ1-9-G129R-hPRL and AR antagonist flutamide, indicating that PRLR and AR blockade inhibited CPD-mediated NO production.
Figure 7.

PRL/R1881 increase CPD-mediated NO production in TNBC and HER2-enriched cells. Quiescent MDA-MB-231 (A, B), MDA-MB468 (C), and SKBR3 (D) cells were cultured in Arg-free DMEM for 48 h. To the culture medium was then added PRL (20 ng/ml), R1881 (10 nM) or PRL+R1881 in combination for 2-3 h. Some cells were pre-treated with the receptor antagonists ∆1-9-129R-hPRL (∆1-9; 40 ng/ml) and/or flutamide (Flu; 20 mM) 15 min prior to adding hormones. Cells were then assayed for intracellular NO production using the DAF-2T assay (see Materials and Methods). (A) representative DIC and fluorescence microscopy images for MDA-MB-231 cells. (B-D) Intracellular DAF-2T fluorescence intensity was quantified using (B, C) CellProfiler or (D) manual counting of fluorescent cells followed by confirmation with CellProfiler. Fluorescent image data was normalized to the FAR control. Mean ± SEM (n=3-9). *P<0.01, **P<0.001.
Similarly, PRL and/or R1881 treatment stimulated NO production in MDA-MB-468 (Figure 7C) and SKBR3 (Figure 7D) cells, by 3-4-fold and 5-8-fold, respectively. In each cell line, the hormone-induced production of NO was inhibited by Δ1-9-G129R-hPRL and/or flutamide. Therefore, although R1881 and PRL had modest or little effect on CPD expression in SKBR3 cells (Figure 6D), each hormone significantly increased CPD-generated NO, indicating that the CPD-Arg-NO pathway was hormonally activated in these cells. Since this pathway influences cell survival, it was important to test the effect of CPD knockdown on cell viability and apoptosis.
Loss of CPD decreases TNBC cell viability. NO increases viability and decreases apoptosis
CPD gene expression in TNBC cells was knocked down using siRNA (Figure 8). RT-qPCR analysis confirmed that CPD levels in siCPD-transfected MDA-MB-231 and MDA-MB-468 cells decreased on Days 2, 3 and 4, as compared to cells transfected with non-targeting siRNAs or untransfected controls (Figure 8A). In MDA-MB-231 and MDA-MB-468 cells, loss of CPD significantly decreased cell viability (Figure 8B).
Figure 8.

Loss of CPD decreases TNBC cell viability. NO increases viability and decreases apoptosis. A, B. TNBC MDA-MB-231 and MDA-MB-468 cells were transfected with two sets of siRNA targeting CPD (siCPD1, siCPD2) or two sets of non-targeting siRNA (siNT1, siNT2) or left untransfected (Con). The day of transfection was designated Day 0. RNA was collected on Days 2, 3 and 4. A. RT-qPCR was used to measure CPD and β-actin mRNA expression. B. Cell viability was assessed by trypan blue cell counting. Data was normalized to the untransfected controls. Mean ± SEM of at least 3 independent experiments. **P<0.01, ***P<0.001, compared to siNT1-transfected cells. C. MDA-MB-231 and MDA-MB-468 cells, cultured in Arg-free medium containing 5% heat-inactivated, charcoal-stripped FBS for 24 h, were treated with increasing concentrations of DETA-NONOate. Cell viability was assessed by trypan blue cell counting after 3 days. Mean ± SEM (n=4). ***P<0.001 compared to control. D. MDA-MB-231 cells, in Arg-free medium plus 5% heat-inactivated, charcoal-stripped FBS for 48 h were treated ± PRL and ± FAR, then stained with Annexin V/PI for flow cytometry (see Materials and Methods). Cells undergoing apoptosis (both early and late) were plotted. Mean ± SEM (n=3). ***P<0.001.
To show that NO directly contributed to cell viability, cells were treated with synthetic NO donor DETA-NONOate. MDA-MB-231 and MDA-MB-468 cells cultured in Arg-free medium containing sub-optimal 5% charcoal-stripped FBS showed poor cell viability when compared to cells cultured in routine mediuim containing 5%-complete FBS (Figure 8C). However, under this sub-optimal growth condition, MDA-MB-231 cell viability was increased by DETA-NONOate at concentrations of 10-100 μM, with 25 μM giving a significant (P<0.001, n=3) effect. MDA-MB-468 cell viability was also significantly increased (P<0.001) by 25 μM DETA-NONOate.
MDA-MB-231 cells cultured in Arg-free medium but given PRL (to upregulate CPD gene expression) and the CPD substrate FAR displayed a significant (P<0.001, n=3) decrease in the percentage of apoptotic cells (58.82±2.19%) when compared to untreated control cells (77.94±2.51%) (Figure 8D). Therefore, NO, generated by either DETA-NONOate or PRL-induced CPD, increased TNBC viability and decreased apoptosis.
Loss of CPD decreases viability and increases apoptosis of HER2-enriched cells
In the HER2-enriched SKBR3 cell line, siRNA-knock down of CPD gene expression was effective for 2-6 days, as confirmed using semi-quantitative RT-PCR (Figure 9A) and Western (Figure 9B) analyses. The loss of CPD decreased the number of viable cells over this time period, and this decrease was significant (P<0.05, P<0.01; n=4) on Days 4 and 5 (Figure 9C). Furthermore, FACS analysis showed that loss of CPD significantly increased both early-stage and late-stage apoptosis (P<0.01 and P<0.05, respectively; n=4), as compared to siNT and untransfected controls (Figure 9D).
Figure 9.

Loss of CPD decreases viability and increases apoptosis of HER2-enriched cells. SKBR3 cells were transfected with siRNA targeting CPD (siCPD1 or siCPD2), non-targeting siRNA (siNT1) or left untransfected (Con). The cells were harvested on the days indicated to confirm CPD gene knockdown using (A) semi-quantitative RT-PCR or (B) Western analysis, with the CPD/b-actin ratio indicated in each case. (C) On days 2-6 post-transfection, live cells were counted with trypan blue (left panel), and cell counts on days 4 and 5 were replotted to clearly show statistical significance (right panel). Mean ± SEM (n=4). *P<0.05, **P<0.01. (D) SKBR3 cells were transfected with CPD-targeting siCPD2 or non-targeting siNT1 or left untransfected (Con). On Day 5 post-transfection, cells were trypsinized, and stained with Annexin V/PI for flow cytometry. (Upper panel) Representative Annexin V/PI analysis of one sample set showing early apoptosis (bottom right quadrant) and late apoptosis (top right quadrant). (Lower panel) Graphs showing the % of cells in early and late apoptosis, normalized to untransfected cells. Mean ± SEM (n=4), *P<0.05, **P<0.01.
Loss of EDD decreases PRL/R1881-induced phosphorylation of 4EBP1 and release of 4E
Recently, we reported that loss of EDD arrested MCF-7 cells in the G2-phase of the cell cycle, decreased cell viability, and increased apoptosis [24]. Loss of EDD also decreased PRL-induced phosphorylation of 4EBP1 and the release of eIF4E, measured using Western and CAP-binding assays, respectively [24]. In the present study, we compared the effect of EDD loss on hormone-induced phosphorylation of 4EBP1 in positive control MCF-7 cells with that in MDA-MB-231 cells (Figure 10). As before, in quiescent MCF-7 cells, the doublet α- and β-bands of 4EBP1 were detected by Western analysis, with the lower molecular weight α-band representing hypo-phosphorylated 4EBP1 (Figure 10B, lane 1). We showed for the first time that in addition to PRL [24], the acute treatment of MCF-7 cells for 1 h with R1881 stimulated hyper-phosphorylation of 4EBP1 with the appearance of a higher molecular weight γ-band (Figure 10B, lane 2). The a, β, γ-bands were also detected in MCF-7 cells transfected with non-targeting siRNA (Figure 10B, lane 3) but following siRNA-knockdown of EDD, the γ-band disappeared (Figure 10B, lane 4). The intensities of these bands were analyzed by densitometry (Figure 10B, right panel). Phosphorylation of 4EBP1 releases eIF4E, which binds to the 5’-CAP of mRNAs to initiate translation [58]. Consistent with this, CAP-binding assays showed that levels of the released eIF4E increased in R1881-stimulated MCF-7 cells (Figure 10C, lanes 2 and 3) but decreased in siEDD-transfected cells (Figure 10C, lane 4). As expected, β-actin was not recovered from the CAP-binding assay.
Figure 10.

Loss of EDD decreases PRL/R1881-induced phosphorylation of 4EBP1 and 4E release. (A) siRNA knockdown of EDD was confirmed by RT-qPCR. Mean ± SEM (n=3 for each cell line). (B, C) Quiescent MCF-7 cells were transfected with siEDD, non-targeting siNT1 or left untransfected (Con) for 48 h, and then treated with R1881 (10 nM) for 1 h. In (B), cell lysates (input) were used for SDS-PAGE and Western analysis, followed by densitometry of the α-, β-, and γ-4EBP1 bands. In (C), CAP-binding assays were performed by incubating cell lysates with m7GTP agarose beads (see Materials and Methods). The beads were washed and the m7GTP eluate was used for SDS-PAGE and Western analysis of eIF4E, which was analyzed by densitometry. β-Actin was used as a control to confirm sufficient washing of the agarose affinity resin. (D-G) are identical experiments as in (B, C) but using quiescent MDA-MB-231 cells treated with (D, E) 10 ng/ml PRL or (F, G) 10 nM R1881. Immunoblots shown are representatives of at least three independent experiments.
In MDA-MB-231 cells, PRL also induced phosphorylation of 4EBP1 with the appearance of heavy α-, β- and γ-bands (Figure 10D, lanes 2 and 3) as compared to quiescent cells (Figure 10D, lane 1). Loss of EDD caused the disappearance of the γ-band (Figure 10D, lane 4), and reduced the release of eIF4E (Figure 10E, lane 4), as compared to PRL-treated control cells (lanes 2 and 3).
In MDA-MB-231 cells, the stimulatory effect of R1881 on 4EBP1 phosphorylation was again detected with the appearance of darker α-, β- and γ-bands (Figure 10F, lanes 2 and 3), as compared to quiescent cells (Figure 10F, lane 1). Loss of EDD decreased the intensities of these bands (Figure 10F, lane 4), and reduced the release of eIF4E (Figure 10G, lane 4), as compared to R1881-treated control cells (lanes 2 and 3).
Discussion
As described in the Introduction, we have identified two unrelated, novel PRL-responsive genes, encoding CPD and EDD, that are also upregulated by androgens. We showed that PRL/androgen-inducible CPD and EDD are associated with the pro-survival CPD-Arg-NO and EDD-TORC1 pathways in luminal-A breast cancer cells [18-24]. The PRL/androgen-inducible CPD-Arg-NO pathway is also active in prostate cancer cells [37,38,59]. The TNBC and HER2+ subtypes have limited treatment options and the present study investigated whether these aggressive BCa subtypes could respond to PRL and/or androgens for better cell survival. Indeed, our present study showed that both the CPD-Arg-NO and EDD-TORC1 pathways are also active and support the survival of TNBC and HER2+ tumor cells. Kaplan-Meier plot analyses revealed that high CPD or high EDD mRNA expression in TNBC patients correlated with a poorer relapse-free survival rate than low mRNA expression (Figure 1), providing impetus for further studies. Subsequent IHC analysis of tissues from 52 BCa patients revealed elevated immunostaining for CPD (Figure 4) and EDD (Figure 5) in high-grade TNBC and HER2+ specimens. The co-localization of CPD and nitrotyrosine immunostaining (Figure 4) support a role for CPD in NO production in these tumors. The present findings also expand on our previous reports that showed a progressive increase in CPD and EDD immunostainings from low levels in benign breast specimens to high levels in ductal carcinoma in situ, low-grade, and high-grade BCa [21,24].
In support of hormonal regulation of CPD and EDD within tumors, IHC analysis showed immunostaining of AR, PRLR or phospho-Stat5 in TNBC and HER2+ tumors. AR immunostaining was equally abundant in benign, high-grade, TNBC and HER2+ specimens (Figure 2). Phospho-Stat5 staining was abundant in benign and malignant breast tissues, but significantly higher in HER2+ tumors (Figure 3). Without the more sensitive anti-PRLR antibody H-300, phospho-Stat5 gave an indication of PRLR activity (Figure 3), which signals primarily through Jak2/Stat5 in mammary cells [60]. Similarly, others have reported that TNBC expresses the PRLR, albeit at a lower frequency (29%) than luminal-A (84%), luminal-B (78%), and HER2+ (68%) subtypes [17].
In contrast to our detection of PRLR and phospho-Stat5 in aggressive high-grade BCa, others using tissue microarrays (TMA) have shown that PRLR immunostaining, although detectable in normal breast tissues, was low or undetectable in BCa and, furthermore, the expression of PRL, PRLR, and Stat5 were favorable prognostic markers that correlated with better survival outcomes in BCa patients [45,56,57]. In comparing TMA and IHC analyses, we have noted that PRLR and phospho-Stat5 staining levels were highly variable within individual samples, and among samples. For this reason, examination of large ≥ 50 mm2 FFPE tissue samples in our study may yield different overall results from analysis of 1 mm2 tissue cores in TMAs. In addition, differences in embedding and fixation methods used in the two studies may affect staining results. It has been noted that even very low levels of PRLR expression were sufficient to mediate PRL responsiveness in BCa cell lines [61]. In vitro studies have consistently shown conflicting results regarding the impact of Stat5 on cell differentiation, survival and proliferation, that were attributed to cell-line-specificity [62]. For example, elevated Stat5 increased differentiation in T47D, MDA-MB-468 and BT-20 cells, and inhibited motility in T47D and MCF-7 cells but, on the other hand, increased survival of T47D, MCF-7 and SKBR3 cells, and increased tamoxifen resistance in T47D cells. It is not known how Stat5 activation differs in normal versus malignant mammary cells, and between different BCa cell types, to affect cellular differentiation, lineage specification, proliferation and survival of these mammary cell types [62]. Nonetheless, since CPD and EDD gene expressions are upregulated by androgens and PRL in vitro [18-21], the high CPD and EDD immunostaining within TNBC and HER2+ tumors that also express AR and PRLR/Stat5 (Figures 2, 3, 4 and 5) indicate that these two pro-survival genes can be activated by androgens and PRL in vivo.
The abundance of AR and PRLR in TNBC and HER2+ tumors in vivo compelled our further study of PRL/androgen-inducible CPD and EDD survival pathways in TNBC and HER2+ cell lines in vitro (Figures 6, 7, 8, 9 and 10). PRL or R1881 treatment for 3-6 h upregulated pro-survival CPD and EDD protein levels in TNBC (MDA-MB-231 and MDA-MB-468) and HER2-enriched (SKBR3) cell lines (Figure 6). PRL/androgen-inducible CPD promoted TNBC and SKBR3 cell survival via the CPD-Arg-NO pathway (Figures 7, 8 and 9) while PRL/androgen-inducible EDD activated the TORC1 pathway in TNBC cells (Figure 10).
In contrast to the current results, microarray analysis of a murine mammary epithelial stem-like cell line (HC11) showed that PRL treatment for 24 h modulated (either up or down) by ≥ 2-fold a total of 49 genes to give a gene signature that was significantly associated with a tumor differentiation program [63]. Furthermore, PRL was shown to exert anti-tumorigenic effects in HER2-overexpressing BCa cells [64]. Specifically, treatment of HER2+ cells, such as SKBR3, with PRL for 48-72 h decreased cell viability by 20%, induced cell cycle arrest, and reduced tumorsphere formation over 7 days. PRL also reduced gene expression of markers involved in stemness, tumor initiation, and drug resistance, and impeded tumor growth of HER-2 xenografts [64]. In our study, MDA-MB-231, MDA-MB-468 and SkBR3 cells were treated with PRL for a shorter duration (3-6 h vs 24-72 h) and were made quiescent in phenol-red free DMEM containing 1% charcoal-stripped FBS for 24 h to maximally reduce growth stimulation. In the other study [64], cells were incubated for 24 h in DMEM containing 2% complete FBS, possibly leading to different baselines for SKBR3 cell viability.
In TNBC and HER2-enriched cells, CPD-mediated NO production was abrogated by combined treatment with PRLR and AR antagonists (Figure 7), implicating the PRLR and AR signaling cascades in the activation of the CPD-Arg-NO pathway. Loss of CPD in MDA-MB-231 (Figure 8) and SKBR3 (Figure 9) cells significantly decreased cell viability and increased apoptosis (Figure 9). When TNBC cells in Arg-free medium were treated with NO donor DETA-NONOate (25 µM) and CPD substrate FAR, cell apoptosis decreased (Figure 8), showing a direct effect of NO and CPD-generated NO, respectively. We calculated DETA-NONOate at 25 µM to produce a moderate concentration of 155 nM NO to produce a moderate concentration of 155 nM NO [65]. This is consistent with NO, at low (<100 nM) and moderate (100-500 nM) concentrations, enhancing tumor progression by promoting angiogenesis, cell proliferation, invasiveness, metastasis and/or cytoprotection, and repressing apoptosis. At high concentrations (>500 nM), NO promotes DNA damage, oxidative stress, cytotoxicity and apoptosis [66].
PRL/androgen-inducible EDD is another pro-survival gene. Loss of EDD in MCF-7 cells increased protein levels of modulator of apoptosis protein 1 (MOAP-1), Bax and Bim, thereby triggering the intrinsic mitochondrial apoptotic cascade [24]. PRL also activates TORC1 signaling in MCF-7 cells, and loss of EDD decreased PRL-induced hyper-phosphorylation of 4EBP1, and 4EBP1’s release of 4E [24]. Our present study showed that PRL and R1881 also activated TORC1 signaling in TNBC MDA-MB-231 cells, with the rapid appearance of the hyper-phosphorylated γ-band of 4EBP1 within 1 h, and the increased release of 4E, but these effects were inhibited following the loss of EDD (Figure 10). EDD overexpression and gene amplification have been linked to platinum resistance in serous ovarian carcinoma [67], and EDD targeting, in combination with chemotherapy, could be beneficial for this cancer [68]. Likewise, we have shown that ectopic overexpression of EDD in a low-EDD expressing TNBC cell line, MDA-MB-436, promoted cell resistance to chemotherapeutic agents cisplatin and doxorubin, and to TORC1 inhibitor rapamycin and TORC1/TORC2 inhibitor INK128 [24], suggesting that EDD targeting may also be beneficial for the TNBC-subtype. Others have shown that TNBC LAR cells may benefit from treatment with AR antagonists [11,53,54]. PRLR blockade may also confer benefits to patients undergoing chemotherapy [69,70], and inhibition of TORC1 signaling prevents resistance to chemotherapeutic agents, by intercepting crosstalk between the ER and PRLR [71].
In summary, our study supports the CPD-Arg-NO pathway and EDD as therapeutic targets in BCa. Since CPD and EDD are PRL- and androgen-inducible genes, PRLR and AR blockade can be beneficial to patients with aggressive BCa, including the TNBC and HER2+-subtypes that express these receptors.
Acknowledgements
This study was funded by the Canadian Breast Cancer Foundation (CBCF)/Atlantic, the Canadian Cancer Society (to CKLT), and the Breast Cancer Society of Canada, QEII Foundation, and Beatrice Hunter Cancer Research Institute (BHCRI) (to CKLT and PJB). TM was a recipient of a Cancer Research Training Program traineeship supported by CBCF/Atlantic and Canadian Imperial Bank of Commerce through BHCRI. AG was a recipient of a BHCRI Summer Studentship. The authors acknowledge the infrastructure and expertise provided by the FACS facility within the CORES program at the Faculty of Medicine, Dalhousie University.
Disclosure of conflict of interest
None.
References
- 1.Carey LA, Perou CM, Livasy CA, Dressler LG, Cowan D, Conway K, Karaca G, Troester MA, Tse CK, Edmiston S, Deming SL, Geradts J, Cheang MC, Nielsen TO, Moorman PG, Earp HS, Millikan RC. Race, breast cancer subtypes, and survival in the Carolina breast cancer study. JAMA. 2006;295:2492–2502. doi: 10.1001/jama.295.21.2492. [DOI] [PubMed] [Google Scholar]
- 2.Yersal O, Barutca S. Biological subtypes of breast cancer: prognostic and therapeutic implications. World J Clin Oncol. 2014;5:412–424. doi: 10.5306/wjco.v5.i3.412. [DOI] [PMC free article] [PubMed] [Google Scholar]
- 3.Creighton CJ. The molecular profile of luminal B breast cancer. Biologics. 2012;6:289–297. doi: 10.2147/BTT.S29923. [DOI] [PMC free article] [PubMed] [Google Scholar]
- 4.Ellis MJ, Tao Y, Luo J, A’Hern R, Evans DB, Bhatnagar AS, Chaudri Ross HA, von Kameke A, Miller WR, Smith I, Eiermann W, Dowsett M. Outcome prediction for estrogen receptor-positive breast cancer based on postneoadjuvant endocrine therapy tumor characteristics. J Natl Cancer Inst. 2008;100:1380–1388. doi: 10.1093/jnci/djn309. [DOI] [PMC free article] [PubMed] [Google Scholar]
- 5.Rakha EA, Elsheikh SE, Aleskandarany MA, Habashi HO, Green AR, Powe DG, El-Sayed ME, Benhasouna A, Brunet JS, Akslen LA, Evans AJ, Blamey R, Reis-Filho JS, Foulkes WD, Ellis IO. Triple-negative breast cancer: distinguishing between basal and nonbasal subtypes. Clin Cancer Res. 2009;15:2302–2310. doi: 10.1158/1078-0432.CCR-08-2132. [DOI] [PubMed] [Google Scholar]
- 6.Sorlie T, Perou CM, Tibshirani R, Aas T, Geisler S, Johnsen H, Hastie T, Eisen MB, van de Rijn M, Jeffrey SS, Thorsen T, Quist H, Matese JC, Brown PO, Botstein D, Lonning PE, Borresen-Dale AL. Gene expression patterns of breast carcinomas distinguish tumor subclasses with clinical implications. Proc Natl Acad Sci U S A. 2001;98:10869–10874. doi: 10.1073/pnas.191367098. [DOI] [PMC free article] [PubMed] [Google Scholar]
- 7.Cancer Genome Atlas Network. Comprehensive molecular portraits of human breast tumours. Nature. 2012;490:61–70. doi: 10.1038/nature11412. [DOI] [PMC free article] [PubMed] [Google Scholar]
- 8.Perou CM, Sorlie T, Eisen MB, van de Rijn M, Jeffrey SS, Rees CA, Pollack JR, Ross DT, Johnsen H, Akslen LA, Fluge O, Pergamenschikov A, Williams C, Zhu SX, Lonning PE, Borresen-Dale AL, Brown PO, Botstein D. Molecular portraits of human breast tumours. Nature. 2000;406:747–752. doi: 10.1038/35021093. [DOI] [PubMed] [Google Scholar]
- 9.Herschkowitz JI, Simin K, Weigman VJ, Mikaelian I, Usary J, Hu Z, Rasmussen KE, Jones LP, Assefnia S, Chandrasekharan S, Backlund MG, Yin Y, Khramtsov AI, Bastein R, Quackenbush J, Glazer RI, Brown PH, Green JE, Kopelovich L, Furth PA, Palazzo JP, Olopade OI, Bernard PS, Churchill GA, Van Dyke T, Perou CM. Identification of conserved gene expression features between murine mammary carcinoma models and human breast tumors. Genome Biol. 2007;8:R76. doi: 10.1186/gb-2007-8-5-r76. [DOI] [PMC free article] [PubMed] [Google Scholar]
- 10.Heitz F, Harter P, Lueck HJ, Fissler-Eckhoff A, Lorenz-Salehi F, Scheil-Bertram S, Traut A, du Bois A. Triple-negative and HER2-overexpressing breast cancers exhibit an elevated risk and an earlier occurrence of cerebral metastases. Eur J Cancer. 2009;45:2792–2798. doi: 10.1016/j.ejca.2009.06.027. [DOI] [PubMed] [Google Scholar]
- 11.Lehmann BD, Bauer JA, Chen X, Sanders ME, Chakravarthy AB, Shyr Y, Pietenpol JA. Identification of human triple-negative breast cancer subtypes and preclinical models for selection of targeted therapies. J Clin Invest. 2011;121:2750–2767. doi: 10.1172/JCI45014. [DOI] [PMC free article] [PubMed] [Google Scholar]
- 12.Nounou MI, ElAmrawy F, Ahmed N, Abdelraouf K, Goda S, Syed-Sha-Qhattal H. Breast cancer: conventional diagnosis and treatment modalities and recent patents and technologies. Breast Cancer (Auckl) 2015;9:17–34. doi: 10.4137/BCBCR.S29420. [DOI] [PMC free article] [PubMed] [Google Scholar]
- 13.Wilson FR, Coombes ME, Brezden-Masley C, Yurchenko M, Wylie Q, Douma R, Varu A, Hutton B, Skidmore B, Cameron C. Herceptin(R) (trastuzumab) in HER2-positive early breast cancer: a systematic review and cumulative network meta-analysis. Syst Rev. 2018;7:191. doi: 10.1186/s13643-018-0854-y. [DOI] [PMC free article] [PubMed] [Google Scholar]
- 14.Gerratana L, Basile D, Buono G, De Placido S, Giuliano M, Minichillo S, Coinu A, Martorana F, De Santo I, Del Mastro L, De Laurentiis M, Puglisi F, Arpino G. Androgen receptor in triple negative breast cancer: a potential target for the targetless subtype. Cancer Treat Rev. 2018;68:102–110. doi: 10.1016/j.ctrv.2018.06.005. [DOI] [PubMed] [Google Scholar]
- 15.Sharma P. Update on the treatment of early-stage triple-negative breast cancer. Curr Treat Options Oncol. 2018;19:22. doi: 10.1007/s11864-018-0539-8. [DOI] [PubMed] [Google Scholar]
- 16.Salvi S, Bonafe M, Bravaccini S. Androgen receptor in breast cancer: a wolf in sheep’s clothing? A lesson from prostate cancer. Semin Cancer Biol. 2020;60:132–137. doi: 10.1016/j.semcancer.2019.04.002. [DOI] [PubMed] [Google Scholar]
- 17.Lopez-Ozuna VM, Hachim IY, Hachim MY, Lebrun JJ, Ali S. Prolactin pro-differentiation pathway in triple negative breast cancer: impact on prognosis and potential therapy. Sci Rep. 2016;6:30934. doi: 10.1038/srep30934. [DOI] [PMC free article] [PubMed] [Google Scholar]
- 18.Too CK, Vickaryous N, Boudreau RT, Sangster SM. Identification and nuclear localization of a novel prolactin and cytokine-responsive carboxypeptidase D. Endocrinology. 2001;142:1357–1367. doi: 10.1210/endo.142.3.8041. [DOI] [PubMed] [Google Scholar]
- 19.Abdelmagid SA, Too CKL. Prolactin and estrogen upregulate carboxypeptidase-D to promote nitric oxide production and survival of MCF-7 breast cancer cells. Endocinology. 2008;149:4821–4828. doi: 10.1210/en.2008-0145. [DOI] [PubMed] [Google Scholar]
- 20.Koirala S, Thomas LN, Too CK. Prolactin/Stat5 and androgen R1881 coactivate carboxypeptidase-D gene in breast cancer cells. Mol Endocrinol. 2014;28:331–343. doi: 10.1210/me.2013-1202. [DOI] [PMC free article] [PubMed] [Google Scholar]
- 21.Thomas LN, Chedrawe ER, Barnes PJ, Too CKL. Prolactin/androgen-inducible carboxypeptidase-D increases with nitrotyrosine and Ki67 for breast cancer progression in vivo, and upregulates progression markers VEGF-C and Runx2 in vitro. Breast Cancer Res Treat. 2017;164:27–40. doi: 10.1007/s10549-017-4223-7. [DOI] [PubMed] [Google Scholar]
- 22.McDonald WJ, Sangster SM, Moffat LD, Henderson MJ, Too CK. Alpha4 phosphoprotein interacts with EDD E3 ubiquitin ligase and poly(A)-binding protein. J Cell Biochem. 2010;110:1123–1129. doi: 10.1002/jcb.22624. [DOI] [PubMed] [Google Scholar]
- 23.McDonald WJ, Thomas LN, Koirala S, Too CKL. Progestin-inducible EDD E3 ubiquitin ligase binds to alpha4 phosphoprotein to regulate ubiquitination and degradation of protein phosphatase PP2Ac. Mol Cell Endocrinol. 2014;382:254–261. doi: 10.1016/j.mce.2013.09.033. [DOI] [PubMed] [Google Scholar]
- 24.MacDonald TM, Thomas LN, Daze E, Marignani P, Barnes PJ, Too CK. Prolactin-inducible EDD E3 ubiquitin ligase promotes TORC1 signalling, anti-apoptotic protein expression, and drug resistance in breast cancer cells. Am J Cancer Res. 2019;9:1484–1503. [PMC free article] [PubMed] [Google Scholar]
- 25.Skidgel RA, Erdos EG. Cellular carboxypeptidases. Immunol Rev. 1998;161:129–141. doi: 10.1111/j.1600-065x.1998.tb01577.x. [DOI] [PubMed] [Google Scholar]
- 26.Song L, Fricker LD. Purification and characterization of carboxypeptidase D, a novel carboxypeptidase E-like enzyme, from bovine pituitary. J Biol Chem. 1995;270:25007–25013. doi: 10.1074/jbc.270.42.25007. [DOI] [PubMed] [Google Scholar]
- 27.Callaghan MJ, Russell AJ, Woollatt E, Sutherland GR, Sutherland RL, Watts CK. Identification of a human HECT family protein with homology to the drosophila tumor suppressor gene hyperplastic discs. Oncogene. 1998;17:3479–3491. doi: 10.1038/sj.onc.1202249. [DOI] [PubMed] [Google Scholar]
- 28.Henderson MJ, Russell AJ, Hird S, Munoz M, Clancy JL, Lehrbach GM, Calanni ST, Jans DA, Sutherland RL, Watts CK. EDD, the human hyperplastic discs protein, has a role in progesterone receptor coactivation and potential involvement in DNA damage response. J Biol Chem. 2002;277:26468–26478. doi: 10.1074/jbc.M203527200. [DOI] [PubMed] [Google Scholar]
- 29.Mansfield E, Hersperger E, Biggs J, Shearn A. Genetic and molecular analysis of hyperplastic discs, a gene whose product is required for regulation of cell proliferation in drosophila melanogaster imaginal discs and germ cells. Dev Biol. 1994;165:507–526. doi: 10.1006/dbio.1994.1271. [DOI] [PubMed] [Google Scholar]
- 30.Clancy JL, Henderson MJ, Russell AJ, Anderson DW, Bova RJ, Campbell IG, Choong DY, Macdonald GA, Mann GJ, Nolan T, Brady G, Olopade OI, Woollatt E, Davies MJ, Segara D, Hacker NF, Henshall SM, Sutherland RL, Watts CK. EDD, the human orthologue of the hyperplastic discs tumour suppressor gene, is amplified and overexpressed in cancer. Oncogene. 2003;22:5070–5081. doi: 10.1038/sj.onc.1206775. [DOI] [PubMed] [Google Scholar]
- 31.Fuja TJ, Lin F, Osann KE, Bryant PJ. Somatic mutations and altered expression of the candidate tumor suppressors CSNK1 epsilon, DLG1, and EDD/hHYD in mammary ductal carcinoma. Cancer Res. 2004;64:942–951. doi: 10.1158/0008-5472.can-03-2100. [DOI] [PubMed] [Google Scholar]
- 32.Shearer RF, Iconomou M, Watts CK, Saunders DN. Functional roles of the E3 ubiquitin ligase UBR5 in cancer. Mol Cancer Res. 2015;13:1523–1532. doi: 10.1158/1541-7786.MCR-15-0383. [DOI] [PubMed] [Google Scholar]
- 33.Chen J, Peterson RT, Schreiber SL. Alpha 4 associates with protein phosphatases 2A, 4, and 6. Biochem Biophys Res Commun. 1998;247:827–832. doi: 10.1006/bbrc.1998.8792. [DOI] [PubMed] [Google Scholar]
- 34.Chen J. Novel regulatory mechanisms of mTOR signaling. Curr Top Microbiol Immunol. 2004;279:245–257. doi: 10.1007/978-3-642-18930-2_14. [DOI] [PubMed] [Google Scholar]
- 35.Schmelzle T, Hall MN. TOR, a central controller of cell growth. Cell. 2000;103:253–262. doi: 10.1016/s0092-8674(00)00117-3. [DOI] [PubMed] [Google Scholar]
- 36.Gingras AC, Raught B, Sonenberg N. mTOR signaling to translation. Curr Top Microbiol Immunol. 2004;279:169–197. doi: 10.1007/978-3-642-18930-2_11. [DOI] [PubMed] [Google Scholar]
- 37.Thomas LN, Merrimen J, Bell DG, Rendon R, Goffin V, Too CK. Carboxypeptidase-D is elevated in prostate cancer and its anti-apoptotic activity is abolished by combined androgen and prolactin receptor targeting. Prostate. 2014;74:732–742. doi: 10.1002/pros.22793. [DOI] [PubMed] [Google Scholar]
- 38.Thomas LN, Merrimen J, Bell DG, Rendon R, Too CK. Prolactin- and testosterone-induced carboxypeptidase-D correlates with increased nitrotyrosines and Ki67 in prostate cancer. Prostate. 2015;75:1726–1736. doi: 10.1002/pros.23054. [DOI] [PubMed] [Google Scholar]
- 39.Li Y, Clevenger CV, Minkovsky N, Kumar KG, Raghunath PN, Tomaszewski JE, Spiegelman VS, Fuchs SY. Stabilization of prolactin receptor in breast cancer cells. Oncogene. 2006;25:1896–1902. doi: 10.1038/sj.onc.1209214. [DOI] [PubMed] [Google Scholar]
- 40.Gregg C, Shikar V, Larsen P, Mak G, Chojnacki A, Yong VW, Weiss S. White matter plasticity and enhanced remyelination in the maternal CNS. J Neurosci. 2007;27:1812–1823. doi: 10.1523/JNEUROSCI.4441-06.2007. [DOI] [PMC free article] [PubMed] [Google Scholar]
- 41.Plotnikov A, Varghese B, Tran TH, Liu C, Rui H, Fuchs SY. Impaired turnover of prolactin receptor contributes to transformation of human breast cells. Cancer Res. 2009;69:3165–3172. doi: 10.1158/0008-5472.CAN-08-4033. [DOI] [PMC free article] [PubMed] [Google Scholar]
- 42.Goffin V, Bogorad RL, Touraine P. Identification of gain-of-function variants of the human prolactin receptor. Methods Enzymol. 2010;484:329–355. doi: 10.1016/B978-0-12-381298-8.00017-4. [DOI] [PubMed] [Google Scholar]
- 43.Halperin J, Dorfman VB, Fraunhoffer N, Vitullo AD. Estradiol, progesterone and prolactin modulate mammary gland morphogenesis in adult female plains vizcacha (lagostomus maximus) J Mol Histol. 2013;44:299–310. doi: 10.1007/s10735-012-9477-0. [DOI] [PubMed] [Google Scholar]
- 44.Hachim IY, Lopez-Ozuna VM, Hachim MY, Lebrun JJ, Ali S. Concomitant expression of prolactin receptor and tgfbeta receptors in breast cancer: association with less aggressive phenotype and favorable patient outcome. Int J Mol Sci. 2019;20 doi: 10.3390/ijms20071640. [DOI] [PMC free article] [PubMed] [Google Scholar]
- 45.Hachim IY, Hachim MY, Lopez VM, Lebrun JJ, Ali S. Prolactin receptor expression is an independent favorable prognostic marker in human breast cancer. Appl Immunohistochem Mol Morphol. 2016;24:238–245. doi: 10.1097/PAI.0000000000000178. [DOI] [PubMed] [Google Scholar]
- 46.O’Shaughnessy PJ, Monteiro A, Bhattacharya S, Fraser MJ, Fowler PA. Steroidogenic enzyme expression in the human fetal liver and potential role in the endocrinology of pregnancy. Mol Hum Reprod. 2013;19:177–187. doi: 10.1093/molehr/gas059. [DOI] [PubMed] [Google Scholar]
- 47.Silva MM Jr, Matheus WE, Garcia PV, Stopiglia RM, Billis A, Ferreira U, Favaro WJ. Characterization of reactive stroma in prostate cancer: involvement of growth factors, metalloproteinase matrix, sexual hormones receptors and prostatic stem cells. Int Braz J Urol. 2015;41:849–858. doi: 10.1590/S1677-5538.IBJU.2014.0355. [DOI] [PMC free article] [PubMed] [Google Scholar]
- 48.Huang R, Han J, Liang X, Sun S, Jiang Y, Xia B, Niu M, Li D, Zhang J, Wang S, Wei W, Liu Q, Zheng W, Zhang G, Song Y, Panga D. Androgen receptor expression and bicalutamide antagonize androgen receptor inhibit beta-catenin transcription complex in estrogen receptor-negative breast cancer. Cell Physiol Biochem. 2017;43:2212–2225. doi: 10.1159/000484300. [DOI] [PubMed] [Google Scholar]
- 49.Li H, Wang Z, Xiao W, Yan L, Guan W, Hu Z, Wu L, Huang Q, Wang J, Xu H, Zhang X, Ye Z. Androgen-receptor splice variant-7-positive prostate cancer: a novel molecular subtype with markedly worse androgen-deprivation therapy outcomes in newly diagnosed patients. Mod Pathol. 2018;31:198–208. doi: 10.1038/modpathol.2017.74. [DOI] [PubMed] [Google Scholar]
- 50.Li Q, Deng Q, Chao HP, Liu X, Lu Y, Lin K, Liu B, Tang GW, Zhang D, Tracz A, Jeter C, Rycaj K, Calhoun-Davis T, Huang J, Rubin MA, Beltran H, Shen J, Chatta G, Puzanov I, Mohler JL, Wang J, Zhao R, Kirk J, Chen X, Tang DG. Linking prostate cancer cell AR heterogeneity to distinct castration and enzalutamide responses. Nat Commun. 2018;9:3600. doi: 10.1038/s41467-018-06067-7. [DOI] [PMC free article] [PubMed] [Google Scholar]
- 51.Liang C, Wang S, Qin C, Bao M, Cheng G, Liu B, Shao P, Lv Q, Song N, Hua L, Gu M, Li J, Wang Z. TRIM36, a novel androgen-responsive gene, enhances anti-androgen efficacy against prostate cancer by inhibiting MAPK/ERK signaling pathways. Cell Death Dis. 2018;9:155. doi: 10.1038/s41419-017-0197-y. [DOI] [PMC free article] [PubMed] [Google Scholar]
- 52.Masuda H, Baggerly KA, Wang Y, Zhang Y, Gonzalez-Angulo AM, Meric-Bernstam F, Valero V, Lehmann BD, Pietenpol JA, Hortobagyi GN, Symmans WF, Ueno NT. Differential response to neoadjuvant chemotherapy among 7 triple-negative breast cancer molecular subtypes. Clin Cancer Res. 2013;19:5533–5540. doi: 10.1158/1078-0432.CCR-13-0799. [DOI] [PMC free article] [PubMed] [Google Scholar]
- 53.Gucalp A, Tolaney S, Isakoff SJ, Ingle JN, Liu MC, Carey LA, Blackwell K, Rugo H, Nabell L, Forero A, Stearns V, Doane AS, Danso M, Moynahan ME, Momen LF, Gonzalez JM, Akhtar A, Giri DD, Patil S, Feigin KN, Hudis CA, Traina TA Translational Breast Cancer Research Consortium (TBCRC 011) Phase II trial of bicalutamide in patients with androgen receptor-positive, estrogen receptor-negative metastatic breast cancer. Clin Cancer Res. 2013;19:5505–5512. doi: 10.1158/1078-0432.CCR-12-3327. [DOI] [PMC free article] [PubMed] [Google Scholar]
- 54.Traina TA, Miller K, Yardley DA, Eakle J, Schwartzberg LS, O’Shaughnessy J, Gradishar W, Schmid P, Winer E, Kelly C, Nanda R, Gucalp A, Awada A, Garcia-Estevez L, Trudeau ME, Steinberg J, Uppal H, Tudor IC, Peterson A, Cortes J. Enzalutamide for the treatment of androgen receptor-expressing triple-negative breast cancer. J. Clin. Oncol. 2018;36:884–890. doi: 10.1200/JCO.2016.71.3495. [DOI] [PMC free article] [PubMed] [Google Scholar]
- 55.Cotarla I, Ren S, Zhang Y, Gehan E, Singh B, Furth PA. Stat5a is tyrosine phosphorylated and nuclear localized in a high proportion of human breast cancers. Int J Cancer. 2004;108:665–671. doi: 10.1002/ijc.11619. [DOI] [PubMed] [Google Scholar]
- 56.Nevalainen MT, Xie J, Torhorst J, Bubendorf L, Haas P, Kononen J, Sauter G, Rui H. Signal transducer and activator of transcription-5 activation and breast cancer prognosis. J. Clin. Oncol. 2004;22:2053–2060. doi: 10.1200/JCO.2004.11.046. [DOI] [PubMed] [Google Scholar]
- 57.Peck AR, Witkiewicz AK, Liu C, Stringer GA, Klimowicz AC, Pequignot E, Freydin B, Tran TH, Yang N, Rosenberg AL, Hooke JA, Kovatich AJ, Nevalainen MT, Shriver CD, Hyslop T, Sauter G, Rimm DL, Magliocco AM, Rui H. Loss of nuclear localized and tyrosine phosphorylated Stat5 in breast cancer predicts poor clinical outcome and increased risk of antiestrogen therapy failure. J. Clin. Oncol. 2011;29:2448–2458. doi: 10.1200/JCO.2010.30.3552. [DOI] [PMC free article] [PubMed] [Google Scholar]
- 58.Aitken CE, Lorsch JR. A mechanistic overview of translation initiation in eukaryotes. Nat Struct Mol Biol. 2012;19:568–576. doi: 10.1038/nsmb.2303. [DOI] [PubMed] [Google Scholar]
- 59.Thomas LN, Morehouse TJ, Too CK. Testosterone and prolactin increase carboxypeptidase-D and nitric oxide levels to promote survival of prostate cancer cells. Prostate. 2012;72:450–460. doi: 10.1002/pros.21446. [DOI] [PubMed] [Google Scholar]
- 60.Goffin V. Prolactin receptor targeting in breast and prostate cancers: new insights into an old challenge. Pharmacol Ther. 2017;179:111–126. doi: 10.1016/j.pharmthera.2017.05.009. [DOI] [PubMed] [Google Scholar]
- 61.Galsgaard ED, Rasmussen BB, Folkesson CG, Rasmussen LM, Berchtold MW, Christensen L, Panina S. Re-evaluation of the prolactin receptor expression in human breast cancer. J Endocrinol. 2009;201:115–128. doi: 10.1677/JOE-08-0479. [DOI] [PubMed] [Google Scholar]
- 62.Furth PA, Nakles RE, Millman S, Diaz-Cruz ES, Cabrera MC. Signal transducer and activator of transcription 5 as a key signaling pathway in normal mammary gland developmental biology and breast cancer. Breast Cancer Res. 2011;13:220. doi: 10.1186/bcr2921. [DOI] [PMC free article] [PubMed] [Google Scholar]
- 63.Hachim IY, Shams A, Lebrun JJ, Ali S. A favorable role of prolactin in human breast cancer reveals novel pathway-based gene signatures indicative of tumor differentiation and favorable patient outcome. Hum Pathol. 2016;53:142–152. doi: 10.1016/j.humpath.2016.02.010. [DOI] [PubMed] [Google Scholar]
- 64.Hachim IY, Lopez-Ozuna VM, Hachim MY, Lebrun JJ, Ali S. Prolactin hormone exerts anti-tumorigenic effects in HER-2 overexpressing breast cancer cells through regulation of stemness. Stem Cell Res. 2019;40:101538. doi: 10.1016/j.scr.2019.101538. [DOI] [PubMed] [Google Scholar]
- 65.He W, Frost MC. Direct measurement of actual levels of nitric oxide (NO) in cell culture conditions using soluble NO donors. Redox Biol. 2016;9:1–14. doi: 10.1016/j.redox.2016.05.002. [DOI] [PMC free article] [PubMed] [Google Scholar]
- 66.Vahora H, Khan MA, Alalami U, Hussain A. The potential role of nitric oxide in halting cancer progression through chemoprevention. J Cancer Prev. 2016;21:1–12. doi: 10.15430/JCP.2016.21.1.1. [DOI] [PMC free article] [PubMed] [Google Scholar]
- 67.O’Brien PM, Davies MJ, Scurry JP, Smith AN, Barton CA, Henderson MJ, Saunders DN, Gloss BS, Patterson KI, Clancy JL, Heinzelmann-Schwarz VA, Murali R, Scolyer RA, Zeng Y, Williams ED, Scurr L, Defazio A, Quinn DI, Watts CK, Hacker NF, Henshall SM, Sutherland RL. The E3 ubiquitin ligase EDD is an adverse prognostic factor for serous epithelial ovarian cancer and modulates cisplatin resistance in vitro. Br J Cancer. 2008;98:1085–1093. doi: 10.1038/sj.bjc.6604281. [DOI] [PMC free article] [PubMed] [Google Scholar]
- 68.Bradley A, Zheng H, Ziebarth A, Sakati W, Branham-O’Connor M, Blumer JB, Liu Y, Kistner-Griffin E, Rodriguez-Aguayo C, Lopez-Berestein G, Sood AK, Landen CN Jr, Eblen ST. EDD enhances cell survival and cisplatin resistance and is a therapeutic target for epithelial ovarian cancer. Carcinogenesis. 2014;35:1100–1109. doi: 10.1093/carcin/bgt489. [DOI] [PMC free article] [PubMed] [Google Scholar]
- 69.LaPensee EW, Schwemberger SJ, LaPensee CR, Bahassi el M, Afton SE, Ben-Jonathan N. Prolactin confers resistance against cisplatin in breast cancer cells by activating glutathione-S-transferase. Carcinogenesis. 2009;30:1298–1304. doi: 10.1093/carcin/bgp120. [DOI] [PMC free article] [PubMed] [Google Scholar]
- 70.Ullah A, Ben-Jonathan N. Induction of cisplatin resistance by hormones in breast cancer. J Drug Des Res. 2017;4:1049–1052. [Google Scholar]
- 71.Marquette C, Nabell L. Chemotherapy-resistant metastatic breast cancer. Curr Treat Options Oncol. 2012;13:263–275. doi: 10.1007/s11864-012-0184-6. [DOI] [PubMed] [Google Scholar]