

Abstract
Low-density lipoprotein (LDL) binding to arterial proteoglycans initiates LDL retention and modification in the arterial wall, triggering atherosclerosis. The details of this binding, its effectors, and its ramifications are incompletely understood. We combined heparin affinity chromatography with biochemical, spectroscopic and electron microscopic techniques to show that brief binding to heparin initiates irreversible pro-atherogenic remodeling of human LDL. This involved decreased structural stability of LDL and increased susceptibility to hydrolysis, oxidation and fusion. Furthermore, phospholipid hydrolysis, mild oxidation and/or glycation of LDL in vitro increase the proteolytic susceptibility of apoB and its heparin binding affinity, perhaps by unmasking additional heparin-binding sites. For LDL from hyperglycemic type-2 diabetic patients, heparin binding was particularly destabilizing and caused apoB fragmentation and LDL fusion. However, for similar patients whose glycemic control was restored upon therapy, LDL-heparin binding affinity was rectified and LDL structural stability was partially restored. These results complement previous studies of LDL binding to arterial proteoglycans and suggest that LDL interactions with arterial proteoglycans may produce a particularly pro-atherogenic subclass of electronegative LDL. In summary, binding to heparin alters apoB conformation, perhaps by partially peeling it off the lipid, and triggers pro-atherogenic LDL modifications including hydrolysis, oxidation, and destabilization. Furthermore, phospholipid lipolysis, mild oxidation and glycation of LDL in vitro strengthen its binding to heparin, which helps explain stronger binding observed in hyperglycemic LDL. Combined effects of hyperglycemia and heparin binding are especially deleterious but are largely rectified upon diabetes therapy. These findings help establish a mechanistic link between diabetes and atherosclerosis.
Keywords: LDL hydrolysis, oxidation and glycation, apoB conformation, limited proteolysis, lipoprotein remodeling and fusion, glycemic control in diabetes and atherosclerosis
Graphical Abstract

1. Introduction
According to the response-to-retention hypothesis of atherosclerosis [1], LDL binding to arterial proteoglycans (PGs), including heparan sulfate (HS) PGs, initiates LDL retention in the arterial wall and triggers a cascade of pro-atherogenic responses. Binding to PGs prolongs LDL exposure to the oxidative and hydrolytic environment of the subendothelial matrix, leading to deleterious biochemical and structural changes in LDL. These changes induce LDL aggregation and fusion, enhance LDL uptake by arterial macrophages, promote inflammatory response, and culminate in the development of atherosclerotic lesions [1–5]. Furthermore, clinical and animal model studies report that shrinkage of atherosclerotic lesions upon therapeutic interventions results, in part, from decreased LDL retention in the arterial wall [6]. Therefore, factors influencing LDL retention, particularly the binding to arterial PGs, provide attractive targets for treating atherosclerosis [2, 7], necessitating a clear understanding of LDLPG interactions.
LDL-PG interactions have been extensively investigated for nearly four decades and much progress has been made in our understanding of their molecular basis; still, the details of these interactions are incompletely understood. These interactions are driven by Coulombic attraction of sulfates and carboxylates from HSPG (or its mimetics such as heparin) to lysine- and arginine-rich segments of the major LDL protein, apolipoprotein B (apoB) ([2, 3, 8] and references therein), as well as minor LDL proteins, apoE, apoJ and apoC-III [9–12]. ApoB is a large water-insoluble glycoprotein (4536 amino acids, 550 kDa) that comprises over 95% of the total LDL protein mass and is irreversibly associated with the host particle. Although several HSPG-binding residue segments in apoB have been identified [2–4, 8], the details of the interactions are missing, in part, because structural studies of apoB have been limited to low resolution. Moreover, molecular factors influencing LDL binding to PGs and the complex biochemical and structural ramifications of this binding are far from clear and are addressed in the current study.
Here we focus on how the LDL-heparin interactions are influenced by LDL modifications during diabetes. Cardiovascular disease, particularly premature atherosclerosis, is the major cause of mortality in type-1 and type-2 diabetes mellitus (DM1 and DM2) [13, 14]. Clinical, animal model and cell-based studies have firmly established a causal link between diabetes and an increased risk of atherosclerosis, and several underlying mechanisms have been proposed [14, 15]. Most of these mechanisms involve changes in LDL properties during diabetes, including increased glycation and oxidation of LDL, increased population of small dense triglyceride-rich LDL, decreased affinity for LDL receptor, and increased LDL uptake by arterial macrophages, all of which can potentially augment the development of atherosclerosis (reviewed in [2, 4, 14]). One of the most important mechanisms linking diabetes to premature atherosclerosis involves increased LDL retention by arterial HSPG, which may result from changes to both LDL and PG in diabetes [2, 4, 16]. Increased binding to arterial PG was observed in LDL from hyperglycemic patients with DM1 and DM2 [17, 18]. Moreover, the binding was restored to normal levels upon successful treatment of hyperglycemia [19]. The molecular origin of this effect was unclear and is explored in the current study.
Here, we employed affinity chromatography to isolate and characterize the heparin-bound fraction of LDL from healthy and from DM2 subjects, both treated and untreated, and to determine how LDL binding to heparin is influenced by post-translational LDL modifications in vitro including oxidation, glycation and hydrolysis, which are prevalent in diabetes. We also determined how LDL-heparin interactions influence LDL structure and biochemical remodeling. The results were compared with previous studies showing that LDL interactions with heparin induce irreversible structural changes in apoB and influence LDL oxidation, phospholipolysis, and fusion [20–24]. Taken together, these findings help establish the mechanistic link between LDL modifications in diabetes and arterial retention of LDL in atherosclerosis.
2. Materials and Methods
2.1. Materials
Human myeloperoxidase (MPO) was from Calbiochem (cat. #475911, lot #EC1.11.1.7, >95% purity by SDS-PAGE, the purity index A430/A280=0.75). Human recombinant secretory phospholipase A2 (sPLA2) group IIa was from Biovendor (#RD172054100). Other lipases, including sphingomyelinase (SMase) from Bacillus cereus (#S9396), lipoprotein lipase (LpL) from porcine pancreas (#L3126), and phospholipase C (PLC) from Bacillus cereus (#P6621), were from Sigma. Proteases including trypsin (#T1426), plasma-derived plasmin (#P1867), and catalytic domain of matrix metalloproteinase-12 (MMP-12) (#M9695), were from Sigma. For oxidized phospholipids, the primary antibody was murine monoclonal E06 (#330001, Avanti Polar Lipids), and the secondary was goat-anti-mouse HRP (#B-1115, Boston Bioproducts). For apoB, the primary antibody was rabbit polyclonal anti-apoB (#ab27626, Abcam), and the secondary was goat-anti-rabbit horseradish peroxidase-conjugated antibody (#B-1215, Boston Bioproducts). Other primary antibodies were anti-apoE (#AB947, Millipore), anti-apoJ (#sc-166907, Santa Cruz), anti-apoC-III (#sc-293227, Santa Cruz), and an antibody for the lipoprotein-associated PLA2 (LpPLA2), anti-LpPLA2 (#orb243886, Biorbyt). Sodium oleate (#O7501), glycose (#47829) and methylglyoxal (#M0252) were from Sigma. Phenylmethylsulfonyl fluoride (#93482) was from Sigma Aldrich. All chemicals were of highest purity analytical grade. Heparin sodium salt from porcine intestinal mucosa (#H4784), human apoC-III (# ALP60), human apoE (#ALP70), and human serum albumin (#SRP6182) were from Sigma.
2.2. LDL preparation and visualization
Single-donor human LDL were isolated from plasma of four anonymous healthy volunteers. The plasma was purchased from a blood bank Research Blood Components LLC (Boston, USA) in full compliance with the Institutional Review Board. LDL were isolated from fresh EDTA-containing plasma by KBr density gradient ultracentrifugation in the density range 1.019–1.063 g/mL as previously described [25]. LDL were dialyzed against buffer A (10 mM sodium phosphate, pH 7.4) containing 0.25 mM EDTA, degassed, and stored in the dark at 4 °C. Prior to each experiment, aliquots of the stock solutions were dialyzed against the EDTA-free buffer A. The stock solutions were used within two weeks, during which no protein degradation was detected by SDS PAGE and no changes in the LDL electrophoretic mobility were seen on the agarose gel.
To compare human LDL from healthy and diabetic subjects, three different batches of pooled plasma were used. Each batch contained plasma from 20 healthy normolipemic and normoglycemic volunteers (Nl, mean value of the hemoglobin A1c (HbA1c) of 5.2±0.2 %) and from 20 patients who have been diagnosed with DM2 and presented a poorly controlled (Pc) glycemic index (HbA1c≥7.5%, mean HbA1c value 11.4±1.7 %). These patients were subjected to hypoglycemic treatment including diet, exercise, metformin and insulin depending on the clinical presentation; the treatment improved the patients’ glycemic control (HbA1c<7% and/or a decrease by at least 1.5% below the baseline value, termed good glycemic control (Gc, mean HbA1c value 6.4±0.8 %).Plasma was obtained at the Hospital de Sant Pau (Barcelona, Spain) with written informed consent by the patients and upon approval by the institutional ethics committee. The plasma was pooled for Nl, Pc and Gc patients and LDL were isolated by sequential density ultracentrifugation. Biochemical composition of these LDL was determined as previously described [25] and the results are shown in Table S1 of the on-line supplement.
LDL were visualized by transmission electron microscopy with a CM12 transmission electron microscope (Philips Electron Optics, the Netherlands). Briefly, a 4 μL LDL aliquot in buffer A was incubated for 1 min on a carbon, formvar-coated 300 mesh grid (#FCF300-CU-TB, Electron Microscopy Sciences). After blotting excess fluid, the grids were washed thrice with buffer A, negatively stained with 1% uranyl acetate, blotted, and air-dried. Images were recorded with a 50,000x magnification on a 2Kx2K CCD camera (24 microns/pixel) and processed in Adobe Photoshop.
2.3. Protein and lipid quantification
Protein concentration was determined using a modified Lowry assay with bovine serum albumin as a standard. Cholesterol, TG, and phospholipids were quantified using enzymatic assays as previously described [25]. Non-esterified fatty acids (NEFA) were measured using an enzymatic colorimetric assay (Enzymchrom™ free fatty acid kit, #EFFA-100, Fisher Scientific). All concentrations were measured in technical triplicates.
To quantify free ε-amino groups, which decrease upon lysine glycation, the trinitrobenzenesulfonic acid assay was used. LDL (200 μl of 0.5 mg/ml protein) was mixed with 200 μl of 4% NaHCO3 (pH 8.4) and 200 μl of 0.1% trinitrobenzenesulfonic acid. The mixture was incubated in the dark for 2 h at 37 °C, whereupon optical density was measured at 340 nm.
2.4. Liquid chromatography, gel electrophoresis, and immunoblotting
Liquid chromatography was performed at 22 °C using an ÄKTA UPC 10 FPLC system (GE Healthcare). For size-exclusion chromatography (SEC), a Superose 6 10/300 GL column was used. LDL was eluted by buffer A at a flow rate of 0.5 ml/min. Anion exchange chromatography was performed using Mono Q 5/5 column (GE Life Sciences); LDL samples were dialyzed against 10 mM Tris, 1 mM EDTA, pH 7.4, and were eluted with a stepwise salt gradient of 0.0–1.0 M NaCl as previously described [26].
For heparin affinity chromatography, HiTrap-HP column (#17040601, GE Life Sciences) was used. Prior to each experiment, the column (1 ml volume) was washed with 10 column volumes of buffer A, and was equilibrated with 5 volumes of buffer A. LDL solution (0.5–0.8 mg protein) was filtered with a 0.2 micron filter, loaded onto the column and allowed to interact with heparin for 10 min. The flow-through fraction was eluted with 3 column volumes of buffer A, and the bound fraction was eluted with 3 volumes of buffer B (10 mM sodium phosphate buffer, 1.0 M NaCl, pH 7.4). The eluted LDL fractions were dialyzed again buffer A and used for further studies that were completed within 40 hours to avoid hydrolytic and oxidative LDL modifications, which were accelerated by heparin binding.
In addition to native LDL (i.e. pre-HiTrap heparin Sepharose sample), several controls were used in these experiments. One control included LDL eluted using Blue Sepharose Hi-trap column (GE Healthcare, #17041201). In this column, Cibarcon Blue 3G-A, which has high affinity for albumin but does not bind LDL, is immobilized on the Sepharose, the material identical to that used in the heparin Hi-trap column. For Hi-trap Blue HP column chromatography, the samples containing either LDL or human serum albumin were dialyzed against the binding buffer (20 mM sodium phosphate, pH 7). The samples containing 0.5 mg/ml protein were then filtered and loaded onto the column. Fractions that did not bind (LDL) were washed with 10 column volumes of the binding buffer; fractions that bound (albumin) were eluted with the elution buffer (20 mM sodium phosphate, 2 M NaCl, pH 7.0) using linear gradient. LDL fractions were collected, dialyzed against buffer A, and used for further studies.
The second control included LDL pre-incubated in a high-salt solution to mimic the conditions under which bound LDL was eluted in the heparin affinity chromatography. LDL (0.5 mg/ml protein) was incubated in in buffer A containing 0.5 M NaCl at 37 °C for 6 h, followed by extensive dialysis against buffer A to return to low salt. LDL was stored at 4 °C and used within 40 hours of incubation. The third control included LDL in solution containing heparin sodium salt (Sigma-Aldrich, #H3393). The stock solution of heparin salt (5 mg/ml) in distilled water was filter-sterilized before use. LDL (0.5 mg/ml protein) was incubated with heparin salt (0.5 mg/ml) in buffer A at 37 °C for 3 to 6 h. These controls were analyzed within 40 hours for the particle size, charge, structural and biochemical integrity, and stability to thermal and biochemical modifications.
For agarose gel electrophoresis, LDL samples (4 μg protein per lane) were loaded on the 0.5% agarose gel that was run in barbital ‑ sodium barbital buffer at 100 V for 1 h. For non-denaturing PAGE (NDGE), 4–20% Novex™ or 4% Tris-glycine gels (from Invitrogen) were loaded with 6 μg protein per lane and run to termination at 1,500 V-h under non-denaturing conditions in Tris-glycine buffer. For SDS PAGE, the gels were loaded with 5 μg protein per lane and run at 200 V for 1 h under denaturing conditions in SDS-Tris-glycine buffer. The gels were stained with InstantBlue stain (Fisher Scientific).
For Western blotting, 6 μl of LDL (0.5–1 mg/ml protein in buffer A) was loaded on an SDS gel and run at 200 V for 1 h. The gel was transferred to polyvinylidene fluoride membrane for 90 min at 100 V. Proteins were probed with antibodies for apoJ, apoE, apoC-III, and LpPLA2. In all experiments, apoB was used as a control for the quantity of the protein load. For dot blot analysis, 5 μl of LDL (0.5 mg/ml protein in buffer A) was spotted on a nitrocellulose membrane (#09-301-109, Fisher) and dried overnight at 24 °C. To ensure the LDL load, the membrane was sliced into two parts; one part was probed for oxidized phospholipids and the other for apoB. The membranes were rinsed with distilled water and blocked in 5% w/v nonfat dry milk in Tween-20 (#IBB-181, Boston Bioproducts) for 1 h at 24 °C. Next, the membranes were incubated at 4 °C overnight with the primary antibodies, either E06 or anti-apoB, which were diluted 1:1000 in 5% nonfat dry milk in TBS with TWEEN-20. The blots were washed thrice in TBS with TWEEN-20 and then incubated at 24 °C for 1 h with secondary antibodies, which were diluted 1:5000 in TBS with TWEEN-20. The membranes were washed thrice with Tween-20. The signal was developed with Thermo Scientific™ SuperSignal™ West Femto Chemiluminescent Substrate (#PI34095, Fisher). Images were collected with KwikQuant imager. Exposures from 1 s to 4 min were used; the 30 s exposure was used in all figures.
To test the effects of the exogenous exchangeable apolipoproteins on LDL binding to heparin, LDL (0.5 mg/ml protein) was incubated with 0.5 mg/ml of either apoE or apoC-III in buffer A at 37 °C for 12 h. Excess unbound protein was removed by SEC. Apolipoprotein-enriched LDL fractions were collected, pooled and used for analysis by heparin affinity chromatography. The enrichment of these LDL in apoE or apoC-III was confirmed by immunoblotting of the native gels.
2.5. LDL structure and stability monitored by spectroscopy
LDL structure, stability and remodeling were characterized by absorption/turbidity, circular dichroism (CD), and fluorescence spectroscopy using an experimental approach developed in our previous studies [25, 27]. LDL solutions (~0.1 mg/ml protein in buffer A) were used. ORIGIN software was used for data processing and display.
UV/vis absorption spectra at 25 °C were recorded at 250–450 nm using Varian-3500 spectrophotometer (Agilent). To compare thermal stability of LDL, melting data were continuously recorded at 280 nm by turbidity (absorbance, Abs280), during sample heating from 10 to 95 °C at a constant rate of 1 °C/min with 10 s accumulation time. This enabled us to monitor changes in the particle size resulting from the LDL remodeling upon heating. Previously we showed that such a remodeling involves lipoprotein aggregation and fusion followed by rupture and release of core lipids that coalesce into droplets and their aggregates [28]. These transitions cause an initial increase in turbidity due to increased particle size upon LDL aggregation, fusion, rupture and coalescence; this is followed by a drop in turbidity upon phase separation in aqueous suspensions of denatured LDL.
CD data were recorded using an AVIV-400 spectropolarimeter. To characterize protein secondary structure, far-UV CD spectra were recorded at 190–250 nm, 25 °C, as previously described [25, 27]. The spectra were normalized to the protein concentration and reported either in arbitrary units or as a molar residue ellipticity, [Θ].
Fluorescence was recorded at 25 °C using Varian Cary Eclipse spectrofluorimeter. Intrinsic Trp fluorescence spectra were recorded at 305–400 nm with λex=295 nm and 5 nm excitation and emission bandwidths. The emission of advanced glycation end-products (AGEs) was monitored at 450 nm with λex=350 nm.
2.6. Biochemical and mechanical remodeling of LDL
Limited proteolysis of LDL was carried out using trypsin, plasmin, or MMP-12. LDL (0.5 mg/ml protein) was incubated either for 1 h with trypsin (200:1 substrate:enzyme wt/wt), or for 3 h with plasmin (40 mU/ml) or MMP-12 (10 U/ml) at 37 °C. The reaction was stopped using 1 mM phenylmethylsulfonyl fluoride (for plasmin and trypsin) or 50 mM EDTA (for MMP-12).
For limited lipolysis of specific lipids under conditions that cause no detectable lipoprotein aggregation, LDL was incubated for 1 h at 37 °C in buffer C (150 mM NaCl, 2 mM CaCl2, 20 mM Tris HCl, pH 7.0) containing one of the following: 10 μg/ml sPLA2-IIa, 40 μg/ml SMase, 25 U/ml LpL, or 500 mU/ml PLC; the buffer for the SMase reaction also contained 2 mM MgCl2 and 50 mkM ZnCl2. The lipolysis was stopped by adding EDTA to a final concentration of 10 mM, whereupon LDL was re-isolated by SEC and used for heparin affinity chromatography on the same day. The degree of sPLA2 and LpL-induced lipolysis was determined by measuring the amounts of NEFA. The degree of SMase-induced lipolysis was determined by measuring the amounts of phosphocholine using an Amplex Red sphingomyelinase assay kit (#A12220, Thermo Fisher Scientific). The degree of PLC-induced lipolysis was monitored by measuring the loss of phospholipids using an EnzyChrom phospholipid assay kit (#EPLP-100, Fisher Scientific). Lipids hydrolyzed in these experiments amounted to 20–25% of their initial levels in intact LDL. After 1 h of lipolysis under these conditions, no significant LDL aggregation was detected by turbidity (Abs450) or SEC, and no changes in the LDL size and morphology were detected by electron microscopy [25].
In other experiments to compare susceptibility of various LDL to lipolysis, the enzyme (70 μg/ml SMase or 850 mU/ml PLC) was added to LDL (0.1 mg/ml protein) in 150 mM NaCl, 2 mM CaCl2, 20 mM Tris HCl, pH 7.0 at 37 °C. Lipolysis under these conditions caused progressive LDL aggregation over time [29, 30], which was monitored by turbidity (Abs450).
LDL oxidation by Cu2+ was carried out at 37 °C as previously described [31]. LDL solutions containing 0.1 mg/ml protein were equilibrated at 37 °C; the oxidation was initiated by 5 μM CuSO4. The reaction time course was monitored by UV absorbance at 234 nm of conjugated dienes, using Agilent Cary 3500 UV-Vis absorption spectrometer with multicell Peltier element (Agilent Technologies, Australia). LDL oxidation with MPO/H2O2/NaCl was performed at 37 °C as described previously [31].
To enrich LDL with oleic acid, LDL (1 mg/ml protein) was incubated with a freshly prepared solution of 5 mM sodium oleate in buffer A at 37 °C for 12 h. Excess unbound oleate was removed by extensive dialysis. The final amount of oleic acid in LDL, which was quantified by an enzymatic assay, showed a 20% increase in NEFA compared to control LDL.
For glycation, LDL in buffer A and the freshly prepared stock solutions of either glycose or methylglyoxal were sterilized using 0.45 μM filters. For glycation under non-oxidative conditions, LDL (0.5 mg/ml protein) was incubated with 100 mM glucose in buffer A containing 1 mM EDTA and 100 μM butylated hydroxyl toluene. LDL incubated without glucose was used as a control. The sample was flushed with nitrogen and the tube was capped with an air-tight cap to prevent oxidation. The sample was incubated at 37 °C for 14 days, whereupon the unbound glucose was removed by extensive dialysis against buffer A. Glycation under oxidative onditions was carried out using methylglyoxal. LDL (0.5 mg/ml protein) was incubated with 25 mM methylglyoxal in buffer A at 37 °C for up to one week, followed by extensive dialysis against buffer A.
Mechanical perturbation of LDL particles without biochemical changes was induced by vortexing in buffer A for 30 s at 22 °C. Vortexed LDL was analyzed on the same day.
2.7. Reproducibility
All experiments were repeated three or more times to ensure reproducibility. Most studies of normolipidemic single-donor LDL were performed in technical triplicates of biological triplicates using four different batches. Studies of pooled lipoproteins from plasma of normolipidemic and diabetic patients were performed in technical triplicates using three different LDL batches. All batches showed similar trends; the data for batch 1 are presented. Statistical analysis was performed using ANOVA t-test.
3. RESULTS
3.1. Heparin binding causes irreversible structural changes in LDL
Single-donor LDL from normolipidemic plasma were analyzed by heparin affinity chromatography as described in Methods part 2.4. Heparin affinity profiles showed two peaks, one eluted by the low-salt buffer A (flow-through) and another at 10–30% NaCl (Figure 1). The latter fraction, henceforth termed “bound”, comprised 85–90% of the total LDL. Bound LDL was collected and immediately used for biophysical and biochemical studies; low amount of the flow-through fraction precluded its analysis. All data of bound LDL were recorded during the first 40 hours after separation by the heparin affinity chromatography. During this time, the protein and lipoprotein structural integrity remained invariant and no changes in the LDL susceptibility to biochemical and physical perturbations were detected.
Figure 1.

Heparin affinity profile of normolipidemic LDL. Single-donor LDL in buffer A were loaded onto the HiTrap heparin-sepharose column and were eluted with a high-salt buffer as described in part 2 Methods. Dotted line shows NaCl concentration (100% = 1 M NaCl). “Bound” denotes the peak corresponding to LDL that bound heparin.
The structural integrity, size and morphology of lipoproteins were characterized by SEC, gel electrophoresis and electron microscopy (Figure 2). SEC profile of intact LDL showed a major peak centered at 12 ml. Bound LDL showed an additional contiguous population of larger particles or their aggregates with a peak circa 7.5 ml (Figure 2A). NDGE also showed an additional band corresponding to larger particles or their aggregates (Figure 2B). Electron micrographs of intact and bound LDL showed a relatively homogeneous population of particles with diameters of 22–24 nm typical of intact LDL (Figure 2C). Larger particles were not detected by electron microscopy although their presence could not be excluded. Together, the results suggest that bound LDL is more prone to spontaneous aggregation than intact LDL. This is consistent with previous studies by other methods showing that LDL became more prone to aggregation after binding to and release from PG in solution [32].
Figure 2.

Biochemical analysis of LDL before and after fractionation by heparin affinity chromatography. Fraction of bound LDL (gray) was isolated from normolipidemic single-donor intact LDL (black) as shown in Figure 1. Spectroscopic analysis of intact and bound LDL is shown in supplemental Figure S1.
(A) SEC profiles (superpose 6 10/300 GL column) of bound LDL and native LDL.
(B) Non-denaturing gel electrophoresis (NDGE, 4–20%) of intact LDL and bound LDL. Instant Blue protein stain was used for all gels.
(C) Electron micrographs of negatively stained bound LDL and intact LDL.
(D) SDS PAGE of intact LDL and bound LDL.
(E) Agarose gel electrophoresis of intact and of bound LDL. Human plasma HDL form the same donor are shown for comparison.
(F) NEFA levels in intact and in bound LDL quantified by a colorimetic assay. Mean values of biological and technical triplicates ±STD are shown; * indicates a moderate statistical difference as compared to intact LDL (p<0.5 by ANOVA t-test).
(G) Dot blot using an E06 antibody to probe for phospholipid oxidation in intact and in bound LDL. An anti-apoB antibody was used as a control to verify LDL binding to the membrane.
(H) Anion exchange chromatography profiles of intact and bound LDL.
Next we tested whether the PG-induced LDL aggregation was accompanied by biochemical changes in LDL. SDS PAGE revealed partial fragmentation of apoB as well as some protein aggregation in bound LDL (Figure 2D). Agarose gel showed a small but significant increase in the net negative charge of bound LDL (Figure 2E). Bound LDL also showed a marginal increase in NEFA (Figure 2F). Dot blot analysis detected oxidized phospholipids in bound but not in intact LDL (Figure 2F). Table S2 lists other biochemical components of bound vis-à-vis intact LDL. Finally, anion exchange chromatography showed an increased population of more electronegative particles in bound vis-à-vis intact LDL (Figure 2H). Taken together, these results show that binding to heparin causes rapid biochemical changes in LDL, including partial fragmentation and aggregation of apoB as well as hydrolysis and oxidation of phospholipids. The resulting properties, including increase in the net negative charge of LDL as well as oxidation and aggregation, resemble those of LDL(−), an especially pro-atherogenic population of electronegative LDL present in circulation [33, 34].
To explore whether heparin binding involves conformational changes in apoB, we used circular dichroism, absorption and fluorescence spectroscopy. Bound LDL showed changes in the spectral amplitude and/or increased noise due to light scattering (supplemental Figure S1), which was consistent with increased aggregation of bound LDL observed by SEC and NDGE (Figure 2A, B). Our spectroscopic data provided no direct evidence for the overall conformational changes in apoB, such as the secondary structural unfolding or altered tryptophan environment. This was not surprising since the large size of apoB and its strong association with lipid can hinder such conformational changes [27, 28]. As an alternative approach, limited proteolysis was performed using two plasma proteases, plasmin and MMP-12. Under conditions of our experiments apoB was not proteolyzed in intact LDL, but was rapidly degraded by both proteases in bound LDL (Figure 3). Therefore, binding to heparin makes apoB more susceptible to cleavage at Lys and Arg-containing sites (preferred by plasmin) as well as at aliphatic, aromatic or Pro residues (preferred by MMP-12), suggesting increased solvent accessibility of charged/polar as well as hydrophobic regions in apoB. This is consistent with previous studies showing that LDL released from complexes with arterial PG or other glycosaminoglycans becomes more susceptible to tryptic digestion, indicating increased accessibility of charged/polar regions [21].
Figure 3.

LDL binding to heparin increases proteolytic susceptibility of apoB. Intact LDL (black) and bound LDL (gray), which were isolated by heparin affinity chromatography as described in Figure 1, were subjected to limited proteolysis by either MMP-12 or plasmin (indicated) followed by SDS PAGE (10–20% gradient, Instant Blue protein stain) as described in Methods part 2.6. Intact LDL prior to proteolysis are shown for comparison. Molecular weight standards (St) are indicated.
To determine whether heparin binding increases LDL susceptibility to other types of structural and biochemical remodeling, absorption spectroscopy was used in several studies. First, we explored thermal remodeling, which leads to irreversible lipoprotein aggregation, fusion and disintegration [27, 35]. These processes were monitored by turbidity as outlined in Methods part 2.5. Compared to intact LDL, thermal remodeling of bound LDL shifted to lower temperatures by ~10 °C indicating reduced structural stability (Figure 4A).
Figure 4.

Binding to heparin increases LDL susceptibility to thermal, oxidative and lipolytic remodeling. Bound LDL (gray) was isolated from intact LDL (black) as shown in Figure 1.
(A) Thermal denaturation of LDL monitored by turbidity (absorbance) at 280 nm. The samples were heated at a rate of 1 °C/min. A steep increase in turbidity (observed above 80 °C for intact LDL and above 70 °C for bound LDL) reflects LDL fusion, rupture and coalescence into droplets; sharp drop in turbidity at higher temperatures reflects phase separation in fully denatured LDL (see Methods part 2.5 for details).
(B) The time course of copper-induced LDL oxidation monitored continuously by absorbance at 234 nm for conjugated diene formation. In intact LDL, three oxidation phases are marked (I – lag, II – propagation, III - saturation); the lag phase is indicated by a double arrow.
(C, D) LDL lipolysis by sphingomyelinase (SMase) or by phospholipase C (PLC). The reaction time course was monitored continuously by turbidity (absorbance) at 450 nm for aggregation of hydrolyzed LDL.
Second, we explored the time course of LDL oxidation by copper. Bound LDL showed faster oxidation than intact LDL: the oxidation lag phase, during which the antioxidants such as vitamin E are consumed [36], was clearly seen in intact LDL but was abolished in bound LDL (Figure 4B). Bound LDL also showed a greater initial absorbance at 234 nm, suggesting increased basal levels of free radicals and/or increased LDL aggregation. Consumption of antioxidants and generation of free radicals in bound LDL was consistent with the observation of oxidized phospholipids in bound but not in intact LDL (Figure 2F). Third, we explored the time course of lipolytic LDL remodeling by SMase and PLC. The remodeling by both lipases was accelerated in bound LDL that showed larger changes in turbidity (i.e. more extensive aggregation upon lipolysis) as compared to intact LDL (Figure 4C, D).
Compared to native LDL, controls (which include LDL eluted via the Blue Hi-trap Sepharose column without binding, LDL that were incubated with 0.5 M NaCl followed by dialysis against buffer A, and LDL in solution containing 0.5 mg/ml heparin sodium salt) showed no changes in the protein integrity, no changes in the particle size distribution, no increased aggregation, and no changes in the net charge or in the NEFA content (Figures S2, S3). Also, the first two LDL controls showed no changes in the structural or biochemical stability (Figures S2, S3), indicating that elution via the Sepharose column or previous exposure to high salt cause no irreversible changes in LDL. However, LDL in heparin salt solution showed a decrease in the ordered secondary structure of apoB, a small decrease in the thermal stability, and increased susceptibility to tryptic digestion and oxidation (Figure S3G–J). Therefore, LDL interactions with the heparin salt in solution are destabilizing, at least at the high salt concentration used in these experiments; this probably results from the direct destabilizing effect of heparin on LDL reported previously [20–24] perhaps compounded by the non-specific destabilizing effect of salt [27]. Together, our studies show that irreversible structural changes observed in bound LDL result from specific LDL-heparin interactions.
Together, the results in Figures 3 and 4 clearly show that LDL undergoes irreversible changes upon binding to heparin, leading to reduced structural stability of LDL, increased solvent accessibility of charged/polar and hydrophobic regions in apoB, and greater susceptibility to a wide range of perturbations, including thermal, oxidative and hydrolytic remodeling by proteases (MMP-12, plasmin) and lipases (SMase, PLC). This is consistent with previous studies showing that, upon binding to arterial PGs, LDL becomes less stable and more susceptible to biochemical (proteolysis, lipolysis, oxidation) and structural remodeling [2, 20, 21].
3.2. Effects of LDL aggregation and fusion on binding to heparin
In the next series of studies described in parts 3.2–3.6 below, we tested how LDL-heparin binding is affected by structural, hydrolytic, glycosylative and oxidative modifications of LDL, as well as by minor LDL proteins, apoE and apC-III. Such modifications occur in vivo, especially in diseases such as diabetes; they are complex, interrelated and can influence functional and atherogenic properties of LDL ([4, 14, 18] and references therein). The aim of our in vitro studies was to dissect, one by one, how each selected modification of LDL affects its binding to heparin.
First we tested whether aggregation and fusion of LDL, which importantly contribute to its pro-atherogenic potential [4, 30, 32, 35, 38, 39], influence heparin binding. LDL was vortexed for 30 sec at 22 °C. Under these conditions, no hydrolysis of LDL proteins or lipids was detected by SDS PAGE and agarose gel electrophoresis, respectively (Figure S4A, B). Electron micrographs showed LDL remodeling into larger and smaller particles upon brief vortexing (Figure S4C), while SEC revealed a continuous increase in the particle size in a significant population of LDL, reflecting aggregation and fusion (Figure S4D). Aggregated and intact-size LDL were isolated by SEC and analyzed by CD spectroscopy and heparin affinity chromatography (fractions 1 and 2, Figure S4D–F). Aggregated LDL showed partial loss of ordered secondary structure in apoB (Figure S4E) and a large increase in the heparin binding affinity evident from a large shift in the peak position of bound LDL towards high salt (Figure S4F). These results are consistent with previous reports linking aggregation of LDL to its increased affinity for PG [29]. Moreover, our results show that even in the absence of detectable biochemical changes in LDL, structural changes involving particle remodeling/fusion and partial unfolding of apoB are sufficient to greatly increase LDL affinity for heparin.
3.3. Effects of LDL hydrolysis on heparin binding
Next, LDL were hydrolyzed by lipases that modify plasma lipoproteins in vivo, particularly in the arterial wall. SMase hydrolyzes sphingomyelin in the lipoprotein surface to generate ceramide and phosphocholine, sPLA2 hydrolyzes phosphatidylcholines in the lipoprotein surface to generate lysophosphatidylcholine and NEFA, and LpL hydrolyzes triacylglycerol in the lipoprotein core to generate diand mono-acylglycerol and NEFA. Mild lipolysis by these enzymes, one at a time, was performed as described in Methods part 2.6 under conditions that caused no significant LDL aggregation or fusion, as evidenced by turbidity and SEC (Figure S5). The heparin affinity profiles revealed lipase-specific changes in the mildly hydrolyzed LDL. In SMase-treated LDL, in addition to a peak centered circa 30% NaCl and partially overlapping the peak of intact LDL, another major peak was observed in higher salt (~50% NaCl), indicating increased affinity for heparin of a large population of bound LDL (Figure 5A). LDL hydrolyzed by sPLA2 showed a large peak shift of the bound fraction towards higher salt, indicating increased affinity of this fraction for heparin; this was accompanied by an increase in the flow-through fraction containing LDL that did not bind heparin (Figure 5B). In contrast, in LpL-hydrolyzed LDL, the bound fraction showed only a small peak shift, indicating a minimal increase in the heparin affinity, along with a small increase in the flow-through fraction (Figure 5C). Together, the results in Figure 5A–C revealed that mild hydrolysis of surface phospholipids by either SMase or sPLA2 increases the affinity of bound LDL for heparin while mild hydrolysis of core triglycerides by LpL has a much smaller effect on the LDL-heparin interactions under conditions of our experiments.
Figure 5.

Mild lipolysis of surface and core phospholipids differentially affects LDL binding to heparin and the apoB conformation. Normolipidemic single-donor LDL were mildly hydrolyzed by SMase, sPLA2-IIa, or LpL as described in Methods part 2.6. LDL were subjected to mild hydrolysis by LpL, sPLA2 or SMase (indicated), followed by analysis as described in parts 2.4 and 2.5. SEC data of these LDL are shown in supplemental Figure S5.
(A) Heparin-sepharose affinity profiles of intact LDL (black) and lipolyzed LDL (gray).
(B) SDS PAGE (10–20%) of lipolyzed LDL and of similar LDL that have been incubated with trypsin for 1 h (marked Trypsin). Intact LDL are shown for comparison.
(C) Far-UV CD spectra of intact LDL (circles) and of mildly lipolyzed LDL (solid lines).
The protein conformation in intact and in mildly lipolyzed LDL was assessed by tryptic digestion and CD spectroscopy. The results clearly showed that intact and LpL-treated LDL was resistant to proteolysis and showed similar far-UV CD spectra, indicating similar overall secondary structure in apoB (Figure 5D). In contrast, mild LDL lipolysis by SMase or sPLA2 greatly increased the apoB susceptibility to tryptic digestion, and CD spectra indicated structural disordering in apoB (Figure 5E). These results agree with our previous findings that lipolysis of LDL by sPLA2 induces progressive β-sheet unfolding and partial fragmentation of apoB [37]. Together, our results suggest that lipolytic remodeling that increases the affinity of bound LDL for heparin (e.g. lipolysis by SMase or sPLA2, but not by LpL) involves structural disordering in apoB. Such a disordering probably stems from the reorganization of the LDL surface upon hydrolysis of phospholipids.
To dissect the effect of NEFA, which are generated by lipases such as sPLA2 and LpL, a control experiment was performed. LDL were enriched in exogenous oleic acid as described in Methods part 2.6 under conditions that produce no other biochemical changes and no overall secondary structural changes detectable by far-UV CD (Figure S6). NDGE and electron microscopy showed that LDL particle size did not change upon enrichment, while the agarose gel electrophoresis showed an increased negative net charge; nevertheless, heparin affinity profiles of the intact and oleic acid-enriched LDL closely superimposed (Figure S6). This result is consistent with heparin affinity profiles of intact and LpL-treated LDL, which were similar despite different NEFA content (Figure 5A). We conclude that, despite increased negative net charge on LDL, which affects long-range electrostatic interactions, increased content of NEFA per se does not significantly influence LDL-heparin interactions. This result indicates that long-range non-specific electrostatic interactions do not significantly contribute to LDL binding affinity for heparin. This is consistent with the notion that LDL binding to heparin and to PG is driven by short-range Coulombic interactions involving specific Lys and Arg in apoB [4, 8, 21].
Finally, we tested whether limited proteolysis of apoB alters LDL binding to heparin. LDL were incubated with trypsin for 1 h, and the reaction products were assessed by SDS PAGE (Figure S7A). SEC profile showed no significant changes in trypsin-treated vis-à-vis intact LDL, indicating lack of lipoprotein aggregation or fusion (Figure S7B). Although far-UV CD spectra showed some secondary structural unfolding in trypsin-treated LDL, the heparin affinity profiles remained invariant (Figure S7C, D) suggesting that mild tryptic digestion did not change the heparin binding sites in apoB.
In summary, our results show that specific changes in LDL surface that involve apoB disordering increase the affinity of bound LDL for heparin. One example is structural remodeling and fusion of LDL upon mild vortexing, which produces no detectable biochemical changes but causes partial unfolding of the secondary structure in apoB and greatly increases the affinity for heparin of bound LDL (Figure S4). Another example is mild lipolysis by SMase or sPLA2 that hydrolyze surface phospholipids and induce structural disordering in apoB, which also increases the heparin affinity of bound LDL (Figure 5). In contrast, mild lipolysis of core lipids by LpL, which does not affect the apoB conformation, has little effect on the LDL affinity for heparin (Figure 5). Finally, LDL enrichment with NEFA or mild tryptic digestion of apoB have no effect on the heparin binding despite increased structural disordering in apoB (Figures S6, S7). Together, these results suggest that greater affinity of bound LDL for heparin involves structural disordering in apoB, which perhaps reflects increased exposure of the heparin binding sites. However, not all disordering in apoB increases the heparin binding affinity (Figures S6, S7), suggesting that changes at specific protein sites are important. Furthermore, changes in the NEFA content per se do not affect the binding, highlighting the key role of short-range specific interactions involving apoB (rather than long-range non-specific electrostatic interactions) for LDL-heparin binding.
3.4. Effects of LDL oxidation on the binding to heparin
Lipoprotein oxidation is a complex process that occurs in vivo, particularly in the arterial wall where it importantly contributes to LDL retention and atherogenesis ([4, 31, 38] and references therein). We determined how progressive oxidation of LDL influences its binding to heparin. Intact LDL was incubated with CuSO4 for up to 90 min as described in part 2.6 Methods, and the reaction was monitored by Abs234 for conjugated dienes generated during lipid peroxidation (solid line, Figure 6A). To obtain LDL oxidized to various stages, the reaction was stopped after 30, 45 or 60 min (circles, Figure 6A). Heparin affinity profiles showed that copper oxidation progressively shifted the population distribution from bound to the flow-through fraction; at late oxidation stages, heparin binding was completely blocked (Figure 6C). This was accompanied by the decline in free amines upon Lys modifications (Figure 6B) with concomitant formation of conjugated dienes (Figure 6A). Since specific Lys and Arg in apoB are responsible for LDL binding to heparin, our results suggest that progressive loss of bound LDL upon oxidation by copper reflects oxidative modifications in apoB lysines. Extensive LDL aggregation/cross-linking observed at advanced stages of copper oxidation [31] can also block the binding. Similarly, previous studies used proteoglycan affinity chromatography to show that LDL oxidation involving Lys modifications progressively blocks the binding to PG [39, 40].
Figure 6.

Oxidation by copper alters LDL affinity for heparin. Normolipidemic single-donor LDL have been oxidized by CuSO4 as described in Methods part 2.6. The reaction was stopped after 30, 45 or 60 min (indicated) to obtain LDL oxidized to various stages; 0 indicates intact LDL.
(A) The time course of lipid peroxidation monitored continuously by absorbance at 234 nm (solid line).
(B) Loss of free amine in apoB via Shiff base formation monitored at 15 min intervals (line + symbols). Mean values of biological and technical triplicates are shown.
(C) Heparin affinity profiles of LDL oxidized to various stages; the incubation time with copper is indicated. NaCl concentration is shown in the bottom plot. Arrow indicates an additional higher-affinity peak seen at early stages of oxidation.
(D) Far-UV CD spectra of intact LDL (0 min, black) and mildly oxidized LDL (30 min, gray).
(E) Limited proteolysis of intact LDL (0) and mildly oxidized LDL (30). LDL were incubated with trypsin for 1 h followed by SDS PAGE analysis.
After 30 min incubation with copper, bound LDL showed an additional peak that eluted at higher salt, representing an LDL population with increased affinity for heparin (arrow, Figure 6C). This peak was observed at the end of the oxidation “lag phase”, before the onset of rapid phospholipid peroxidation and Lys modifications during the “propagation phase” (Figure 6A, B). Since this early stage approximates minimally modified LDL found in circulation ([31] and references therein), stronger binding of such LDL to heparin is potentially physiologically relevant, especially since circulating minimally modified LDL contain LDL(−) that have been previously shown to have increased affinity for PG [41]. In the current study, protein conformation at this early oxidation stage was probed by CD spectroscopy and by limited proteolysis using 1 h incubation with trypsin followed by SDS PAGE. CD spectra did not detect any secondary structural changes after 30 min oxidation by copper but the proteolytic susceptibility was increased, indicating increased solvent accessibility of apoB (Figure 6D, E).
To verify that stronger heparin binding by minimally oxidized LDL was not limited to copper oxidation, LDL was oxidized using MPO, an enzyme that acts on lipoproteins in vivo, particularly in the arterial wall. To oxidize LDL to various stages, it was incubated for 30, 60 or 90 min using MPO/H2O/Cl system as described in Methods part 2.6. Such a treatment converts methionine to sulfoxide and tyrosine to 3-chlorotyrosine, followed by modifications of Phe, Trp, His and Lys upon extensive oxidation. NDGE showed no changes in the particle size upon MPO oxidation to various stages, agarose gel electrophoresis showed a small increase in the net negative charge after 90 min of incubation, and free amines showed no major changes, indicating no major Lys modifications in apoB (Figure 7A, B). Consistent with this observation, MPO-induced oxidation did not cause any major changes in the population distribution of bound LDL versus the flow-through fraction in the heparin affinity profiles (Figure 7C). Importantly, bound LDL showed a progressive peak shift to higher salt upon oxidation by MPO, indicating a progressive increase in the heparin binding affinity (Figure 7C). ApoB conformation at various oxidation stages was probed by CD spectroscopy and limited proteolysis. Far-UV CD spectra indicated a progressive loss of the secondary structure upon oxidation, especially after 90 min, which also greatly accelerated tryptic digestion of apoB (Figure 7D, E). These results are consistent with our previous studies showing that LDL oxidation by MPO and, to a lesser extent, by copper induces partial unfolding of apoB [31]. We conclude that LDL oxidation by MPO induces a progressive loss of ordered secondary structure in apoB, an increased susceptibility to proteolysis, and an increased affinity for heparin.
Figure 7.

Oxidation of LDL by myeloperoxidase alters apoB conformation and LDL affinity for heparin. Normolipidemic single-donor LDL have been oxidized using MPO/H2O2/NaCl system for 30, 60, or 90 min (indicated); 0 denotes intact LDL.
(A) NDGE and agarose gel electrophoresis of intact LDL and MPO-oxidized LDL.
(B) Free amines in apoB at various stages of LDL oxidation. Mean values of three independent biological and technical replicates ±STD are shown; * p<0.5 indicates a moderate difference compared to intact LDL (C) Heparin affinity profiles of LDL oxidized to various stages.
(D) Far-UV CD spectra of LDL oxidized to various stages.
(E) Limited tryptic digestion of oxidized LDL monitored by SDS PAGE. LDL have been oxidized for 30 – 90 min as indicated, followed by incubation with trypsin for 1 h at 37 °C. Intact LDL and LDL that have been oxidized for 90 min without tryptic digestion were used as controls.
Taken together, the results in Figures 6 and 7 show that at early oxidation stages that mimic minimally modified LDL in vivo, the heparin binding affinity increases upon LDL oxidation by either copper or MPO, which is accompanied by structural disordering in apoB. To our knowledge, this is the first convincing evidence for such an increased binding by mildly oxidized LDL. However, advanced LDL oxidation by copper that modifies apoB lysines blocks the heparin binding. These results verify and extend previous studies reporting that, unlike extensive oxidation, mild oxidation of LDL does not block the binding to HSPG and may even slightly augment it [40, 42].
3.5. Effects of LDL glycation and glycoxidation on the binding to heparin
Increased glycation is a hallmark of diabetic hyperglycemia. LDL glycation occurs at specific sites in apoB and phospholipids, alters structural and functional properties of LDL, and enhances its pro-atherogenic potential through several mechanisms, including increased arterial retention [14–18, 43]. Lipoprotein glycation in vivo is a complex process usually accompanied by oxidation, termed glycoxidation [43, 44]. This complexity, together with altered biochemical composition in diabetic LDL (described in part 3.7 below) makes it difficult to discern the effects of glycation on the properties of these LDL. In an effort to dissect the effect of LDL glycation on heparin binding, LDL from healthy donors were used in two types of in vitro experiments.
First, a controlled glycation under non-oxidative conditions was performed as described in part 2.6 Methods. The resulting gly-LDL showed a minimal decrease in free amines and no significant changes in AGEs, which were assessed by fluorescence (Figure S8A, B). This suggests no significant oxidative modifications in Lys and Arg. No oxidized phospholipids were detected by dot blot, and the levels of conjugated dienes monitored by Abs234 remained invariant (Figure S8C, D), suggesting no significant phospholipid oxidation. However, gly-LDL showed a small but significant increase in NEFA indicating lipolysis, accompanied by a small but significant increase in the net negative charge observed on the agarose gel (Figure S8E, F). NDGE showed no changes in the particle size, SDS PAGE showed no protein aggregation or fragmentation (Figure S8G, H), and spectroscopic analyses detected no changes in the Trp environment or the secondary structure of apoB (Figure S6J, K). However, limited tryptic digestion showed increased susceptibility to proteolysis of apoB in gly-LDL (Figure S8I). Importantly, heparin affinity profiles showed a large peak shift to higher salt for bound gly-LDL, indicating stronger binding to heparin (Figure S8L). In summary, in vitro LDL glycation without detectable oxidation greatly increases the heparin binding affinity of LDL. Conformational changes in apoB upon glycation and mild lipolysis probably contribute to this effect.
Second, LDL was glycated under oxidative conditions upon incubation for 1 to 6 days with methylglyoxal, a highly reactive glycating agent that can form during oxidative stress in DM2 [45]. LDL glycated by this method (glyox-LDL) was prepared and characterized at various incubation stages (days 1, 3 and 6) as described in part 2.6; the results are reported in Figure S9. Briefly, after 1 day of incubation, glyox-LDL showed no changes in free amines, no AGEs fluorescence, a minimal increase in NEFA, no changes in the net charge on the agarose gel, no phospholipid oxidation detected by dot blot, no apoB aggregation or fragmentation observed by SDS PAGE (Figure S9A–G), and no changes in the apoB secondary structure or Trp environment detected by CD and fluorescence spectroscopy (Figure S7I, J). However, limited tryptic digestion showed increased apoB susceptibility to proteolysis after day 1. Moreover, NDGE and SEC showed a decrease in the particle size after day 1 (Figure S9H, K), consistent with previous finings that minimal modifications by methylglyoxal convert intact LDL into small dense LDL [45]; these particles have an altered apoB conformation, are retained more strongly by HSPG, and are particularly pro-atherogenic [2, 44, 45]. Importantly, heparin affinity profile of minimally modified glyox-LDL showed a peak shift for bound LDL to high salt, indicating increased affinity for heparin (day 1, Figure S9L). Upon further glycoxidation, the position of this peak remained invariant but its intensity declined, while the flow-through fraction progressively increased (day 1 – 6, Figure S9L), suggesting progressive blocking of the heparin binding sites. This was probably a result of lysine modifications in apoB upon advanced glycoxidation due to Lys oxidation, glycation, and AGEs formation (Fig. S79, B). LDL aggregation observed by SEC (Figure S9L), which was probably augmented by AGEs, could also contribute to blocking the heparin binding sites in apoB.
In summary, our results reveal that LDL glycation and glycoxidation in vitro increase the affinity of bound LDL for heparin. This is evident from the heparin affinity profiles showing a peak shift to higher salt for bound gly-LDL and glyox-LDL (Figures S8L, S9M). Importantly, this shift is accompanied by increased solvent exposure of apoB evident from its increased susceptibility to proteolysis upon glycation or mild glycoxydation (Figure 8I, 9I). Further glycoxidation in vitro progressively decreases the population of bound LDL, but glycation alone does not cause this effect (Figures S8, S9).
Figure 8.
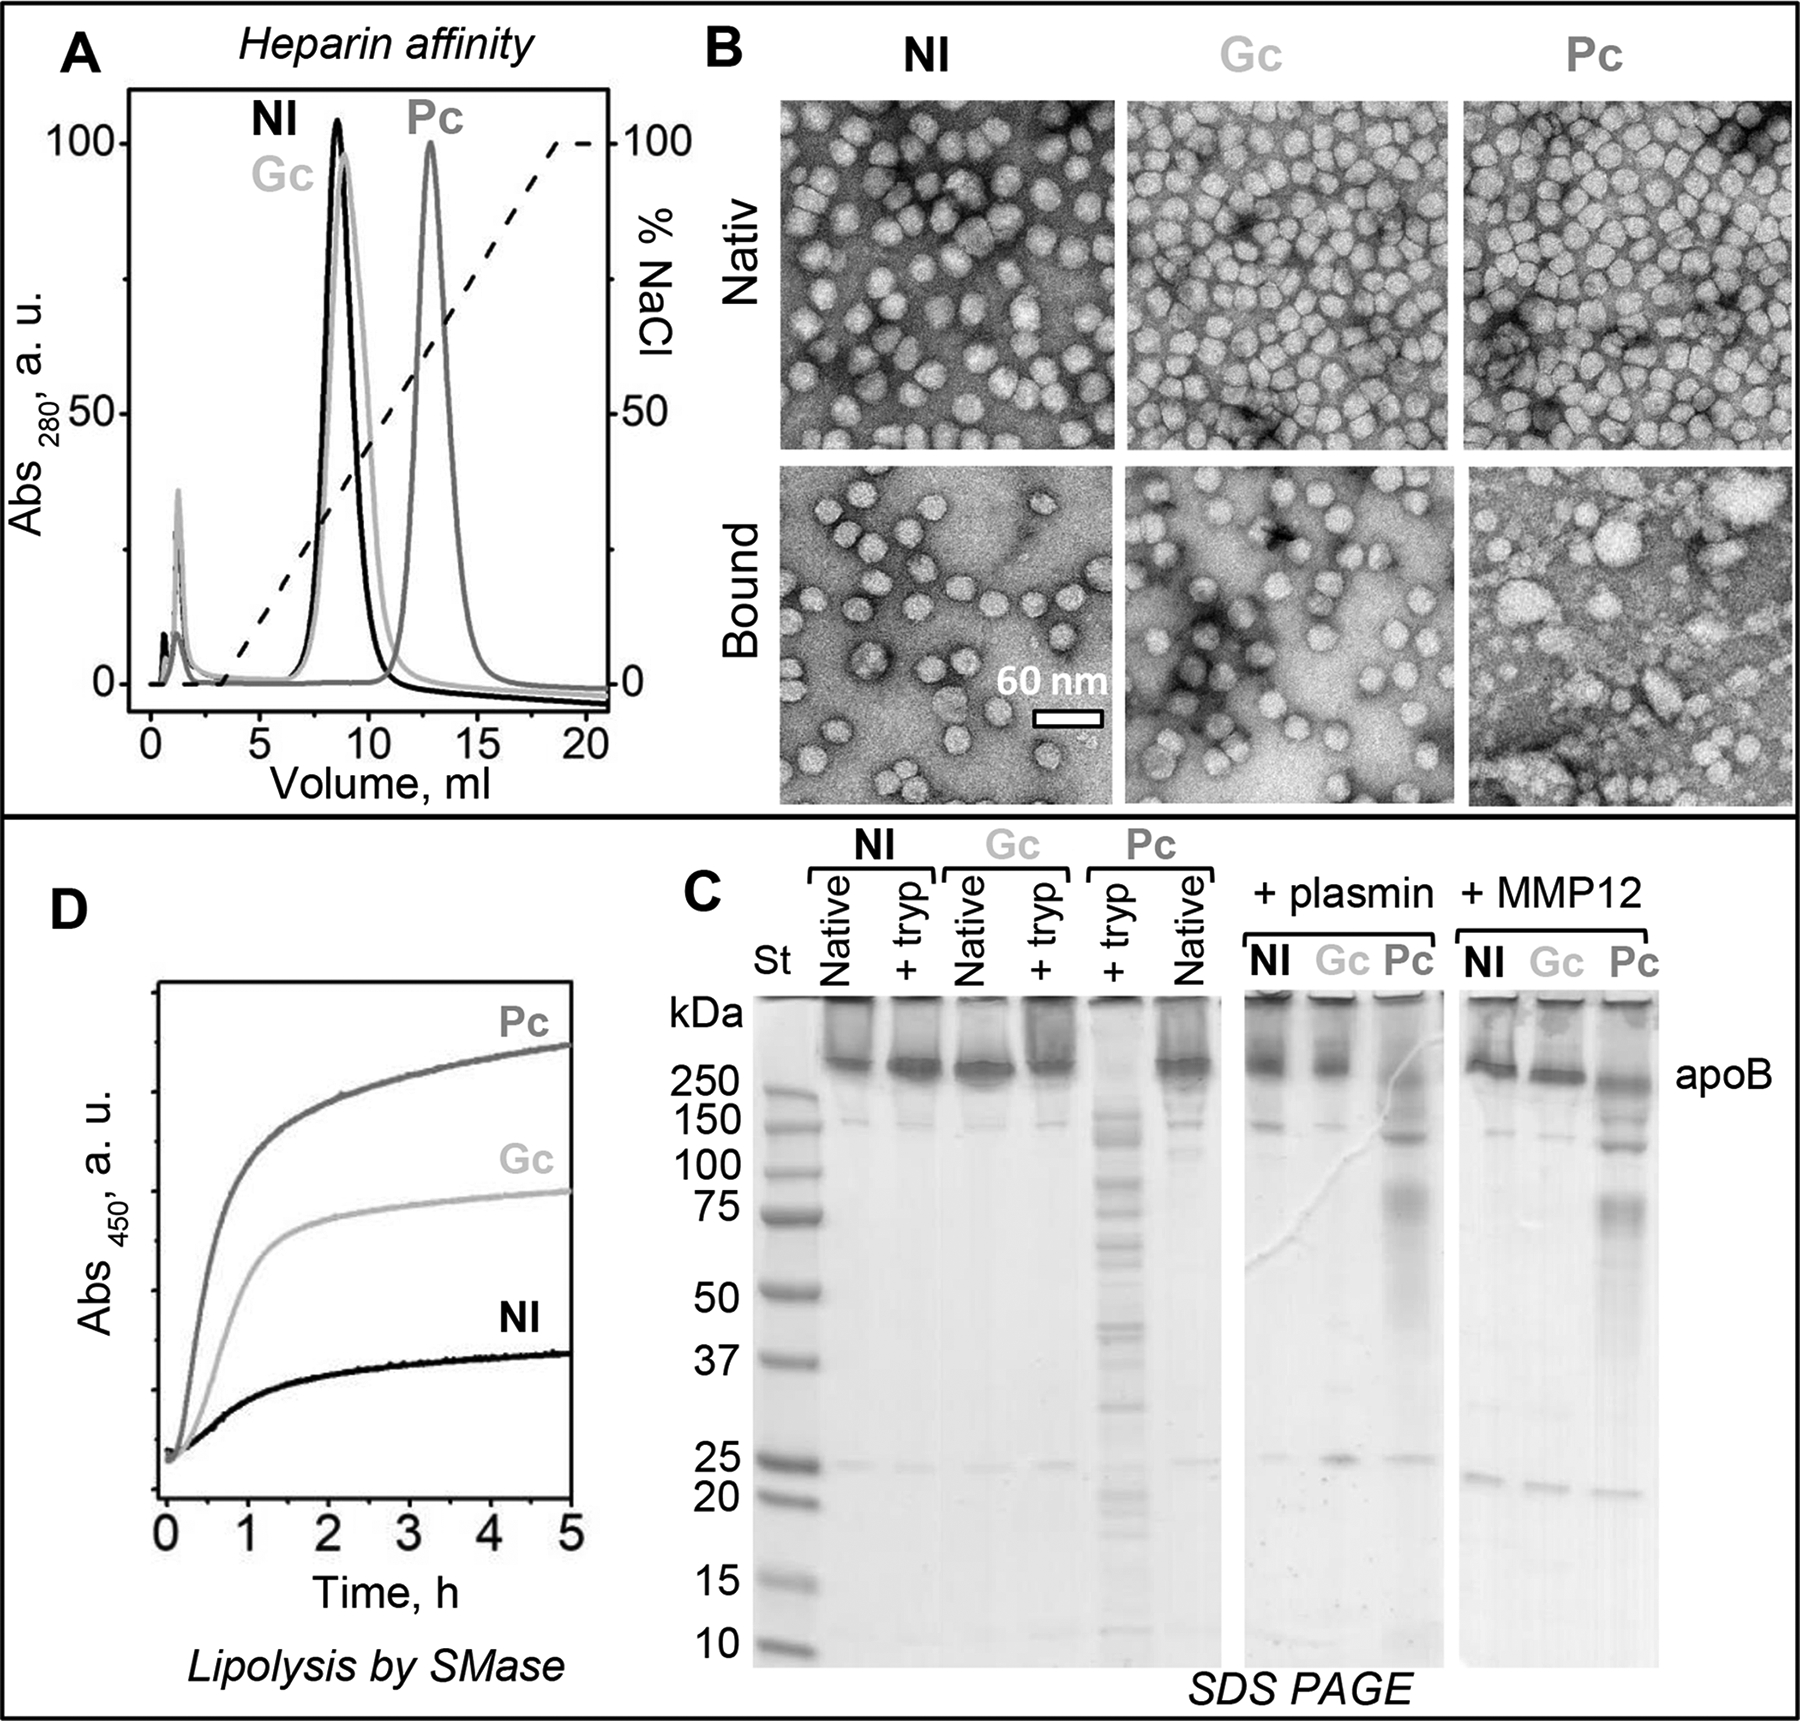
LDL from patients with diabetic hyperglycemia binds heparin more strongly, which compromises the lipoprotein structural integrity. LDL were isolated from pooled plasma of normolipidemic subjects (Nl), of newly diagnosed diabetes-2 patients with poor glycemic control (Pc, HbA1c≥7), and of similar diabetes-2 patients whose glycemic control has been restored upon treatment (Gc, HbA1c<7); see Methods part 2.2 for details. Biochemical composition of these LDL is listed in supplemental Table S2; Figure S11 shows additional biochemical and spectroscopic data.
(A) Heparin affinity profiles of Nl-LDL, Pc-LDL and Gc-LDL. The major peak containing bound LDL was isolated from intact LDL for comparative analysis.
(B) Electron micrographs of negatively stained Nl-LDL, Pc-LDL and Gc-LDL before (intact) and after binding to and release from heparin (bound).
(C) SDS PAGE (10–20%) of Nl-LDL, Gc-LDL and Pc-LDL before (intact) or after incubation for 1 h with trypsin (left panel) or for 3 h with plasmin (central panel) or MMP-12 (right panel) as described in part 2 Methods.
(D) LDL lipolysis by SMase. The reaction time course was monitored continuously by turbidity (absorbance) at 450 nm for changes in the particle size upon aggregation of hydrolyzed LDL.
3.6. Effects of exogenous apoE and apoC-III on LDL-heparin interactions
In addition to apoB, minor proteins such as apoE and apoC-III can also affect LDL-PG interactions [9, 11, 12]. To test these effects, LDL was incubated with either apoE or apoC-III as described in part 2.4 Methods, followed by LDL re-isolation by SEC for further studies (Figure S10A). The enrichment of these LDL with exogenous apoE or apoC-III was confirmed by immunoblotting (Figure S10B). Heparin affinity chromatography clearly showed that the peak for the bound LDL shifted to higher salt upon enrichment in either apoE or apoC-III (Figure S10C), indicating increased heparin binding affinity of these particles. These results are consistent with previous studies showing direct binding of PGs to apoE on the lipoprotein surface [9]. Also, both endogenous and exogenous apoC-III has been shown to enhance LDL binding to biglycans; since apoC-III does not bind PGs directly, the enhanced binding was attributed to indirect effects of apoC-III on the accessibility of specific binding sites in apoB and/or apoE [11, 12]. Our results, which are consistent with these findings, also show that although the HS-binding affinity of bound LDL increases, the amount of bound LDL decreases upon enrichment in apoC-III (Figure S10C), which probably reflects the indirect effects of apoC-III on the heparin binding sites in apoB and/or apoE. Since apoC-III is elevated in diabetes and is reported to be pro-atherogenic, these effects may potentially contribute to the link between diabetes and atherosclerosis [12].
3.7. Glycemic control in diabetes has a large impact on LDL-heparin interactions
Finally, heparin binding by diabetic LDL was explored. LDL were isolated from plasma pooled from three patients’ cohorts: healthy normolipidemic subjects (Nl), untreated patients newly diagnosed with DM2 with poor glycemic control (Pc, HbA1c≥7%), and similar patients whose treatment resulted in the improved glycemic control (Gc, HbA1c<7%). Additional details are provided in Methods part 2.2 and in [25]; lipoprotein biochemical composition is listed in Table S2. Particle sizes of intact LDL from these three cohorts were very similar [25]. However, heparin affinity profiles revealed a striking difference: while Nl-LDL and Gc-LDL showed similar profiles, with only a slight peak shift in bound Gc–LDL towards higher salt (higher affinity for heparin), bound Pc-LDL showed a much larger shift, from about 0.3 M to 0.6 M NaCl, indicating a large increase in the heparin binding affinity (Figure 8A).
Similarly, previous studies reported increased binding to PG of LDL from hyperglycemic DM2 patients; moreover, LDL binding was restored to normal levels upon successful treatment of hyperglycemia [17, 19]. These studies used PG from rabbit aorta, and the binding was quantified using LDL precipitation by PG, yet their findings were qualitatively very similar to ours. This justifies the use of heparin affinity chromatography for the analysis of factors relevant to LDL interactions with arterial PG.
Intact LDL and bound LDL isolated by heparin affinity chromatography were visualized by electron microscopy (Figure 8B). As expected, intact Nl-LDL, Gc-LDL and Pc-LDL displayed similar size and morphology. Furthermore, for Nl-LDL and Gc-LDL, the size and morphology of intact and bound LDL were similar. In stark contrast, bound Pc-LDL showed not only intact-size LDL but also smaller and larger particles that were products of lipoprotein disintegration and fusion (Figure 8B, bottom right). Therefore, bound Pc-LDL became structurally labile, and a subset of these lipoproteins spontaneously disintegrated. This finding shows that combined effects of hyperglycemia and heparin binding are especially destabilizing and cause LDL disintegration and fusion. To our knowledge, this effect has not been previously reported. It is consistent with the lipid phase separation observed in LDL-PG complexes over time [20], indicating that LDLs in such complexes gradually disintegrate, fuse and coalesce into lipid droplets. Our results suggest that LDLs that bind heparin more strongly disintegrate faster upon such binding.
In the next series of experiments, we explored potential modifications in Nl-LDL, Gc-LDL and Pc-LDL which could contribute to the observed differences in their heparin binding affinity and structural stability. First, we probed apoB conformation using limited proteolysis by trypsin, plasmin or MMP-12. SDS PAGE revealed that all three proteases caused extensive apoB fragmentation in Pc-LDL, while in Nl-LDL and Gc-LDL under similar conditions apoB remained intact (Figure 8C). Therefore, apoB on Pc-LDL underwent conformational changes that decreased its protection from proteolysis, but in Gc-LDL the protein protection was restored. This conclusion was supported strongly by far-UV CD spectra showing that the well-ordered secondary structure in apoB decreased in Pc-LDL but was partially restored in Gc-LDL (Figure S11A) [25]. Additionally, Trp emission spectra of Nl-LDL, Gc-LDL and Pc-LDL showed a similar wavelength of maximal fluorescence, but only Pc-LDL showed a reduced emission intensity consistent with less well-ordered apoB conformation (Figure S11B). Together, these results show that the protein structure is less well-ordered in Pc-LDL as compared to Gc-LDL and Nl-LDL.
Lysine modifications, which can occur upon glycoxidation, were probed by measuring free amines. Pc-LDL consistently showed a small but significant decrease in free amine (Figure S11C). A significant increase in NEFA was observed in Gc-LDL and, particularly, in Pc-LDL (Figure S11D). Pc-HDL also showed oxidized phospholipids on the dot blot (Figure S11E). However, fluorescence at 450 nm (λex=350 nm) showed no significant differences among Nl-LDL, Gc-LDL and Pc-LDL, suggesting the absence of AGEs (Figure S11F). This was consistent with similar net charge, similar particle size, and the absence of apoB aggregation (which can be induced by AGEs) detected in these particles by the agarose gel, NDGE and SDS PAGE, respectively (Figure S11G–I). Taken together, the results in Figures S8, S9, and S11 indicate less extensive apoB glycation in Pc-LDL in vivo, as compared to gly-LDL and glyox-LDL obtained in vitro. This is consistent with previous studies that used antibodies to various apoB epitopes to show that LDL glycation in vivo and in vitro upon prolonged incubation with glycose caused increased exposure of different apoB epitopes, suggesting less extensive LDL remodeling in vivo [46].
In addition to apoB, we probed for minor LDL proteins that can directly bind heparin (apoE, apoJ) [9, 10] or influence the binding indirectly (apoC-III) [11, 12]. LDL was also probed for the presence of LpPLA2 (also known as platelet-activating factor acetylhydrolase) that provides a biomarker of atherosclerosis and its therapeutic target; most circulating LpPLA2 is bound to LDL where it preferentially hydrolyzes oxidized phospholipids that are elevated in diabetes [47, 48]. Western blotting using Nl-LDL, Gc-LDL and Pc-LDL showed similar results for apoB. However, Pc-LDL showed a 22 kDa N-terminal fragment of apoE, a higher molecular-weight band for apoC-III that probably reflected protein dimerization upon glycation (Figure S11J), and increased levels of apoJ and LpPLA2 (Figure S11J). The latter was consistent with increased levels of NEFA and oxidized phospholipids found in Pc-LDL (Figure S11D, E), as well as with our previous findings of increased levels of LpPLA2 in DM2 patients with poor glycemic control [48, 49]. These protein and lipid modifications probably contribute to the increased levels of LDL(−) observed by anion exchange chromatography in Pc-LDL as compared to Nl-LDL and Gc-LDL (Figure S11K), which is consistent with our previous findings of increased LDL(−) in diabetes [47–49]. Together, these surface modifications in the protein and lipid moieties of Pc-LDL probably contribute to its increased affinity for heparin (Figure 8A, C) as well as its decreased structural stability that, as we previously showed, is highly sensitive to NEFA levels [37].
Finally, LDL was probed for its susceptibility to lipolysis. Pc-LDL, Gc-LDL and Nl-LDL were incubated with SMase, and the reaction time course was monitored by turbidity for lipoprotein aggregation as described in part 2.6 Methods. The reaction rate increased in order Nl-LDL<Gc-LDL<Pc-LDL (Figure 8D). A similar rank order was observed previously in the LDL susceptibility to oxidation and thermal denaturation; this was attributed to the increasingly disordered apoB conformation, along with the increased levels of triglycerides and NEFA found in Pc-LDL and, to a lesser degree, in Gc-LDL [25].
In summary, the results in Figures 8 and S11 reveal that, compared to Nl-LDL and Gc-LDL, Pc-LDL binds heparin more strongly and is particularly destabilized by this binding to the point of spontaneous disintegration and fusion (Figure 8A, B). Since binding to HSPG and fusion of LDL are strongly pro-atherogenic, the enhancement of both these processes in Pc-LDL may provide a mechanistic link between diabetes and atherosclerosis even in the absence of AGEs. Importantly, treatment of DM2 that restores glycemic control decreases LDL-heparin binding to normal levels (Figure 8A) and partially restores the biochemical composition of LDL and its structural stability and susceptibility to hydrolysis (Table S2, Figure S11). Our results suggest that these changes in LDL-heparin interactions are influenced by several modifications in diabetic LDL, such as the secondary structural disordering in apoB (Figure S11A), increased LDL susceptibility to proteolysis and lipolysis (Figure 8C, D), increased oxidation and hydrolysis of surface phospholipids (Figure S11D, E), as well as changes in the minor LDL proteins such as apoE, apoJ, apoC-III and Lp-PLA2 (Figure S11J). ApoB glycation (Figure S8, S9) can also contribute to structural disordering in Pc-LDL and its enhanced binding to heparin, even though LDL glycation in vivo and in vitro is distinctly different.
4. DISCUSSION
This study reports a systematic analysis of mutual effects of LDL-heparin binding on the biochemical and structural changes in human LDL. The main findings are: i) binding to heparin alters the structure of LDL making it more susceptible to hydrolytic and oxidative modifications; ii) conversely, hydrolytic and oxidative modifications in the LDL surface can cause structural disorder in apoB that increases its affinity for heparin; iii) the affinity for heparin is higher in LDL from hyperglycemic DM2 patients as compared to healthy and normoglycemic subjects. Furthermore, this study reinforces the link between irreversible LDL modifications upon HSPG interactions and the formation of electronegative LDL found in blood. Since LDL(−) are particularly pro-atherogenic and are elevated in diabetes, the importance of these findings is in reinforcing the mechanistic link between LDL modifications, which are increased in diabetes and augment LDL-PG interactions, and atherosclerosis.
Heparin-sepharose affinity chromatography was used to isolate LDL after binding to heparin, and also as an analytical tool to detect modified lipoproteins differing in their heparin binding affinity. This is particularly useful for heterogeneous macromolecular complexes such as plasma lipoproteins, which undergo modifications such as oxidation, glycation and hydrolysis of various protein and lipid moieties. Although heparin affinity chromatography does not depict specific details of LDL interactions with arterial PGs, it helps identify key aspects of such interactions and how they change upon biochemical and structural modifications of LDL. Biological relevance of the heparin affinity chromatography is underscored by our finding that LDLs from hyperglycemic patients bind heparin more strongly than their normoglycemic counterparts (Pc-LDL compared to Nl-LDL and Gc-LDL, Figure 8A). A very similar finding was reported in previous studies that used PG isolated from rabbit aorta and quantified the binding by LDL precipitation [17, 19]. This similarity suggests that heparin affinity chromatography is useful for identifying LDL properties that importantly influence the pro-atherogenic binding to arterial PG and for determining how LDL modifications in diseases such as diabetes affect the binding.
Previous studies have established that LDL interactions with the PG matrix in the arterial wall initiate atherosclerosis, and that these interactions are augmented by LDL modifications in diabetes; in turn, LDL-PG interactions induce irreversible morphological and biochemical changes in LDL [2–4], although the order of these changes was unclear. The results reported here, supported by previous findings, suggest that conformational changes in apoB initiate the binding and are also an early irreversible change that occurs in LDL after biding and release from HSPG. This early step is followed by increased oxidation, hydrolysis and aggregation of LDL, all of which are pro-atherogenic.
Both previous and current studies of diabetic LDL showed that restoration of the glycemic control upon combinational therapy for DM2 restored the heparin binding affinity of the patients’ LDL (Figure 8A), even though the lipid profiles were only partially restored (Table S1) [19]. This prompted Edwards and colleagues to propose that increased binding of hyperglycemic LDL to arterial PG is due solely to increased glycation of apoB [19]. Our results appear consistent with this idea and show that LDL glycation and glycoxidation in vitro enhance the heparin affinity of bound LDL (Figures S8L, S9M). However, such results should be interpreted with caution, since LDL glycation in vitro is more extensive than that in vivo and generates different products; in particular, LDL glycated in vitro and in vivo show increased exposure of different apoB epitopes [46], reflecting conformational differences in apoB which may influence its binding to PG. The current study suggests a more complex causal relationship wherein various modifications in diabetic LDL potentially contribute to its increased heparin binding affinity. These modifications can include not only glycation but also mild oxidation as well as hydrolysis of surface lipids, which increase LDL binding to heparin in vitro (Figures 5–7, S8, S9). Such oxidative and hydrolytic modifications are increased in DM2 but are largely restored upon therapy that optimizes patients’ glycemic control (Figure 8, S11). Taken together, the results of this and previous studies suggest a multifaceted mechanistic link between enhanced arterial retention of LDL in diabetes and specific LDL modifications such as glycation, mild oxidation and phospholipid lipolysis.
Our results verified some of the more subtle changes that emerged from previous binding studies employing either arterial HSPG or heparin. For example, previous studies of LDL oxidized by various methods showed that extensive oxidation with Lys modifications blocked the binding to arterial HSPGs [39, 40, 42], whereas mild oxidation without Lys modifications did not block the binding [40] and even slightly enhanced it [42]. Since the effects of mild oxidation approached the detection limits of the gel mobility shift assay or surface plasmon resonance used in those studies, these findings required a verification. The current study clearly shows that mild oxidation without Lys modifications, which occurs at early stages of copper-induced oxidation (Figure 6, 30 min) or upon oxidation by MPO (Figure 7), increases the affinity of bound LDL for heparin. In contrast, extensive oxidation that causes Lys modifications shifts the population distribution from bound LDL to the flow-through fraction (Figures 6), probably by blocking the heparin-binding lysines in apoB. Our findings suggests that enhanced binding of minimally oxidized LDL to heparin (and perhaps to arterial PGs) can augment the arterial retention of LDL and thereby contribute to the enhanced pro-atherogenic action of oxidized LDL.
An important trend emerging from the current study is that modifications in LDL that increase its affinity for heparin are accompanied by increased solvent accessibility of apoB and its structural disordering. This manifests itself as increased susceptibility to proteolysis, a method that we find particularly useful to assess structural changes in this large lipid-bound glycoprotein; in several instances, loss of ordered secondary structure in apoB can be detected by CD spectroscopy. Here, we report apoB disordering accompanied by an increased affinity for heparin of bound LDL upon several modifications, including: brief vortexing (Figure S4); hydrolysis of LDL phospholipids by sPLA2 or SMase, but not of the core triglycerides by LpL (Figure 5); mild LDL oxidation by copper (30 min, Figure 6) or by MPO (Figure 7); glycation and glycoxidation (gly-LDL and glyox-LDL in Figures S8 and S9); and in hyperglycemic LDL (Pc-LDL vis-à-vis Gc-LDL and Nl-LDL in Figure 8, S11).
Importantly, the current study shows that, after binding to heparin, LDL acquires properties resembling those of LDL(−) present in blood. Indeed, similar to bound LDL, LDL(−) is more heterogeneous in size, contains more NEFA, and is more susceptible to oxidation, proteolysis, lipolysis, structural destabilization and aggregation as compared to native LDL [26, 34]. Moreover, LDL(−) have increased affinity for PG, and the levels of LDL(−) increase in DM2 subjects but decrease upon optimization of the glycemic control [34]. Although in the current study we used heparin rather than PG from the arterial wall, the similarity between our results and those of Camejo’s group using PG [21] suggest that circulating LDL(−) may originate, at least in part, from LDL that enter the arterial wall, interact with PGs, and then return to circulation. A similar idea was originally proposed by Avogaro and coworkers in their first report describing LDL(−) [33], but its testing proved problematic. The results reported here strongly support this important idea.
Together, these results compel us to propose that mild oxidation, glycation and hydrolysis of surface lipids, as well as mechanical perturbation of LDL such as brief vortexing, induce irreversible conformational changes in apoB. These changes increase solvent exposure of apoB, making it more susceptible to proteolysis and probably unmasking additional heparin binding sites. Conversely, LDL binding to heparin causes irreversible biochemical and structural changes in LDL (Figures 2–4), which probably stem from the increased solvent exposure of apoB that becomes more susceptible to proteolysis (Figure 2). We hypothesize that binding to heparin lifts parts of apoB off the lipid surface, thereby increasing solvent accessibility of both the protein and the lipid moieties, which promotes their hydrolysis and oxidation, while also decreasing the structural stability of the LDL assembly (Figure 4). This idea is consistent with heparin-induced dissociation of small apolipoproteins such as serum amyloid A from the lipoprotein surface, which was proposed to contribute to the development of the inflammation-linked amyloidosis [50]. Due to its large size and hydrophobicity, full-length apoB does not completely dissociate from LDL upon binding to heparin or PGs. However, the results reported here suggest that increased solvent exposure of apoB upon such binding triggers biochemical and structural changes in LDL that are expected to contribute to the development of atherosclerosis.
Supplementary Material
Highlights.
Heparin binding enhanced apoB disordering and LDL hydrolysis, oxidation and fusion
Conversely, mild oxidation, glycation and phospholipid lipolysis strengthen heparin binding
LDL from hyperglycemic DM2 patients shows greater heparin binding and destabilization
Optimization of the glycemic control restores LDL stability and heparin binding affinity
The results reinforce the mechanistic link between hyperglycemia and atherosclerosis
ACKNOWLEDGEMENTS
We are grateful to Donald L. Gantz and Dr. Esther A. Bullitt for expert help with transmission electron microscopy, and to Dr. Anita Gosh for her invaluable help with affinity chromatography setup. This work was funded by the National Institutes of Health grants RO1 GM026267, R01 GM135158 and T32 HL007969, and by ISCIII/FIS PI16-00471 from the Spanish Ministry of Health with FEDER funds.
Abbreviations:
- LDL
low-density lipoprotein
- DM2
type-2 diabetes mellitus
- apo
apolipoprotein
- HS
heparan sulfate
- PG
proteoglycans
- NEFA
non-esterified (free) fatty acid
- AGEs
advanced glycation end-products
- sPLA2
secretory phospholipase A2
- LpPLA2
lipoprotein-associated phospholipase A2
- LpL
lipoprotein lipase
- PLC
phospholipase C
- SMase
sphingomyelinase
- MPO
myeloperoxidase
- MMP
matrix metalloproteinase
- SEC
size-exclusion chromatography
- NDGE
non-denaturing polyacrylamide gel electrophoresis
- CD
circular dichroism
- Nl
normolipidemic
- Gc
good glycemic control
- Pc
poor glycemic control
- PBS
phosphate buffer saline
- TBS
Tris buffer saline
Footnotes
Publisher's Disclaimer: This is a PDF file of an unedited manuscript that has been accepted for publication. As a service to our customers we are providing this early version of the manuscript. The manuscript will undergo copyediting, typesetting, and review of the resulting proof before it is published in its final form. Please note that during the production process errors may be discovered which could affect the content, and all legal disclaimers that apply to the journal pertain.
REFERENCES
- 1.Williams KJ, Tabas I The response-to-retention hypothesis of atherogenesis reinforced. Curr. Opin. Lipidol (1998) 9(5) 471–474. [DOI] [PubMed] [Google Scholar]
- 2.Camejo G, Hurt-Camejo E, Wiklund O, Bondjers G Association of apo B lipoproteins with arterial proteoglycans: pathological significance and molecular basis. Atherosclerosis. (1998) 139(2) 205–222. [DOI] [PubMed] [Google Scholar]
- 3.Skålén K, Gustafsson M, Rydberg EK, Hultén LM, Wiklund O, Innerarity TL, Borén J Subendothelial retention of atherogenic lipoproteins in early atherosclerosis Nature. (2002) 417(6890) 750–754. [DOI] [PubMed] [Google Scholar]
- 4.Khalil MF, Wagner WD, Goldberg IJ Molecular interactions leading to lipoprotein retention and the initiation of atherosclerosis. Arterioscler. Thromb. Vasc. Biol (2004) 24(12) 2211–2218. [DOI] [PubMed] [Google Scholar]
- 5.Borén J, Williams KJ The central role of arterial retention of cholesterol-rich apolipoprotein-B-containing lipoproteins in the pathogenesis of atherosclerosis: a triumph of simplicity. Curr. Opin. Lipidol (2016) 27(5) 473–483. [DOI] [PubMed] [Google Scholar]
- 6.Feig JE Regression of atherosclerosis: Insights from animal and clinical studies. Ann. Glob. Health (2014) 80(1) 13–23. [DOI] [PMC free article] [PubMed] [Google Scholar]
- 7.Fogelstrand P, Borén J Retention of atherogenic lipoproteins in the artery wall and its role in atherogenesis. Nutr. Metab. Cardiovasc. Dis (2012) 22(1) 1–7. [DOI] [PubMed] [Google Scholar]
- 8.Weisgraber KH, Rall SC Jr. Human apolipoprotein B-100 heparin-binding sites. J. Biol. Chem (1987) 262(23) 11097–11103. [PubMed] [Google Scholar]
- 9.Ji Z-S, Dichek HL, Miranda RD, Mahley RW Heparan sulfate proteoglycans participate in hepatic lipase and apolipoprotein E-mediated binding and uptake of plasma lipoproteins, including high density lipoproteins. J. Biol. Chem (1997) 272 31285–31292. [DOI] [PubMed] [Google Scholar]
- 10.de Silva HV, Harmony JA, Stuart WD, Gil CM, Robbins J Apolipoprotein J: structure and tissue distribution. Biochemistry. (1990) 29(22) 5380–5389. [DOI] [PubMed] [Google Scholar]
- 11.Olin-Lewis K, Krauss RM, La Belle M, Blanche PJ, Barrett PH, Wight TN, Chait A ApoC-III content of apoB-containing lipoproteins is associated with binding to the vascular proteoglycan biglycan. J. Lipid Res (2002) 43 1969–1977. [DOI] [PubMed] [Google Scholar]
- 12.Hiukka A, Ståhlman M, Pettersson C, Levin M, Adiels M, Teneberg S, Leinonen ES, Hultén LM, Wiklund O, Oresic M, Olofsson SO, Taskinen MR, Ekroos K, Borén J ApoCIII-enriched LDL in type 2 diabetes displays altered lipid composition, increased susceptibility for sphingomyelinase, and increased binding to biglycan. Diabetes. (2009) 58(9) 2018–2026. [DOI] [PMC free article] [PubMed] [Google Scholar]
- 13.Seshasai SR, Kaptoge S, Thompson A, Di AE, Gao P, Sarwar N, Whincup PH, Mukamal KJ, Gillum RF, Holme I, Njolstad I, Fletcher A, Nilsson P, Lewington S, Collins R, Gudnason V, Thompson SG, Sattar N, Selvin E, Hu FB, Danesh J Diabetes mellitus, fasting glucose, and risk of cause-specific death. New Engl. J. Med (2011) 364 829–841. [DOI] [PMC free article] [PubMed] [Google Scholar]
- 14.Hyperglycemia Aronson D. and the pathobiology of diabetic complications. Adv. Cardiol (2008) 45 1–16. [DOI] [PubMed] [Google Scholar]
- 15.Shah MS, Brownlee M Molecular and Cellular Mechanisms of Cardiovascular Disorders in Diabetes. Circ. Res (2016) 118(11) 1808–1829. [DOI] [PMC free article] [PubMed] [Google Scholar]
- 16.Tannock LR, King VL Proteoglycan mediated lipoprotein retention: a mechanism of diabetic atherosclerosis. Rev. Endocr. Metab. Disord (2008) 9(4) 289–300. [DOI] [PubMed] [Google Scholar]
- 17.Edwards IJ, Wagner JD, Litwak KN, Rudel LL, Cefalu WT Glycation of plasma low density lipoproteins increases interaction with arterial proteoglycans. Diabetes Res. Clin. Pract (1999) 46 9–18. [DOI] [PubMed] [Google Scholar]
- 18.Hagensen MK, Mortensen MB, Kjolby M, Palmfeldt J, Bentzon JF, Gregersen S Increased retention of LDL from type 1 diabetic patients in atherosclerosis-prone areas of the murine arterial wall. Atherosclerosis. (2019) 286 156–162. [DOI] [PubMed] [Google Scholar]
- 19.Edwards IJ, Terry JG, Bell-Farrow AD, Cefalu WT Improved glucose control decreases the interaction of plasma low-density lipoproteins with arterial proteoglycans. Metabolism. (2002) 51 1223–1229. [DOI] [PubMed] [Google Scholar]
- 20.Mateu L, Avila EM, Camejo G, León V, Liscano N The structural stability of low-density lipoprotein. A kinetic X-ray scattering study of its interaction with arterial proteoglycans. Biochim. Biophys. Acta (1984) 795(3) 525–534. [DOI] [PubMed] [Google Scholar]
- 21.Camejo G, Hurt E, Wiklund O, Rosengren B, López F, Bondjers G Modifications of low-density lipoprotein induced by arterial proteoglycans and chondroitin-6-sulfate. Biochim. Biophys. Acta (1991) 1096(3) 253–261. [DOI] [PubMed] [Google Scholar]
- 22.Hurt-Camejo E, Camejo G, Rosengren B, López F, Ahlström C, Fager G, Bondjers G Effect of arterial proteoglycans and glycosaminoglycans on low density lipoprotein oxidation and its uptake by human macrophages and arterial smooth muscle cells. Arterioscler. Thromb (1992) 12(5) 569–583. [DOI] [PubMed] [Google Scholar]
- 23.Pentikäinen MO, Lehtonen EM, Oörni K, Lusa S, Somerharju P, Jauhiainen M, Kovanen PT Human arterial proteoglycans increase the rate of proteolytic fusion of low density lipoprotein particles. J. Biol. Chem (1997) 272(40) 25283–25288. [DOI] [PubMed] [Google Scholar]
- 24.Hakala JK, Oörni K, Ala-Korpela M, Kovanen PT Lipolytic modification of LDL by phospholipase A2 induces particle aggregation in the absence and fusion in the presence of heparin. Arterioscler. Thromb. Vasc. Biol (1999) 19(5) 1276–1283. [DOI] [PubMed] [Google Scholar]
- 25.Jayaraman S, Baveghems C, Chavez OR, Rivas-Urbina A, Sánchez-Quesada JL, Gursky O Effects of triacylglycerol on the structural remodeling of human plasma very low- and low-density lipoproteins. Biochim. Biophys. Acta Mol. Cell. Biol. Lipids (2019) 1864(7) 1061–1071. [DOI] [PMC free article] [PubMed] [Google Scholar]
- 26.Rull A, Jayaraman S, Gantz DL, Rivas-Urbina A, Pérez-Cuellar M, Ordóñez-Llanos J, Sánchez-Quesada JL, Gursky O Thermal stability of human plasma electronegative low-density lipoprotein: A paradoxical behavior of low-density lipoprotein aggregation. Biochim. Biophys. Acta (2016) 1861(9 Pt A) 1015–1024. [DOI] [PMC free article] [PubMed] [Google Scholar]
- 27.Lu M, Gantz DL, Herscovitz H, Gursky O Kinetic analysis of thermal stability of human low density lipoproteins: a model for LDL fusion in atherogenesis. J. Lipid Res (2012) 53(10) 2175–2185. [DOI] [PMC free article] [PubMed] [Google Scholar]
- 28.Jayaraman S, Gantz D, Gursky O Structural basis for thermal stability of human low-density lipoprotein. Biochemistry. (2005) 44(10) 3965–3971. [DOI] [PubMed] [Google Scholar]
- 29.Oörni K, Pentikäinen MO, Ala-Korpela M, Kovanen PT Aggregation, fusion, and vesicle formation of modified low density lipoprotein particles: molecular mechanisms and effects on matrix interactions. J. Lipid Res (2000) 41(11) 1703–1714. [PubMed] [Google Scholar]
- 30.Ruuth M, Nguyen SD, Vihervaara T, Hilvo M, Laajala TD, Kondadi PK, Gisterå A, Lähteenmäki H, Kittilä T, Huusko J, Uusitupa M, Schwab U, Savolainen MJ, Sinisalo J, Lokki ML, Nieminen MS, Jula A, Perola M, Ylä-Herttula S, Rudel L, Öörni A, Baumann M, Baruch A, Laaksonen R, Ketelhuth DFJ, Aittokallio T, Jauhiainen M, Käkelä R, Borén J, Williams KJ, Kovanen PT, Öörni K Susceptibility of low-density lipoprotein particles to aggregate depends on particle lipidome, is modifiable, and associates with future cardiovascular deaths. Eur. Heart J (2018) 39(27) 2562–2573. [DOI] [PMC free article] [PubMed] [Google Scholar]
- 31.Jayaraman S, Gantz DL, Gursky O Effects of oxidation on the structure and stability of human low-density lipoprotein. Biochemistry. (2007) 46(19) 5790–5797. [DOI] [PubMed] [Google Scholar]
- 32.Maor I, Hayek T, Hirsh M, Iancu TC, Aviram M Macrophage-released proteoglycans enhance LDL aggregation: studies in aorta from apolipoprotein E-deficient mice. Atherosclerosis. (2000) 150(1) 91–101. [DOI] [PubMed] [Google Scholar]
- 33.Avogaro P, Bon GB, Cazzolato G Presence of a modified low density lipoprotein in humans. Arteriosclerosis. (1988) 8(1) 79–87. [PubMed] [Google Scholar]
- 34.Rivas-Urbina A, Rull A, Ordóñez-Llanos J, Sánchez-Quesada JL Electronegative LDL: An active player in atherogenesis or a by-product of atherosclerosis? Curr. Med. Chem (2019) 26(9) 1665–1679. [DOI] [PubMed] [Google Scholar]
- 35.Lu M, Gursky O Aggregation and fusion of low-density lipoproteins in vivo and in vitro. Biomol. Concepts (2013) 4(5) 501–518. [DOI] [PMC free article] [PubMed] [Google Scholar]
- 36.Pinchuk I, Lichtenberg D Prolongation of the lag time preceding peroxidation of serum lipids: a measure of antioxidant capacity. Methods Mol. Biol (2015) 1208 171–180. [DOI] [PubMed] [Google Scholar]
- 37.Jayaraman S, Gantz DL, Gursky O Effects of phospholipase A(2) and its products on structural stability of human LDL: relevance to formation of LDL-derived lipid droplets. J. Lipid Res (2011) 52(3) 549–557. [DOI] [PMC free article] [PubMed] [Google Scholar]
- 38.Steinberg D, Witztum JL Oxidized low-density lipoprotein and atherosclerosis. Arterioscler. Thromb. Vasc. Biol (2010) 30(12) 2311–2316. [DOI] [PubMed] [Google Scholar]
- 39.Oörni K, Pentikäinen MO, Annila A, Kovanen PT Oxidation of low density lipoprotein particles decreases their ability to bind to human aortic proteoglycans. Dependence on oxidative modification of the lysine residues. J. Biol. Chem (1997) 272(34) 21303–21311. [DOI] [PubMed] [Google Scholar]
- 40.Chang MY, Olin KL, Tsoi C, Wight TN, Chait A Human monocyte-derived macrophages secrete two forms of proteoglycan-macrophage colony-stimulating factor that differ in their ability to bind low density lipoproteins. J. Biol. Chem (1998) 273(26) 15985–15992. [DOI] [PubMed] [Google Scholar]
- 41.Bancells C, Benítez S, Jauhiainen M, Ordóñez-Llanos J, Kovanen PT, Villegas S, Sánchez-Quesada JL, Oörni K High binding affinity of electronegative LDL to human aortic proteoglycans depends on its aggregation level. J Lipid Res. (2009) 50(3) 446–455. [DOI] [PubMed] [Google Scholar]
- 42.Makoveichuk E, Lookene A, Olivecrona G Mild oxidation of lipoproteins increases their affinity for surfaces covered by heparan sulfate and lipoprotein lipase. Biochem. Biophys. Res. Commun (1998) 252(3) 703–710. [DOI] [PubMed] [Google Scholar]
- 43.Stirban A, Gawlowski T, Roden M Vascular effects of advanced glycation endproducts: Clinical effects and molecular mechanisms. Mol. Metab (2013) 3(2):94–108. [DOI] [PMC free article] [PubMed] [Google Scholar]
- 44.Soran H, Durrington PN Susceptibility of LDL and its subfractions to glycation. Curr. Opin. Lipidol (2011) 22(4) 254–261. [DOI] [PubMed] [Google Scholar]
- 45.Rabbani N, Godfrey L, Xue M, Shaheen F, Geoffrion M, Milne R, Thornalley PJ Glycation of LDL by methylglyoxal increases arterial atherogenicity: a possible contributor to increased risk of cardiovascular disease in diabetes. Diabetes. (2011) 60(7) 1973–1980. [DOI] [PMC free article] [PubMed] [Google Scholar]
- 46.Braschi S, Geoffrion M, Nguyen A, Gaudreau Y, Milne RW The expression of apolipoprotein B epitopes is normal in LDL of diabetic and end-stage renal disease patients. Diabetologia. (2006) 49(6) 1394–4101. [DOI] [PubMed] [Google Scholar]
- 47.Sánchez-Quesada JL, Vinagre I, De Juan-Franco E, Sánchez-Hernández J, Bonet-Marques R, Blanco-Vaca F, Ordóñez-Llanos J, Pérez A Impact of the LDL subfraction phenotype on Lp-PLA2 distribution, LDL modification and HDL composition in type 2 diabetes. Cardiovasc. Diabetol (2013) 12 112. [DOI] [PMC free article] [PubMed] [Google Scholar]
- 48.Benítez S, Pérez A, Sánchez-Quesada JL, Wagner AM, Rigla M, Arcelus R, Jorba O, Ordóñez-Llanos J Electronegative low-density lipoprotein subfraction from type 2 diabetic subjects is proatherogenic and unrelated to glycemic control. Diabetes Metab. Res. Rev (2007) 23(1) 26–34. [DOI] [PubMed] [Google Scholar]
- 49.Sánchez-Quesada JL, Benítez S, Pérez A, Wagner AM, Rigla M, Carreras G, Vila L, Camacho M, Arcelus R, Ordóñez-Llanos J The inflammatory properties of electronegative low-density lipoprotein from type 1 diabetic patients are related to increased platelet-activating factor acetylhydrolase activity. Diabetologia. (2005) 48(10) 2162–219. [DOI] [PubMed] [Google Scholar]
- 50.Noborn F, Ancsin JB, Ubhayasekera W, Kisilevsky R, Li JP Heparan sulfate dissociates serum amyloid A (SAA) from acute-phase high-density lipoprotein, promoting SAA aggregation. J. Biol. Chem (2012) 287(30) 25669–25677. [DOI] [PMC free article] [PubMed] [Google Scholar]
Associated Data
This section collects any data citations, data availability statements, or supplementary materials included in this article.