

Abstract
There is an urgent need for accurate non-invasive biomarkers for prostate cancer (PCa) diagnosis and disease risk stratification. Previous data suggests that total seminal plasma (SP) represents a source of miRNAs for screening. We have evaluated a panel of eight PCa-associated miRNAs for their potential use as PCa biomarkers in SP by analyzing their levels using RT-qPCR. Multivariate logistic regression modelling and clinical risk assessment were performed for those SP miRNAs statistically altered between PCa and non-PCa (HCt and/or BPH) groups. Our results provide evidence that altered miRNA expression in PCa tissue can also be detected in total SP. We obtained a clinically useful SP miRNA-based combined model (PSA+miR-142-3p+miR-223-3p+miR-93-5p), which improves PCa specificity of the PSA test, for, firstly, predicting the presence of malignant tumors in a sample from the total population and secondly, and more interestingly for clinicians, for predicting PCa in samples from the positive PSA screening test (PSA>4 ng/ml). Additionally, [PSA+miR-30d-5p+miR-93-5p] and [PSA+miR-30d-5p] models have been shown to be useful for predicting the disease aggressiveness with diagnostic accuracy. In conclusion, our results provide evidence that miRNAs in total SP represent a useful target for evaluation for PCa, which technically simplifies the future use of semen miRNA-based models as non-invasive biomarkers to increase the efficiency of PCa diagnosis and prognosis.
Keywords: Prostate cancer, miRNAs, seminal plasma, biomarker
Introduction
Prostate cancer (PCa) is the most common cancer diagnosed in men in Western countries [1]. The disease often has an indolent course, commonly presents a relatively slow tumor progression and is usually localized within the prostate [2]. However some men have PCa that is more likely to spread, so there is a need for an accurate early diagnosis and treatment [3] to prevent it spreading beyond the prostate.
PCa is diagnosed by biopsy, which is performed after indications of elevated serum prostate-specific antigen (PSA) levels in a screening test and/or suspicion after a physical examination of the prostate gland. The severity or degree of affectation is determined in the biopsy by means of the modified Gleason Score (GS) [4].
A significant decrease in deaths due to PCa has been associated with the use of the PSA screening test. However, considerable controversy has been raised over its value after recognizing that PSA testing, although specific for prostatic tissue, has low specificity for malignant prostate disease [5]. Additionally, PSA levels do not correlate with tumor aggressiveness, survival or response to pharmacological treatments. Altogether it has resulted in over-diagnosis and over-treatment of PCa. Thus, increased efforts are being made to identify accurate diagnostic and prognostic PCa biomarkers to efficiently discriminate between aggressive PCa tumors that need treatment and clinically insignificant tumors or benign prostatic diseases that do not require intervention but should undergo active surveillance.
MicroRNAs (miRNAs/miRs) comprise an abundant class of endogenous small non-coding RNAs (~22-nt) which are involved in the post-transcriptional regulation of genes, so they play a role in many important biological processes including cell proliferation, differentiation, apoptosis and carcinogenesis [6,7]. These small RNAs are released into the extracellular space in a stress-specific manner and are remarkably stable in most body fluids including not only blood plasma [8] but also saliva, tears, urine, breast milk, colostrum, peritoneal fluid, cerebrospinal fluid, bronchial lavage and seminal fluid [9], where they circulate in specific extracellular nuclease-resistant entities including extracellular vesicles and protein complexes. Consequently, miRNAs in human fluids have come to be considered as promising non-invasive diagnostic biomarkers.
Numerous miRNAs have been found to be deregulated when associated with the development and/or progression of PCa [10,11]. Studies have evidenced different tissue-miRNA profiles between men with localized PCa, men with metastatic disease, and BPH or normal control individuals [12,13]. MiRNAs for PCa have also been quantified in body fluids, such as plasma, serum and urine samples [14]. Recently, semen is emerging as a likely source of PCa-biomarkers due to an important characteristic of its origin; 40% of semen is derived from prostatic tissue. MiRNA detection in the cellular or vesicle fraction of semen has been performed either by pelleting prostatic cells present in the semen samples and isolating total RNA from this cellular fraction [15], or by isolating and extracting total RNA from small extracellular vesicles (exosomes) [16]. Both provide significant results suggesting that analysis of miRNAs in ejaculate can significantly improve the accuracy of PCa diagnosis. However, these approaches can be technically challenging.
The aim of the present study was to isolate miRNAs from the total seminal plasma (SP), the cell-free fraction of semen, and determine the potential of SP miRNA-based signatures for improving PCa diagnosis and/or prognosis, while considerably simplifying the technical use of miRNAs as non-invasive biomarkers in semen.
Materials and methods
Subjects of study
Patients and controls participating in the study were selected from men referred to the Urology Service of the Bellvitge Hospital and the Andrology Service of the Fundació Puigvert. The Institutional Review Board of both centers approved the study and all the participants signed an informed consent form.
Semen specimens were collected from 9 healthy individuals consulting for vasectomy (control group 1: HCt-noV), 5 healthy vasectomized individuals (HCt-V) and 29 individuals consulting for PCa diagnosis who presented moderately elevated PSA levels (4-18 ng/ml) with consent to undergo prostate biopsy. The latter group comprised: 24 men with biopsy-proven PCa including both vasectomized (PCa-V, n = 8) and non-vasectomized individuals (PCa-noV, n = 16); and additionally, 5 non-vasectomized individuals with benign prostatic hyperplasia (BPH) (control group 2) who presented PSA levels >4 ng/ml but no detectable cancer on biopsy (Tables 1, S1).
Table 1.
Clinical details of individuals included in this study
| Variable | HCt-noV | HCt-V | BPH | PCa-noV | PCa-V |
|---|---|---|---|---|---|
| Total, n | 9 | 5 | 5 | 16 | 8 |
| Age, mean ± SD (years) | 40.8±2.38 | 39.2±1.92 | 59.2±5.31 | 58.9±4.93 | 58.6±9.08 |
| Pre-biopsy PSA (n) | |||||
| ≤10 (ng/ml) | 9 | 5 | 5 | 13 | 5 |
| >10 (ng/ml) | 0 | 0 | 0 | 3 | 3 |
| Pre-biopsy PSA, mean ± SD (ng/ml) | nd | nd | 5.27±0.68 | 7.59±3.60 | 8.35±4.77 |
| Gleason score-biopsy (n) | |||||
| 6 (3+3) | nd | nd | nd | 8 | 5 |
| 7 (3+4) | nd | nd | nd | 4 | 3 |
| 7 (4+3) | nd | nd | nd | 3 | 0 |
| 8 (4+4) | nd | nd | nd | 1 | 0 |
| Clinical stage (n) | |||||
| cT1c | nd | nd | nd | 11 | 3 |
| cT2a | nd | nd | nd | 0 | 1 |
| cT2c | nd | nd | nd | 3 | 3 |
| cT3a | nd | nd | nd | 2 | 1 |
HCt: healthy control group; BPH: benign prostate hyperplasia group; PCa-noV: prostate cancer from non-vasectomized individuals; PCa-V: prostate cancer from vasectomized individuals. Text in italics refers to healthy individuals that were not analyzed for PSA. In this case, PSA levels were inferred from PSA reference values of healthy men based on age [32].
Tissue biopsies, kindly ceded by the Fundació Puigvert and the Pathological Anatomy Service of Bellvitge Hospital, had been used and described previously [16].
Cell culture and reagents
The PC3 and DU145 androgen-insensitive PCa cell lines, the androgen-sensitive LNCaP cancer cell line and the RWPE1 normal prostate cell line were used. PC3 and DU145 were grown in RPMI-1640 + GlutaMAX (Gibco) supplemented with 10% fetal bovine serum (FBS), 100 U/ml penicillin, 100 µg/ml streptomycin, MEM non-essential aminoacids w/o L-glutamine and sodium pyruvate 1 mM (all from Gibco). LNCaP and RWPE1 were grown in RPMI-1640 medium modified to contain 2 mM L-glutamine, 25 mM HEPES, 2000 mg/L D-glucose and 2000 mg/L sodium bicarbonate (CULTEK) and 10% FBS.
Small RNA-containing total RNA isolation
Semen specimens were collected and SP samples were obtained by differential centrifugation steps as described before [16]. Small RNA-containing Total RNA was obtained from SP using the miRCURY RNA Isolation Kit-Cell and Plant (Exiqon; Denmark), whereas a mirVana miRNA Isolation Kit (Ambion) was used for frozen biopsies (-80°C) [16], and the miRNeasy kit (Qiagen) was used for cell lines and conditioned media. RNA was quantified by using the QUBIT fluorometer and the Quant-iT RNA Assay kit (Invitrogen; California, USA). All RNA samples presented an OD 260/280 nm ratio ≥1.7 when using a Nanodrop UV-Vis spectrophotometer (Thermo Fisher Scientific; Massachusetts, USA).
RT-qPCR analysis of miRNA candidates
Synthesis of first-stranded cDNA specific for miRNA and qPCR amplification were performed as previously described [16]. Eight PCa-associated miRNAs were selected due to their altered expression behavior in PCa tissue and/or fluids from PCa patients (Table S2) [12,13,15-27] and individual assays (LNA™-enhanced miRNA qPCR primers; Table S3) were used for their qPCR amplification. Target miRNA expression in semen samples was calculated relative to the expression value of miR-30e-3p which shows a stable expression for all the samples in the study (CV: 0.030). The relative quantitative method of 2dCp was used to calculate the relative quantification (RQ) miRNA expression values.
Statistical analysis
The non-parametric Kruskal-Wallis test was used to analyze the differences in clinical data and absolute expression levels of reference gene. The non-parametric Mann-Whitney U-test was used to evaluate differences in relative expression levels of selected miRNAs between groups. Receiver operating characteristic (ROC) curve analysis of the RQ values was used to distinguish the samples showing malignancy in the prostate. Accuracy was measured as the area under the ROC curve (AUC). The threshold value was determined by Youden’s index, calculated as sensitivity plus specificity-1. A multivariate binary logistic regression analysis (backward stepwise, conditional, method) was used for selection of the optimal combination of variables associated with the presence of PCa or with the aggressiveness of the disease. The binary logistic regression model provides the following estimation of the logit function:
Logit (p) = B0+B1X1+B2X2+…
Where p = P (presence of prostate cancer), Logit (p) = log (p/(1-p)) = log (odds), B = logOR and Xn = the expression values of the miRNAs. Therefore, if we use this estimated model as a prediction model, with the standard classification cutoff of 0.5, we would classify individuals with a positive Logit function estimation as “positive for PCa” and individuals with negative Logit function estimation as “negative for PCa”.
Statistical analyses were performed using the SPSS software version 15.0 (SPSS Inc.; IBM; IL, USA). A p-value ≤0.05 was considered significant.
Results
PCa-associated miRNAs show an aberrant expression in SP from individuals with malignant prostate tumor
The clinicopathological characteristics of patients are presented in Tables 1 and S1. Cases (PCa) and BPH controls were similar regarding age, whereas healthy controls (HCt) differed significantly in the age (P<0.001). Subjects in the PCa and BPH groups did not show significant differences in pre-biopsy PSA levels and most (23 out of 29 individuals: 79.3%) fall within the PSA diagnostic “grey zone” (4-10 ng/ml). A low to moderate severity of disease, or PCa in the early stages (GS 6 or 7), was identified in most cases (23 out of the 24 PCa individuals).
Our RT-qPCR results showed that the expression values of six out of the eight miRNAs [miR-142-3p (P = 0.001), miR-142-5p (P = 0.008), miR-223-3p (P = 0.002), miR-30d-5p (P<0.001), miR-342-3p (P = 0.025) and miR-93-5p (P = 0.005)] were statistically different between PCa and HCt groups in SP (Figure 1). No difference in expression was found between HCt-noV and HCt-V, or between CaP-noV and CaP-V with the exception of miR-30a-5p (P = 0.038) suggesting that seven out of the eight PCa-associated miRNAs in SP does not originate primarily from testis/epididymis. Interestingly, differences in expression were also found between HCt and BPH groups for miR-107 (P = 0.026), miR-142-3p (P = 0.014), miR-142-5p (P = 0.034), miR-223-3p (P = 0.019), miR-30a-5p (P = 0.034), miR-30d-5p (P<0.001), miR-342-3p (P = 0.019).
Figure 1.
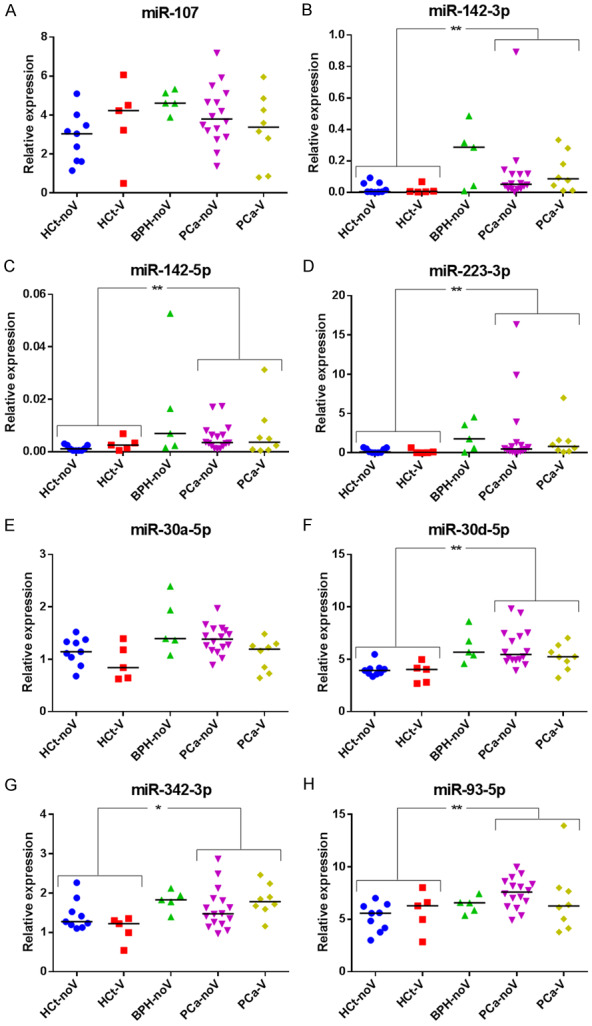
SP miRNA levels are altered in benign prostate hyperplasia and malignant prostate tumor. Expression profiling of the eight miRNAs ((A) miR-107, (B) miR-142-3p, (C) miR-142-5p, (D) miR-223-3p, (E) miR-30a-5p, (F) miR-30d-5p, (G) miR-342-3p, (H) miR-93-5p) in total seminal fluid of healthy controls-non vasectomized (HCt-noV), vasectomized healthy controls (HCt-V), benign prostate hyperplasia-non vasectomized (BPH-noV), prostate cancer-non vasectomized (PCa-noV) and prostate cancer from men successfully vasectomized (PCa-V) obtained by RT-qPCR amplification. Data are shown as RQ values, which were calculated using the 2dCp strategy and relative to the expression values of miR-30e-3p. The horizontal bar displays the median cellular expression level. Significant differences between groups are indicated: *P<0.05; **P<0.01 (Mann Whitney U test).
The expression values of four miRNAs (miR-142-3p, miR-223-3p, miR-30d-5p and miR-93-5p) in SP provided good and statistically significant predictive accuracy (AUC>0.684; P<0.05) to discriminate between the presence of a malignant tumor in the prostate (PCa group) and the absence of a tumor (HCt+BPH group) (Table 2). However, this predictive accuracy was inferior to PSA, with an AUC of 0.922 (P<0.001) which results in a sensitivity (Sn) of 91.7% and specificity (Sp) of 73.7% when used as a classifier for PCa in our study (Table 2; Figure S1A). To determine if a multiplex model could improve performance over single biomarkers for discriminating PCa from non-malignant samples, a multivariate logistic regression analysis was conducted for the four dysregulated miRNAs described above. It resulted in a model which included the miR-142-3p+miR-223-3p+miR-30d-5p+miR-93-5p expression values giving similar discriminative performance to PSA (AUC: 0.836, P<0.001) but in this case, the sensitivity and specificity for predicting the PCa samples were 79.2% and 57.9% respectively (Table 2; Figure S1B). Strikingly, when compared with PSA, a moderate increase in the value of specificity (Sn: 100% and Sp: 89.5%) was obtained when PSA+miR-142-3p+miR-223-3p+miR-93-5p were included in the model (AUC: 0.963, P<0.001) (Table 2; Figure S1C).
Table 2.
Performance of markers to distinguish (HCt+BPH) vs PCa
| Markers | AUC (p-value) | IC 95% | Sensitivity % | Specificity % | PPV % | NPV % |
|---|---|---|---|---|---|---|
| PSA | 0.922 (<0.001) | 0.841-1.004 | 91.7 | 73.7 | 81.5 | 87.5 |
| miR-107 | 0.523 (0.797) | 0.347-0.699 | 95.8 | 5.3 | 56.1 | 50.0 |
| miR-142-3p | 0.706 (0.022) | 0.536-0.876 | 100 | 0 | 55.8 | 0.0 |
| miR-142-5p | 0.652 (0.089) | 0.483-0.822 | 100 | 0 | 55.8 | 0.0 |
| miR-223-3p | 0.684 (0.040) | 0.518-0.851 | 83.3 | 52.6 | 69.0 | 71.4 |
| miR-30a-5p | 0.584 (0.346) | 0.408-0.761 | 95.8 | 15.8 | 59.0 | 75.0 |
| miR-30d-5p | 0.757 (0.004) | 0.605-0.908 | 83.3 | 68.4 | 76.9 | 76.5 |
| miR-342-3p | 0.626 (0.160) | 0.456-0.797 | 70.8 | 52.6 | 65.4 | 58.8 |
| miR-93-5p | 0.741 (0.007) | 0.594-0.888 | 79.2 | 52.6 | 67.9 | 66.7 |
| Combined miRNA-model (142-3p+223-3p+30d-5p+93-5p) | 0.836 (0.001) | 0.718-0.953 | 79.2 | 57.9 | 70.4 | 68.8 |
| Combined PSA_miRNA-model (PSA+142-3p+223-3p+93-5p) | 0.963 (0.001) | 0.898-1.028 | 100 | 89.5 | 92.3 | 100 |
Statistically significant AUC values (p≤0.05) are depicted in bold.
The regression analysis was also performed on results from samples from individuals who presented PSA levels ≥4 ng/ml in order to discriminate PCa from BPH individuals. In this case, although PSA levels present a high discriminatory capacity (AUC: 0.704), the difference turns out not to be statistically different (p = 0.157) so they are not able to accurately identify the PCa individuals (Table 3; Figure S1D). In contrast, the regression analysis of the four miRNAs resulted in a model that included miR-142-3p+miR-223-3p+miR-93-5p, providing Sn: 100% and Sp: 40%. (AUC: 0.783, P = 0.05) (Table 3; Figure S1E). When PSA and miRNA variables were introduced into the analysis it resulted in a model (PSA+miR-142-3p+miR-223-3p+miR-93-5p) with high prediction accuracy (AUC: 0.858, P = 0.013) and much more useful for diagnosis: sensitivity of 100% and specificity of 60% (Table 3; Figure S1F).
Table 3.
Performance of markers to distinguish BPH vs PCa
| Markers | AUC (p-value) | IC 95% | Sensitivity % | Specificity % | PPV % | NPV % |
|---|---|---|---|---|---|---|
| PSA | 0.704 (0.157) | 0.496-0.913 | 100 | 0 | 82.8 | 0 |
| miR-107 | 0.708 (0.149) | 0.522-0.894 | 100 | 0 | 82.8 | 0 |
| miR-142-3p | 0.633 (0.356) | 0.292-0.975 | 95.8 | 0 | 81.5 | 0 |
| miR-142-5p | 0.638 (0.341) | 0.349-0.926 | 100 | 20 | 85.7 | 100 |
| miR-223-3p | 0.617 (0.419) | 0.314-0.919 | 100 | 0 | 82.8 | 0 |
| miR-30a-5p | 0.683 (0.204) | 0.409-0.957 | 100 | 20 | 85.7 | 100 |
| miR-30d-5p | 0.592 (0.525) | 0.332-0.851 | 100 | 0 | 82.8 | 0 |
| miR-342-3p | 0.638 (0.341) | 0.413-0.862 | 100 | 0 | 82.8 | 0 |
| miR-93-5p | 0.338 (0.260) | 0.143-0.532 | 100 | 0 | 82.8 | 0 |
| Combined miRNA-model (142-3p+223-3p+93-5p) | 0.783 (0.05) | 0.570-0.997 | 100 | 40 | 88.9 | 100 |
| Combined PSA_miRNA-model (PSA+142-3p+223-3p+93-5p) | 0.858 (0.013) | 0.636-1.081 | 100 | 60 | 92.3 | 100 |
Statistically significant AUC values (p≤0.05) are depicted in bold.
Additionally, we studied the diagnostic accuracy of our previous SP exosome logistic model PSA+miR-142-3p+miR-142-5p+miR-223-3p 3p, -described as a useful predictive test to discriminate PCa from BPH with diagnostic accuracy (AUC: 0.821) [16], in samples of total SP. We obtained a similar AUC: 0.817; P = 0.028 with a Sn of 95.8% but a lower Sp (20% vs 42.9%), though it is still higher than the one obtained when PSA was used as a single biomarker, as described above. These three miRNAs were found to be over-expressed in both PCa tissue samples and SP exosomes [16] as well as in total SP as described above, although they presented different fold-changes in expression between total SP and extracellular vesicle fraction (Table S4).
SP miRNA levels are associated with the clinical risk/severity of the PCa disease
Additionally, the same type of analysis was performed in order to determine if a miRNA model could reflect the severity or degree of PCa affectation and thus, the prognosis of the disease.
Firstly, we found no difference in expression of miRNAs when PCa GS7 samples were compared with either PCa GS6 samples or BPH+GS6 PCa samples (P>0.05; data not shown). Additionally, our samples were clinically staged into prognostic groups (I, IIA, IIB, III) in accordance with the AJCC (American Joint Committee on Cancer) PCa staging system, which adds pre-treatment PSA and tumor Gleason grade to tumor-node-metastasis (TNM) classification [28]. Considering only the PCa samples under this prognostic classification for the analysis, miR-30d-5p (AUC: 0.743; P = 0.046) and miR-93-5p (AUC: 0.757; P = 0.035) proved to be able to discriminate between low risk tumors (I+IIA groups) and those with higher risk (IIB+III groups) (Figure 2) with similar results to those obtained when PSA was used (AUC: 0.836; P = 0.006) (Figure 3A). Strikingly again, an increased value of true positive and negative rates for predicting a higher degree of tumor affectation (80 and 85.7% respectively; AUC: 0.907, P = 0.001) was obtained when PSA+miR-30d-5p+miR-93-5p was included in the model (Figure 3B). These are much better Sn and Sp results than the ones obtained using single biomarkers: PSA (60 and 85.7%), miR-30d-5p (60 and 78.6%) or miR-93-5p (60 and 78.6%). When we analyzed the samples from individuals with PSA>4 ng/ml (including both BPH and PCa samples), we found that miR-30d-5p was able to discriminate the intermediate risk tumors (IIB+III groups) from BPH and low risk tumors (BPH+I+IIA groups) with a diagnostic accuracy (AUC: 0.742; P = 0.035), similar to the way PSA does (AUC: 0.847; P = 0.002). The analysis of both variables PSA+miR-30d-5p increased the Sn: 70 and Sp: 94.7% (AUC: 0.879; P = 0.001) of prediction over single variable (miR-30d-5p, Sn: 40% Sp: 100%; PSA, Sn: 60% Sp: 89.5%) (Figure 3A, 3C).
Figure 2.
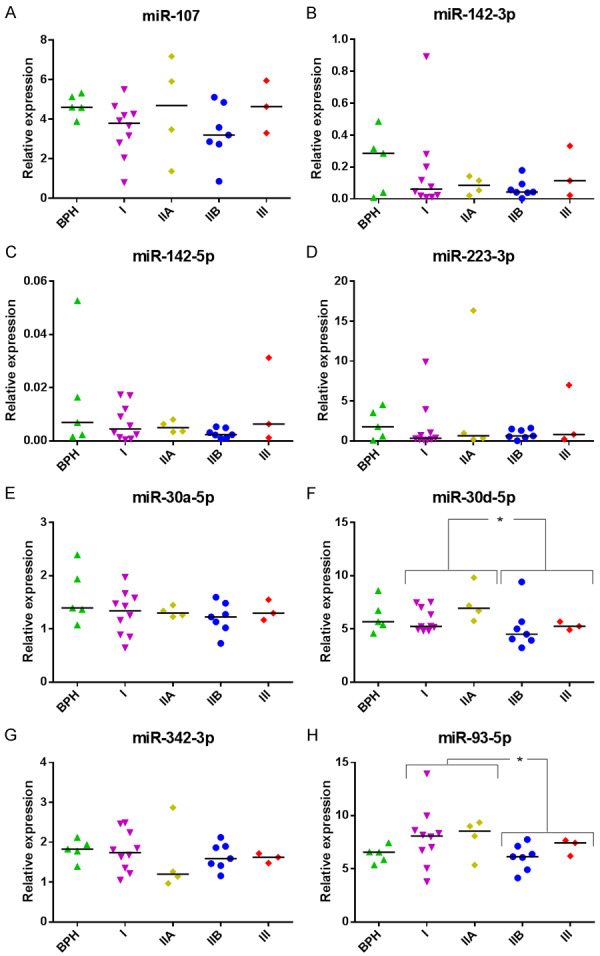
SP miRNA levels in clinically staged PCa samples by AJCC prognostic groups. Expression profiling of the miRNAs ((A) miR-107, (B) miR-142-3p, (C) miR-142-5p, (D) miR-223-3p, (E) miR-30a-5p, (F) miR-30d-5p, (G) miR-342-3p, (H) miR-93-5p) in total seminal fluid of benign prostate hyperplasia (BPH) and prostate cancer samples clinically staged into prognostic groups in accordance with the AJCC (American Joint Committee on Cancer) staging system for PCa: low risk tumors (I+IIA groups) and those with higher risk (IIB+III groups) obtained by RT-qPCR amplification. Data are shown as RQ values, which were calculated using the 2dCp strategy and relative to the expression values of miR-30e-3p. The horizontal bar displays the median cellular expression level. Significant differences between groups are indicated: *P<0.05; **P<0.01 (Mann Whitney U test).
Figure 3.
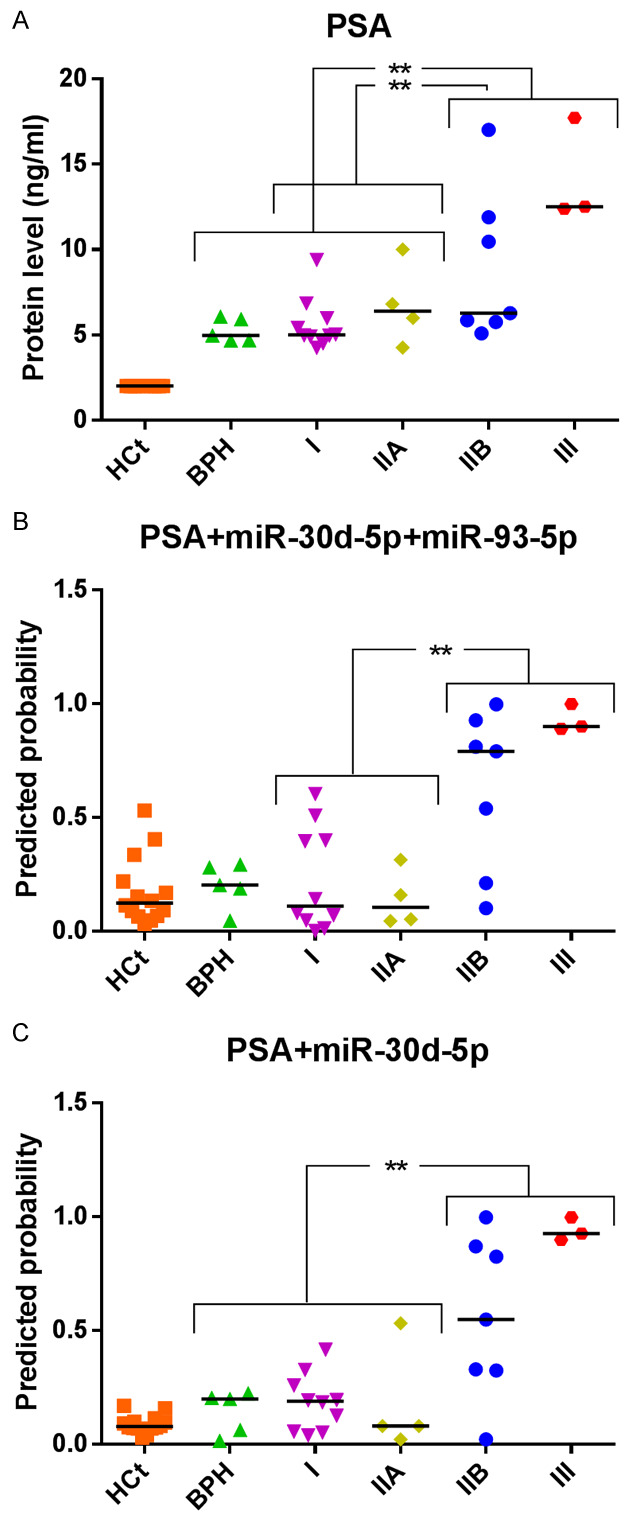
MiRNA-based models compared with PSA test as prognostic classifiers. Receiver operating characteristic (ROC) analysis showing the predictive efficiency for (A, B) distinguishing low risk tumors (I+IIA groups) and those with higher risk (IIB+III groups) and (A-C) discriminating the intermediate risk tumors (IIB+III groups) from BPH and low risk tumors (BPH+I+IIA groups), by using serum PSA (A) or the models obtained from the combination of PSA and miRNAs (B, C). The horizontal bar displays the median value. Significant differences between groups are indicated: *P<0.05; **P<0.01.
The expression of miR-30d-5p and miR-93-5p was tested in testis, epididymis, prostate, and lymphocytes, the latter as external control cells (Figure S2), in order to determine the miRNA expression level in the different organs that originate the seminal fluid. Both miRNAs are expressed in the three reproductive organs (testis, epididymis and prostate) and exhibit moderate overexpression levels in non-metastatic PCa tissue. In contrast, as is shown in Figure S3, both miRNAs were found to be downregulated in metastatic PCa cell lines and conditioned media compared with the RWPE1 non-carcinoma human prostate cell line, with the exception of miR-30d-5p in androgen-sensitive LNCaP conditioned media, which was found to be upregulated.
Discussion
There has been a great interest in developing minimally invasive methods to detect diagnostic and prognostic markers for PCa in recent years. Previous studies have provided evidence to support the use of miRNAs in semen to complement serum PSA for PCa diagnosis, either in the non-sperm cellular fraction of semen [15,29] or in isolated SP extracellular vesicles [16]. However, these approaches, which require the isolation of specific fluid fractions, can be technically challenging. In the present study, we chose total seminal fluid as a biological sample; this has the potential to technically simplify the use of miRNAs as semen biomarkers in the future.
Our results provide evidence that altered miRNA expression in PCa tissue can also be detected in total SP. In addition to this, comparative analyses of miRNA levels in SP between samples from healthy controls and PCa patients, malignant and non-malignant prostate disease, and also less aggressive and more aggressive disease indicate that SP miRNA-based models are likely to be useful PCa diagnostic or prognostic biomarkers. Notably, six out of the eight miRNAs analyzed in this study presented statistical differences between HCt and PCa samples. The performance of multivariate logistic regression analysis resulted in an SP miRNA-based combined model (PSA+miR-142-3p+miR-223-3p+miR-93-5p), which could be used as a clinically useful test with two objectives: firstly, for predicting the presence of a malignant tumor in a sample from the total population, which includes HCt+BPH+PCa samples; and secondly, and more interestingly for clinicians, for predicting the presence of a malignant tumor in patients who have tested moderately positive in the PSA screening (PSA 4-18 ng/ml), these include only BPH+PCa samples. The use of this combined model is suitable for clinical PCa diagnosis (AUC: 0.858), and it shows high sensitivity and specificity. The inclusion of this multiplex genetic test in the clinical protocol could successfully improve the non-invasive diagnosis of PCa, saving unnecessary biopsies for six out of ten BPH individuals who currently undergo the procedure, as PSA alone is not able to accurately discriminate PCa from BPH individuals.
A recent study by our group described a model including PSA+miR-142-3p+miR-142-5p+miR-223-3p which was identified as a useful PCa diagnostic biomarker in semen exosomes [16]. In the present study, we have found lower fold-change differences between tumor and non-tumor samples in the levels of these miRNAs in SP compared with those determined in semen exosomes. This might explain why the exosome predictive model shows less efficacy as a biomarker in total SP. That difference in expression between semen exosomes and SP is not unexpected if we bear in mind that miRNA integrity is robust even in degraded samples [30]; thus, in an analogous situation to that of DNA in biological fluids [31], we should expect not only cell-free miRNA actively secreted by cancer cells, but also miRNAs originated from either apoptotic and/or necrotic cells to be present in total SP.
Strikingly, our results also showed that the levels of several miRNAs in SP such as miR-30d-5p and miR-93-5p are associated with the prognosis of the disease: these miRNAs are moderately over-expressed in the early stages of the PCa disease process, whereas their expression diminishes as it progresses. The reduced levels of miR-30d-5p and miR-93-5p in SP at a later stage seem to be associated with tumors with a poorer prognosis.
In line with our results, previous studies in prostate have reported significantly reduced levels of miR-30d-5p in primary and metastatic castration-resistant PCa when compared with adjacent normal prostate samples [18,13], as well as a direct miR-30d-5p suppression of the androgen receptor (AR) in PCa [18], both of which agree with our observation of reduced SP miR-30-5p levels from higher risk PCa patients. Similarly, we found a reduced expression of miR-30d-5p in the three metastatic PCa cell lines tested and in the conditioned media of androgen-insensitive DU145 and PC3 metastatic cell lines. MiR-30d-5p inhibitor was reported to increase the level of AR protein, which is a determinant factor for the development of resistance for androgen deprivation therapy (ADT) in highly advanced and metastatic tumors. Furthermore, the up-regulation of miR-30d-5p significantly promotes cell apoptosis and reduces cell migration ability in PCa cell lines [13] as well as promoting tumor angiogenesis [17], which suggests that miR-30d-5p up-regulation and increased secretion in the early stages of the disease may have a role in tumor growth at the expense of regulating the migration and invasion of PCa cells. As the disease progresses, the level of miR-30d-5p decreases, thus contributing to tumor proliferation and migration. Altogether these studies support our conclusion that miR-30d-5p in SP can predict clinical prognosis in PCa.
Our results support the use of semen rather than other fluids, such as urine, as a source of miRNAs as PCa biomarkers. There is also an implied advantage in the fact that semen represents a liquid biopsy from the whole gland, as it comes from all parts of the prostate when prostate muscle contracts. However, if biomarkers for PCa are tested in urine collected after prostate massage, the sample only derives from the posterior part of the gland and thus may not represent the health of the whole prostate. The current non-invasive methods used for screening for PCa cannot effectively detect the disease in its early stages, indicate tumor aggressiveness or predict the course of the disease. Therefore, methods using the identification of PCa specific miRNAs that are released into the semen stream during the gradual progression of the disease could be key in obtaining the early diagnosis of PCa and would further contribute to predicting the course of the disease and treating it, so that patients could overcome it. Altogether, we provide good evidence that differentially expressed miRNAs in the semen are useful biomarkers for predicting PCa and the severity of the disease with diagnostic accuracy.
In conclusion, our results provide evidence that altered levels of miRNA expression in PCa tissue can be also detected in total seminal fluid. We chose a targeted approach in evaluating eight highly promising miRNAs as SP biomarkers of PCa risk. Clearly, there may be other known or as yet undiscovered miRNAs that may improve risk prediction, or may be more appropriate as markers of PCa prognosis and/or treatment response. Nevertheless, from our results a combined PSA+SP miRNA-based model would improve on PSA in detection of malignant disease in the prostate and avoid unnecessary biopsies (this being especially relevant in cases of men with moderately increased PSA levels). It would also provide a more accurate prognosis of the disease (improving discrimination between indolent cancers and more aggressive tumors) than is obtained from the cellular and/or exosomal fraction of semen, but using a much simpler technical procedure. Accordingly, this approach has the potential to both enhance the patient outcome and reduce the costs to the system. If it is confirmed by larger studies this method would represent a great improvement in diagnosis and treatment decision protocols for PCa clinical practice.
Acknowledgements
We are indebted to the individuals who participated in the study. We thank the staff of the Urology Service of Bellvitge Hospital and the staff of the Seminology and Embryology Laboratory at the Fundació Puigvert for providing seminal samples. The prostate cancer cells lines, PC3 and DU145, were kindly provided by Mireia Olivan, PhD (Research Institute of Vall d’Hebron Hospital, Barcelona, Spain), whereas the LNCaP cancer cell line and the RWPE1 normal prostate cell line were provided by Álvaro Aytés, PhD (Catalan Institute of Oncology ICO-IDIBELL, Hospitalet de Llobregat, Barcelona, Spain). We are also grateful to Harvey Evans for the revision of the English text. We thank CERCA Program/Generalitat de Catalunya for their institutional support. This work was financially supported by grants from the Instituto de Salud Carlos III [Grant number PI15/00153 and DTS18/00101; Co-funded by European Regional Development Fund. ERDF, a way to build Europe], the Generalitat de Catalunya [Grant number 2017SGR191]. S.L. is sponsored by the Researchers Consolidation Program (ISCIII SNS/Dpt. Salut Generalitat de Catalunya) [CES09/020].
Disclosure of conflict of interest
S.L., M.C. and F.V. hold a patent entitled ‘Seminal miRNAs as non-invasive biomarkers for the diagnosis and/or prognosis of prostate cancer’.
Supporting Information
References
- 1.Bray F, Ferlay J, Soerjomataram I, Siegel RL, Torre LA, Jemal A. Global cancer statistics 2018: GLOBOCAN estimates of incidence and mortality worldwide for 36 cancers in 185 countries. CA Cancer J Clin. 2018;68:394–424. doi: 10.3322/caac.21492. [DOI] [PubMed] [Google Scholar]
- 2.Gomella LG, Liu XS, Trabulsi EJ, Kelly WK, Myers R, Showalter T, Dicker A, Wender R. Screening for prostate cancer: the current evidence and guidelines controversy. Can J Urol. 2011;18:5875–5883. [PubMed] [Google Scholar]
- 3.Parker C. Active surveillance: towards a new paradigm in the management of early prostate cancer. Lancet Oncol. 2004;5:101–106. doi: 10.1016/S1470-2045(04)01384-1. [DOI] [PubMed] [Google Scholar]
- 4.Epstein JI, Egevad L, Amin MB, Delahunt B, Srigley JR, Humphrey PA Grading Committee. The 2014 International Society of Urological Pathology (ISUP) consensus conference on gleason grading of prostatic carcinoma: definition of grading patterns and proposal for a new grading system. Am J Surg Pathol. 2016;40:244–252. doi: 10.1097/PAS.0000000000000530. [DOI] [PubMed] [Google Scholar]
- 5.Oesterling JE. Prostate specific antigen: a critical assessment of the most useful tumor marker for adenocarcinoma of the prostate. J Urol. 1991;145:907–923. doi: 10.1016/s0022-5347(17)38491-4. [DOI] [PubMed] [Google Scholar]
- 6.He L, Hannon GJ. MicroRNAs: small RNAs with a big role in gene regulation. Nat Rev Genet. 2004;5:522–531. doi: 10.1038/nrg1379. [DOI] [PubMed] [Google Scholar]
- 7.Bartel DP. MicroRNAs: genomics, biogenesis, mechanism, and function. Cell. 2004;116:281–297. doi: 10.1016/s0092-8674(04)00045-5. [DOI] [PubMed] [Google Scholar]
- 8.Arroyo JD, Chevillet JR, Kroh EM, Ruf IK, Pritchard CC, Gibson DF, Mitchell PS, Bennett CF, Pogosova-Agadjanyan EL, Stirewalt DL, Tait JF, Tewari M. Argonaute2 complexes carry a population of circulating microRNAs independent of vesicles in human plasma. Proc Natl Acad Sci U S A. 2011;108:5003–5008. doi: 10.1073/pnas.1019055108. [DOI] [PMC free article] [PubMed] [Google Scholar]
- 9.Weber JA, Baxter DH, Zhang S, Huang DY, Huang KH, Lee MJ, Galas DJ, Wang K. The microRNA spectrum in 12 body fluids. Clin Chem. 2010;56:1733–1741. doi: 10.1373/clinchem.2010.147405. [DOI] [PMC free article] [PubMed] [Google Scholar]
- 10.Ozen M, Creighton CJ, Ozdemir M, Ittmann M. Widespread deregulation of microRNA expression in human prostate cancer. Oncogene. 2008;27:1788–1793. doi: 10.1038/sj.onc.1210809. [DOI] [PubMed] [Google Scholar]
- 11.Tong AW, Fulgham P, Jay C, Chen P, Khalil I, Liu S, Senzer N, Eklund AC, Han J, Nemunaitis J. MicroRNA profile analysis of human prostate cancers. Cancer Gene Ther. 2009;16:206–216. doi: 10.1038/cgt.2008.77. [DOI] [PubMed] [Google Scholar]
- 12.Kristensen H, Thomsen AR, Haldrup C, Dyrskjot L, Hoyer S, Borre M, Mouritzen P, Orntoft TF, Sorensen KD. Novel diagnostic and prognostic classifiers for prostate cancer identified by genome-wide microRNA profiling. Oncotarget. 2016;7:30760–30771. doi: 10.18632/oncotarget.8953. [DOI] [PMC free article] [PubMed] [Google Scholar]
- 13.Song Y, Song C, Yang S. Tumor-suppressive function of miR-30d-5p in prostate cancer cell proliferation and migration by targeting NT5E. Cancer Biother Radiopharm. 2018;33:203–211. doi: 10.1089/cbr.2018.2457. [DOI] [PubMed] [Google Scholar]
- 14.Sapre N, Selth LA. Circulating microRNAs as biomarkers of prostate cancer: the state of play. Prostate Cancer. 2013;2013:539680. doi: 10.1155/2013/539680. [DOI] [PMC free article] [PubMed] [Google Scholar]
- 15.Selth LA, Roberts MJ, Chow CW, Marshall VR, Doi SA, Vincent AD, Butler LM, Lavin MF, Tilley WD, Gardiner RA. Human seminal fluid as a source of prostate cancer-specific microRNA biomarkers. Endocr Relat Cancer. 2014;21:L17–21. doi: 10.1530/ERC-14-0234. [DOI] [PubMed] [Google Scholar]
- 16.Barcelo M, Castells M, Bassas L, Vigues F, Larriba S. Semen miRNAs contained in exosomes as non-invasive biomarkers for prostate cancer diagnosis. Sci Rep. 2019;9:13772. doi: 10.1038/s41598-019-50172-6. [DOI] [PMC free article] [PubMed] [Google Scholar]
- 17.Lin ZY, Chen G, Zhang YQ, He HC, Liang YX, Ye JH, Liang YK, Mo RJ, Lu JM, Zhuo YJ, Zheng Y, Jiang FN, Han ZD, Wu SL, Zhong WD, Wu CL. MicroRNA-30d promotes angiogenesis and tumor growth via MYPT1/c-JUN/VEGFA pathway and predicts aggressive outcome in prostate cancer. Mol Cancer. 2017;16:48. doi: 10.1186/s12943-017-0615-x. [DOI] [PMC free article] [PubMed] [Google Scholar] [Retracted]
- 18.Kumar B, Khaleghzadegan S, Mears B, Hatano K, Kudrolli TA, Chowdhury WH, Yeater DB, Ewing CM, Luo J, Isaacs WB, Marchionni L, Lupold SE. Identification of miR-30b-3p and miR-30d-5p as direct regulators of androgen receptor signaling in prostate cancer by complementary functional microRNA library screening. Oncotarget. 2016;7:72593–72607. doi: 10.18632/oncotarget.12241. [DOI] [PMC free article] [PubMed] [Google Scholar]
- 19.Volinia S, Calin GA, Liu CG, Ambs S, Cimmino A, Petrocca F, Visone R, Iorio M, Roldo C, Ferracin M, Prueitt RL, Yanaihara N, Lanza G, Scarpa A, Vecchione A, Negrini M, Harris CC, Croce CM. A microRNA expression signature of human solid tumors defines cancer gene targets. Proc Natl Acad Sci U S A. 2006;103:2257–2261. doi: 10.1073/pnas.0510565103. [DOI] [PMC free article] [PubMed] [Google Scholar]
- 20.Sun Y, Jia X, Hou L, Liu X. Screening of differently expressed miRNA and mRNA in prostate cancer by integrated analysis of transcription data. Urology. 2016;94:313, e311–316. doi: 10.1016/j.urology.2016.04.041. [DOI] [PubMed] [Google Scholar]
- 21.Moltzahn F, Olshen AB, Baehner L, Peek A, Fong L, Stoppler H, Simko J, Hilton JF, Carroll P, Blelloch R. Microfluidic-based multiplex qRT-PCR identifies diagnostic and prognostic microRNA signatures in the sera of prostate cancer patients. Cancer Res. 2011;71:550–560. doi: 10.1158/0008-5472.CAN-10-1229. [DOI] [PMC free article] [PubMed] [Google Scholar]
- 22.Wei Y, Yang J, Yi L, Wang Y, Dong Z, Liu Z, Ou-yang S, Wu H, Zhong Z, Yin Z, Zhou K, Gao Y, Yan B, Wang Z. MiR-223-3p targeting SEPT6 promotes the biological behavior of prostate cancer. Sci Rep. 2014;4:7546. doi: 10.1038/srep07546. [DOI] [PMC free article] [PubMed] [Google Scholar]
- 23.Bryant RJ, Pawlowski T, Catto JW, Marsden G, Vessella RL, Rhees B, Kuslich C, Visakorpi T, Hamdy FC. Changes in circulating microRNA levels associated with prostate cancer. Br J Cancer. 2012;106:768–774. doi: 10.1038/bjc.2011.595. [DOI] [PMC free article] [PubMed] [Google Scholar]
- 24.Zhou H, Wu G, Ma X, Xiao J, Yu G, Yang C, Xu N, Zhang B, Zhou J, Ye Z, Wang Z. Attenuation of TGFBR2 expression and tumour progression in prostate cancer involve diverse hypoxia-regulated pathways. J Exp Clin Cancer Res. 2018;37:89. doi: 10.1186/s13046-018-0764-9. [DOI] [PMC free article] [PubMed] [Google Scholar]
- 25.Ambs S, Prueitt RL, Yi M, Hudson RS, Howe TM, Petrocca F, Wallace TA, Liu CG, Volinia S, Calin GA, Yfantis HG, Stephens RM, Croce CM. Genomic profiling of microRNA and messenger RNA reveals deregulated microRNA expression in prostate cancer. Cancer Res. 2008;68:6162–6170. doi: 10.1158/0008-5472.CAN-08-0144. [DOI] [PMC free article] [PubMed] [Google Scholar]
- 26.Katz B, Reis ST, Viana NI, Morais DR, Moura CM, Dip N, Silva IA, Iscaife A, Srougi M, Leite KR. Comprehensive study of gene and microRNA expression related to epithelial-mesenchymal transition in prostate cancer. PLoS One. 2014;9:e113700. doi: 10.1371/journal.pone.0113700. [DOI] [PMC free article] [PubMed] [Google Scholar]
- 27.Kobayashi N, Uemura H, Nagahama K, Okudela K, Furuya M, Ino Y, Ito Y, Hirano H, Inayama Y, Aoki I, Nagashima Y, Kubota Y, Ishiguro H. Identification of miR-30d as a novel prognostic maker of prostate cancer. Oncotarget. 2012;3:1455–1471. doi: 10.18632/oncotarget.696. [DOI] [PMC free article] [PubMed] [Google Scholar]
- 28.Buyyounouski MK, Choyke PL, McKenney JK, Sartor O, Sandler HM, Amin MB, Kattan MW, Lin DW. Prostate cancer-major changes in the American Joint Committee on Cancer eighth edition cancer staging manual. CA Cancer J Clin. 2017;67:245–253. doi: 10.3322/caac.21391. [DOI] [PMC free article] [PubMed] [Google Scholar]
- 29.Roberts MJ, Chow CW, Schirra HJ, Richards R, Buck M, Selth LA, Doi SA, Samaratunga H, Perry-Keene J, Payton D, Yaxley J, Lavin MF, Gardiner RA. Diagnostic performance of expression of PCA3, Hepsin and miR biomarkers inejaculate in combination with serum PSA for the detection of prostate cancer. Prostate. 2015;75:539–549. doi: 10.1002/pros.22942. [DOI] [PubMed] [Google Scholar]
- 30.Jung M, Schaefer A, Steiner I, Kempkensteffen C, Stephan C, Erbersdobler A, Jung K. Robust microRNA stability in degraded RNA preparations from human tissue and cell samples. Clin Chem. 2010;56:998–1006. doi: 10.1373/clinchem.2009.141580. [DOI] [PubMed] [Google Scholar]
- 31.Ponti G, Maccaferri M, Mandrioli M, Manfredini M, Micali S, Cotugno M, Bianchi G, Ozben T, Pellacani G, Del Prete C, Tomasi A. Seminal cell-free DNA assessment as a novel prostate cancer biomarker. Pathol Oncol Res. 2018;24:941–945. doi: 10.1007/s12253-018-0416-6. [DOI] [PubMed] [Google Scholar]
- 32.Oesterling JE, Jacobsen SJ, Chute CG, Guess HA, Girman CJ, Panser LA, Lieber MM. Serum prostate-specific antigen in a community-based population of healthy men. Establishment of age-specific reference ranges. JAMA. 1993;270:860–864. [PubMed] [Google Scholar]
Associated Data
This section collects any data citations, data availability statements, or supplementary materials included in this article.