

Abstract
Bilirubin is a promising prognostic factor for non-liver disease-related deaths in various cancers. We investigated the association between preoperative serum bilirubin levels and oncological outcomes in patients with ovarian cancer. We retrospectively analyzed the clinical data of 282 patients with epithelial ovarian carcinoma (EOC), and grouped them according to optimal threshold values of total bilirubin (TBIL), direct bilirubin (DBIL), and indirect bilirubin (IBL) measured by receiver operating characteristic curve analysis. Univariate and multivariate Cox proportional hazards regression analyses were used to evaluate various parameters that might affect overall survival (OS) and progression-free survival (PFS) in patients with EOC. The optimal cutoff values for TBIL, DBIL, and IBIL levels were 9.65 µmol/L, 2.95 µmol/L, and 6.75 µmol/L, respectively. Increased TBIL, DBIL, and IBIL levels correlated with the serum carbohydrate antigen (CA)-125 levels, International Federation of Gynecology and Obstetrics stage, and pathological differentiation (all P<0.05). Univariate analysis revealed longer OS and PFS in patients with high TBIL (≥9.65 µmol/L) and IBIL (≥6.75 µmol/L) levels (P<0.05). Multivariate analysis showed that patients with high IBIL levels (≥6.75 µmol/L) had significantly longer OS and PFS than those with low IBIL levels (<6.75 µmol/L) [hazard ratio (HR) = 0.333, 95% confidence interval (CI): 0.123~0.904, P<0.05; HR = 1.814, 95% CI: 1.169~2.816, P<0.05]. Therefore, IBIL is a potential independent prognostic factor for OS and PFS in patients with EOC. The higher the IBL level, the better the prognosis of patients with EOC.
Keywords: Bilirubin, epithelial ovarian carcinoma, overall survival, progression-free survival, prognosis
Introduction
Ovarian cancer is the leading cause of death in patients with gynecologic malignancies [1]. Because of the insidious onset of ovarian cancer, early diagnosis is difficult, and most patients are diagnosed at the late stage. Metastases [International Federation of Gynecology and Obstetrics (FIGO) stage III-IV] occur in 70% of newly diagnosed patients with ovarian cancer. Advanced ovarian cancer has a high degree of malignancy, fast metastasis and invasion, easy recurrence of chemotherapy resistance, and a poor prognosis [2]. The 5-year survival rate of patients is only 25% [3]. Therefore, to guide surgery and evaluate follow-up treatment, it is necessary to explore the indexes that can predict the degree of ovarian cancer malignancy before surgery and analyze the prognosis. Factors influencing the prognosis of ovarian cancer include tumor intrinsic factors and host-related factors [4]. Identification of these factors may contribute to the assessment of ovarian cancer prognosis and development of individualized treatment to improve ovarian cancer survival. Compared with traditional prognostic indicators such as tumor size, tumor stage, and degree of differentiation, blood biochemical indicators are increasingly popular because they are easily obtained, non-invasive, and show high predictive efficacy [5].
Bilirubin, comprising direct bilirubin (20%) and indirect bilirubin (80%), is the end product of hemoglobin metabolism. It has long been used as a marker of lesions in the liver, gallbladder, and blood systems [6]. Interestingly, many experimental and clinical studies in recent years have demonstrated that bilirubin plays an important protective role in anti-inflammation, anti-oxidation, and anti-tumorigenesis. In different tumor models, such as those of the colon and adenocarcinoma, bilirubin can induce apoptosis and inhibit proliferation in vitro [7]. Serum bilirubin, as an endogenous antioxidant, increases moderately, improving the ability to scavenge oxidative free radicals in cancer patients [8]. Serum bilirubin as a prognostic marker in various malignant tumors has been explored, such as its relationship with the prognosis of non-small cell lung cancer [9], breast cancer [10], gastric cancer [11], and colorectal cancer [12]. However, the relationship between serum bilirubin levels and the prognosis of ovarian cancer patients has not yet been reported. Therefore, we intend to fill this gap by retrospectively analyzing the clinical data of 282 ovarian cancer patients.
Materials and methods
Study subjects
The clinical data of 282 patients with epithelial ovarian carcinoma (EOC) diagnosed by pathology, who had undergone prior surgical treatment at Suzhou Hospital affiliated to Nanjing Medical University from January 2007 to December 2018, were retrospectively collected. The inclusion criteria were as follows: (1) the patients with EOC had undergone initial treatment; (2) the postoperative histopathological diagnosis of the patient was clear; (3) the tumor site, diameter, pathological type, and depth of infiltration were all obtained by biopsy pathological examination; and (4) the histopathological report was read by two pathologists. The exclusion criteria were as follows: (1) the patient died during the perioperative period; (2) the patient had received radiation, chemotherapy, and other anti-tumor treatment preoperatively; (3) the patient had other tumors; (4) the patient had serious liver and kidney damage, autoimmune diseases, thrombosis, and bleeding diseases; (5) the patient had an infectious disease lasting almost 2 weeks; and (6) no liver function examination results were available at one week prior to surgery.
Case information
The following case information was collected: (1) general information such as the age of the patient at the time of disease onset, body mass index (BMI), menopause status, pregnancy history, delivery mode, number of abortions, cesarean section history, tubal ligation history, and preliminary symptoms (e.g., abdominal distension, abdominal pain, and irregular vaginal bleeding); (2) preoperative auxiliary examination of patients [CA125, human epididymis protein 4 (HE4), testing of total bilirubin (TBIL), direct bilirubin (DBIL), and indirect bilirubin (IBIL) levels, ultrasound, computed tomography (CT) or magnetic resonance imaging (MRI)]; (3) surgery and postoperative information, such as tumor size, location, ascites status, pelvic adhesion, postoperative residual lesion size, lymph node metastasis, FIGO staging (2015), tumor differentiation degree, endometrial lesion status, uterine fibroid status, chemotherapy, chemotherapy drug resistance, disease recurrence, and survival. Postoperative follow-up lasted for at least 5 years. Follow-up was conducted every 1-3 months for 2 years and then every 3-6 months for the subsequent 3 years. The diagnosis of recurrence was based on imaging examination (e.g., B ultrasound, CT, MRI, positron emission tomography-CT) to detect disease recurrence or metastatic lesions. The elevation of the levels of tumor markers (including serum carbohydrate antigen (CA) 125 and HE4) alone was not considered as a criterion for disease recurrence. Overall survival (OS) and progression-free survival (PFS) were included in the survival analysis. OS is the time from initial surgery to death or the last follow-up, and PFS is the time from initial surgery to tumor progression or recurrence.
Statistical analysis
SPSS 23.0 statistical software was used for data analysis. Enumeration data were expressed as rates (%), normal distribution measurement data were expressed as means ± standard deviation, and non-normal distribution measurement data were expressed as medians (interquartile interval). Chi-square test or Fisher’s exact test was used for enumeration data comparison, and the Mann-Whitney U test was used for measurement data comparison. The optimal cut-off points of age, tumor size, TBIL, DBIL, IBL, and CA125 were determined by receiver operating characteristic curve analysis. The Kaplan-Meier method was used for survival analysis. A P-value <0.05 indicated statistical significance. The survival curves were constructed using GraphPad Prism5 software.
Results
Basic information and clinicopathological characteristics of patients
The general information of onset age, body mass index (BMI), menopause, pregnancy, labor, abortion, cesarean section, tubal ligation, and the first symptoms such as abdominal distention, abdominal pain, and irregular vaginal bleeding are shown in Table 1. The median values of TBIL, DBIL and IBL were 9.90, 2.60 and 7.40 μmol/L, respectively (Table 1). The histopathological type of ovarian cancer: serous cancer was 169 cases, accounting for 59.93% of the total. 41.84% of them were early stage ovarian cancer (FIGO I-II), 58.16% were advanced stage ovarian cancer (FIGO III-IV) (Table 2).
Table 1.
Clinical and morphological characteristics of EOC patients
| Characteristics | No of patients (%) |
|---|---|
| Age (year) (median [IQR]) | 54 (47.75, 65.00) |
| BMI (kg/m2) | 21.56±2.46 |
| Menopause | |
| Pre- | 130 (46.10) |
| Post- | 152 (53.90) |
| Gravid | |
| 0 | 24 (8.51) |
| ≥8 | 258 (91.49) |
| Parity | |
| 0 | 26 (9.22) |
| ≥9 | 256 (90.78) |
| Induced abortion | |
| 0 | 144 (51.06) |
| ≥5 | 138 (48.94) |
| Cesarean section history | |
| Yes | 28 (9.93) |
| No | 254 (90.07) |
| Tube ligation history | |
| Yes | 16 (5.67) |
| No | 266 (94.33) |
| Breast cancer history | |
| Yes | 12 (4.26) |
| No | 270 (95.74) |
| Hypertension history | |
| Yes | 74 (26.24) |
| No | 208 (73.76) |
| Diabetic mellitus history | |
| Yes | 22 (7.80) |
| No | 260 (92.20) |
| Symptoms | |
| Bloating | |
| Yes | 130 (46.10) |
| No | 152 (53.90) |
| Abdominal paid | |
| Yes | 90 (31.91) |
| No | 192 (68.09) |
| Abnormal vaginal bleeding | |
| Yes | 22 (7.80) |
| No | 260 (92.20) |
| Cachexia | |
| Yes | 28 (9.93) |
| No | 254 (90.07) |
| Pre-surgery CA125 (U/mL) (median [IQR]) | 111.80 (49.53, 579.55) |
| Pre-surgery HE4 (pmol/L) (median [IQR]) | 67.00 (44.75, 324.50) |
| Pre-surgery TBIL (µmol/L) (median [IQR]) | 9.90 (7.80, 12.93) |
| Pre-surgery DBIL (µmol/L) (median [IQR]) | 2.60 (2.08, 3.50) |
| Pre-surgery IBL (µmol/L) (median [IQR]) | 7.40 (5.60, 9.20) |
Table 2.
The surgico-pathological characters and treatment-related variables of EOC patients
| Characteristics | No of patients (%) |
|---|---|
| Tumor size (mm) (median [IQR]) | 85 (50, 126) |
| Side of ovarian tumor | |
| Unilateral | 218 (77.30) |
| Bilateral | 64 (22.70) |
| Ascites | |
| Yes | 200 (70.92) |
| No | 82 (29.08) |
| Pelvic adhesion | |
| Yes | 40 (14.18) |
| No | 242 (85.82) |
| Residual disease | |
| No or ≤o cm | 244 (86.52) |
| >1 cm | 38 (13.48) |
| Metastasis of lymph node | |
| Yes | 194 (68.79) |
| No | 88 (31.21) |
| Histotype | |
| Serous | 169 (59.93) |
| Others | 113 (40.07) |
| FIGO Stage | |
| I | 108 (38.30) |
| II | 10 (3.55) |
| III | 120 (42.55) |
| IV | 44 (15.60) |
| Early or late Stage | |
| I+II | 118 (41.84) |
| III+IV | 164 (58.16) |
| Differentiation | |
| High | 24 (8.51) |
| Medium | 56 (19.86) |
| Low | 202 (71.63) |
| Endometrial disorders | |
| Endometrial polyp | 22 (7.80) |
| Endometrial cancer | 2 (0.71) |
| Myoma of uterus | 64 (22.70) |
| Cervical intraepithelial neoplasia | 4 (1.42) |
| Chemotherapy | |
| Yes | 180 (63.83) |
| No | 102 (36.17) |
| Chemo-resistance | |
| Yes | 106 (37.59) |
| No | 176 (62.41) |
Determination of the optimal interception point
According to the comparison of patients’ prognosis with the absolute value of TBIL, DBIL and IBIL, the Receiver Operating Characteristic (ROC) curve was drawn, respectively. When the TBIL was 9.65 µmol/L, the DBIL was 2.95 µmol/L and the IBIL was 6.75 µmol/L, reaching the maximum value of Youden’s index (0.233, 0.142 and 0.237). Therefore, the optimal cut-off points of TBIL, DBIL and IBIL were selected, and the area under ROC curve (AUC) was 0.572 (95% CI: 0.501~0.643, P-value <0.05), 0.453 (95% CI: 0.383~0.523, P-value = 186), 0.599 (95% CI: 0.530~0.667, P-value <0.05), respectively, with sensitivity of 0.618, 0.449 and 0.640. The specificity was 0.615, 0.692 and 0.596, respectively (Figure 1). Age, preoperative CA125 level and tumor size were selected according to the ROC curve to obtain the optimal interception point (65 years old, 124 U/mL and 9 cm) for the analysis of influencing factors of OS (Figure 1).
Figure 1.
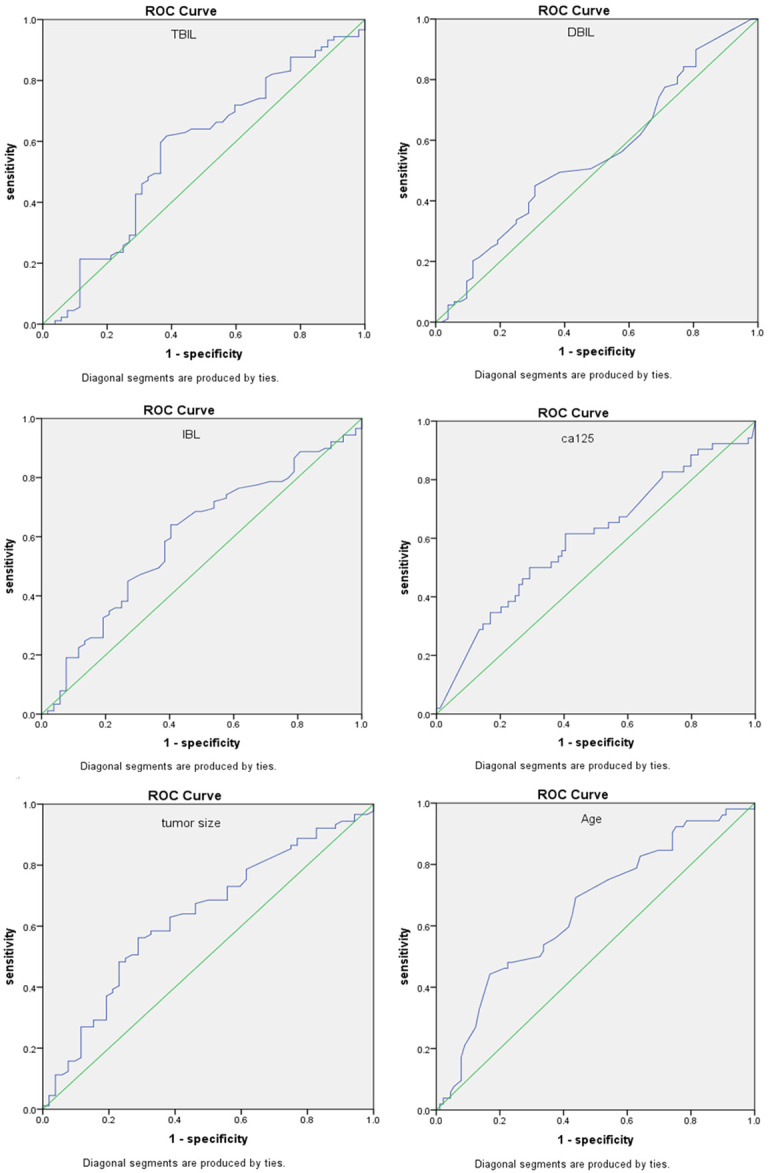
ROC curve to build a predictive model for risk of ovarian cancer. TBIL, IBL, DBIL, preoperative CA125 level, tumor size and age were selected according to the ROC curve to obtain the optimal interception point (9.65 µmol/L, 6.75 µmol/L, 2.95 µmol/L, 124 U/mL, 9 cm and 65 years old) for the analysis of influencing factors of OS.
Correlation between preoperative TBIL, DBIL and IBIL in patients with ovarian epithelial carcinoma and clinicopathological features
There were statistically significant differences in CA125 level, ascites, FIGO stage and pathological differentiation between the low TBIL level group (≤h.65 µmol/L) and the high TBIL level group (>9.65 µmol/L) (P-value <0.05) (Table 3). There were statistically significant differences in CA125 level, ascites, FIGO stage and pathological differentiation between the low DBIL level group (≤2.95 µmol/L) and the high DBIL level group (>2.95 µmol/L) (P-value <0.05) (Table 4). There were statistically significant differences in CA125 level, FIGO stage and pathological differentiation between patients with low IBIL level (cally µmol/L) and patients with high IBIL level (>6.75 µmol/L) (P-value <0.05) (Table 5).
Table 3.
Correlation between preoperative TBIL in patients with ovarian epithelial carcinoma and clinicopathological features
| Characteristics | TBIL (µmol/L) | P-value | |
|---|---|---|---|
|
| |||
| ≤valu (N = 132) | >9.65 (N = 150) | ||
| Age (year) (median [IQR]) | 54.0 (20.0) | 52.0 (17.0) | 0.398 |
| BMI (kg/m2) | 21.56±2.23 | 21.55±2.66 | 0.996 |
| Menopause | 0.839 | ||
| Pre- | 60 | 70 | |
| Post- | 72 | 80 | |
| Tube ligation history | 0.442 | ||
| Yes | 6 | 10 | |
| No | 126 | 140 | |
| Presurgery CA125 (U/mL) (median [IQR]) | 210.4 (553.7) | 78.0 (497.4) | 0.044 |
| Presurgery HE4 (pmol/L) (median [IQR]) | 67.4 (286.5) | 67.0 (333.0) | 0.817 |
| Tumor size (mm) (median [IQR]) | 77 (73) | 92 (79) | 0.527 |
| Ascites | 0.000 | ||
| Yes | 108 | 92 | |
| No | 24 | 58 | |
| Metastasis of lymph node | 0.411 | ||
| Yes | 94 | 100 | |
| No | 38 | 50 | |
| Hisotype | 0.317 | ||
| Serous | 75 | 94 | |
| Others | 57 | 56 | |
| FIGO Stage | 0.000 | ||
| I | 30 | 78 | |
| II | 4 | 6 | |
| III | 68 | 52 | |
| IV | 30 | 14 | |
| Early or late Stage | 0.000 | ||
| I+II | 34 | 84 | |
| III+IV | 98 | 66 | |
| Differentiation | 0.000 | ||
| High | 6 | 18 | |
| Medium | 12 | 44 | |
| Low | 114 | 88 | |
| Myoma of uterus | 0.090 | ||
| Yes | 24 | 40 | |
| No | 108 | 110 | |
| Chemotherapy | 0.000 | ||
| Yes | 100 | 80 | |
| No | 32 | 70 | |
| Chemo-resistance | 0.119 | ||
| Yes | 64 | 42 | |
| No | 36 | 38 | |
Table 4.
Correlation between preoperative DBIL in patients with ovarian epithelial carcinoma and clinicopathological features
| Characteristics | DBIL (µmol/L) | P-value | |
|---|---|---|---|
|
| |||
| ≤valu (N = 170) | >2.95 (N = 112) | ||
| Age (year) (median [IQR]) | 53.0 (18.5) | 55 (18.0) | 0.221 |
| BMI (kg/m2) | 21.66±2.32 | 21.40±2.78 | 0.404 |
| Menopause | 0.286 | ||
| Pre- | 74 | 56 | |
| Post- | 96 | 56 | |
| Tube ligation history | 0.055 | ||
| Yes | 6 | 10 | |
| No | 164 | 102 | |
| Presurgery CA125 (U/mL) (median [IQR]) | 213.5 (649.8) | 61.7 (311.3) | 0.004 |
| Presurgery HE4 (pmol/L) (median [IQR]) | 67.0 (252.2) | 75.7 (363.4) | 0.895 |
| Tumor size (mm) (median [IQR]) | 77 (74) | 97 (78) | 0.889 |
| Ascites | 0.000 | ||
| Yes | 136 | 64 | |
| No | 34 | 48 | |
| Metastasis of lymph node | 0.299 | ||
| Yes | 113 | 81 | |
| No | 57 | 31 | |
| Hisotype | 0.077 | ||
| Serous | 109 | 60 | |
| Others | 61 | 52 | |
| FIGO Stage | 0.006 | ||
| I | 55 | 53 | |
| II | 4 | 6 | |
| III | 86 | 34 | |
| IV | 25 | 19 | |
| Early or late Stage | 0.003 | ||
| I+II | 59 | 59 | |
| III+IV | 111 | 53 | |
| Differentiation | 0.000 | ||
| High | 5 | 19 | |
| Medium | 24 | 32 | |
| Low | 141 | 61 | |
| Myoma of uterus | |||
| Yes | 30 | 34 | |
| No | 140 | 78 | |
| Chemotherapy | 0.058 | ||
| Yes | 116 | 64 | |
| No | 54 | 48 | |
| Chemo-resistance | 0.103 | ||
| Yes | 76 | 34 | |
| No | 40 | 30 | |
Table 5.
Correlation between preoperative IBIL in patients with ovarian epithelial carcinoma and clinicopathological features
| Characteristics | IBL (µmol/L) | P-value | |
|---|---|---|---|
|
| |||
| ≤valu (N = 126) | >6.75 (N = 156) | ||
| Age (year) (median [IQR]) | 54.0 (21.0) | 52.0 (17.0) | 0.676 |
| BMI (kg/m2) | 21.73±2.25 | 21.42±2.62 | 0.288 |
| Menopause | 0.057 | ||
| Pre- | 66 | 64 | |
| Post- | 60 | 92 | |
| Tube ligation history | 0.170 | ||
| Yes | 4 | 12 | |
| No | 122 | 144 | |
| Presurgery CA125 (U/mL) (median [IQR]) | 207.2 (646.6) | 78.0 (483.5) | 0.043 |
| Presurgery HE4 (pmol/L) (median [IQR]) | 73.9 (281.0) | 61.0 (191.8) | 0.603 |
| Tumor size (mm) (median [IQR]) | 72 (76) | 92 (77) | 0.767 |
| Ascites | 0.866 | ||
| Yes | 90 | 110 | |
| No | 36 | 46 | |
| Metastasis of lymph node | 0.733 | ||
| Yes | 88 | 106 | |
| No | 38 | 50 | |
| Hisotype | 0.180 | ||
| Serous | 81 | 88 | |
| Others | 45 | 68 | |
| FIGO Stage | 0.000 | ||
| I | 31 | 77 | |
| II | 5 | 5 | |
| III | 64 | 56 | |
| IV | 26 | 18 | |
| Early or late Stage | 0.000 | ||
| I+II | 36 | 82 | |
| III+IV | 90 | 74 | |
| Differentiation | 0.000 | ||
| High | 7 | 17 | |
| Medium | 7 | 49 | |
| Low | 112 | 90 | |
| Myoma of uterus | 0.059 | ||
| Yes | 22 | 42 | |
| No | 104 | 114 | |
| Chemotherapy | 0.001 | ||
| Yes | 94 | 86 | |
| No | 32 | 70 | |
| Chemo-resistance | 0.423 | ||
| Yes | 58 | 48 | |
| No | 36 | 38 | |
Univariate and multivariate analysis of OS and PFS in patients with ovarian epithelial carcinoma
Univariate COX regression analysis of OS in patients with ovarian epithelial carcinoma showed that TBIL level (<9.65 vs s 5 vs µmol/L) and IBIL level (<6.75 vs s 5 vs µmol/L) were the influencing factors of OS (P-value <0.05). The difference in survival curve was statistically significant (P-value = 0.001, chi-square = 12.020; P-value = 0.002, chi-squared = 9.384) (Figure 2). In addition, menopause, tubal ligation, CA125 level (<124 vs ≥124 U/L), tumor size (<9 vs ≥9 cm), lymph node metastasis, FIGO stage, early and late stage of tumor, pathological differentiation, chemotherapy and chemotherapy resistance were all influencing factors of OS (P-value <0.05). Multivariate COX regression analysis showed that oviduct ligation, FIGO stage, chemotherapy, chemotherapy resistance and IBIL level (<6.75 vs s 5 vs µmol/L) were the influencing factors for OS in EOC patients, and the difference was statistically significant (HR = 2.685, 95% CI: 1.111~6.491, P-value <0.05; HR = 13.307, 95% CI: 5.890~30.062, P-value = 0.000; HR = 3.216, 95% CI: 1.089~9.498, P-value <0.05; HR = 4.801, 95% CI: 2.357~9.781, P-value = 0.000; HR = 0.333, 95% CI: 0.123~0.904, P-value <0.05) (Table 6).
Figure 2.
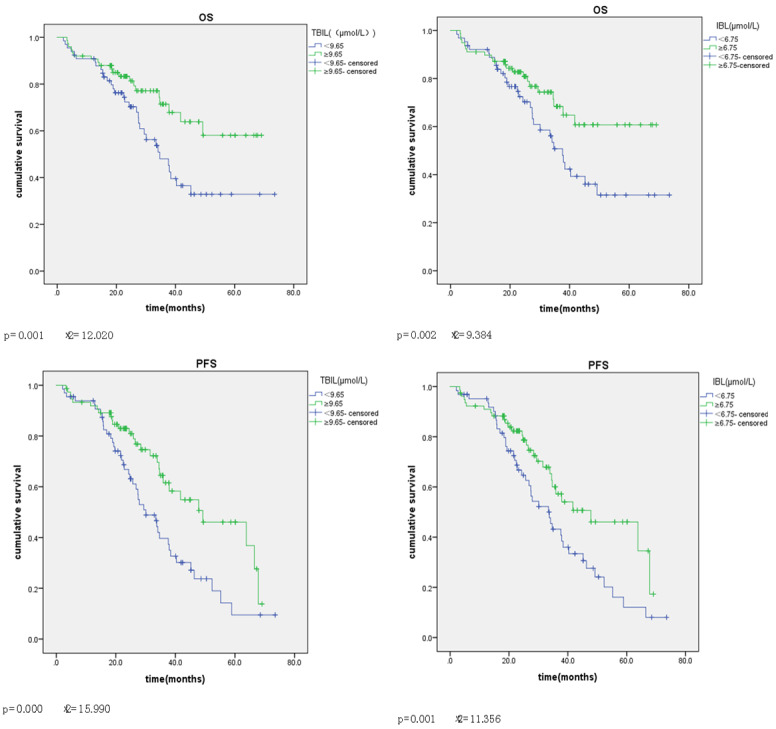
Univariate analysis of overall survival in EOC patients. Kaplan-Meier survival curves showing the effects of TBIL and IBL for OS and PFS. TBIL and IBL survival curves were statistically significant for OS (P-value = 0.001, chi-square = 12.020; P-value = 0.002, chi-squared = 9.384) and for PFS (P-value = 0.000, chi-squared = 15.990). P-value = 0.001, chi-squared = 11.356).
Table 6.
Univariate and multivariate analysis of potential prognostic factors for overall survival
| Variables | Univariate analysis | Multivariate analysis | ||||
|---|---|---|---|---|---|---|
|
|
|
|||||
| HR | 95% CI | P-value | HR | 95% CI | P-value | |
| Age (years) (<65 vs ≥65) | 0.864 | 0.556~1.342 | 0.515 | |||
| Menopause (yes vs no) | 2.417 | 1.600~3.650 | 0.000 | 1.235 | 0.699~2.182 | 0.467 |
| Tube ligation history (yes vs no) | 2.476 | 1.288~4.759 | 0.007 | 2.685 | 1.111~6.491 | 0.028 |
| Hypertension history (yes vs no) | 1.486 | 0.979~2.255 | 0.063 | |||
| Presurgery CA125 (U/mL) (<124 vs ≥124) | 1.839 | 1.238~2.732 | 0.003 | 0.568 | 0.299~1.080 | 0.084 |
| Tumor size (cm) (<9 vs ≥9) | 0.460 | 0.303~0.698 | 0.000 | 0.674 | 0.395~1.149 | 0.147 |
| Ascites (yes vs no) | 0.644 | 0.408~1.017 | 0.059 | |||
| Metastasis of lymph node (yes vs no) | 3.217 | 1.886~5.487 | 0.000 | 0.843 | 0.393~1.808 | 0.660 |
| FIGO Stage (I vs II vs III vs IV) | 3.702 | 2.769~4.949 | 0.000 | 13.307 | 5.890~30.062 | 0.000 |
| Early or late stage (I+I vs III+IV) | 10.783 | 5.585~20.820 | 0.000 | 0.280 | 0.055~1.423 | 0.125 |
| Differentiation (high vs medium vs low) | 5.978 | 3.059~11.682 | 0.000 | 0.367 | 0.128~1.055 | 0.063 |
| Chemotherapy (yes vs no) | 1.683 | 1.077~2.629 | 0.022 | 3.216 | 1.089~9.498 | 0.034 |
| Chemo-resistance (yes vs no) | 8.636 | 5.007~14.896 | 0.000 | 4.801 | 2.357~9.781 | 0.000 |
| TBIL (µmol/L) (<9.65 vs ≥9.65) | 0.548 | 0.370~0.811 | 0.003 | 0.577 | 0.305~1.090 | 0.090 |
| DBIL (µmol/L) (<2.95 vs ≥2.95) | 0.663 | 0.437~1.006 | 0.053 | |||
| IBL (µmol/L) (<6.75 vs ≥6.75) | 0.505 | 0.340~0.750 | 0.001 | 0.333 | 0.123~0.904 | 0.031 |
Univariate COX regression analysis of PFS in patients with ovarian epithelial carcinoma showed that all the other factors were influencing factors of PFS except age and DBIL level (<2.95 vs s 5 vs µmol/L) (P-value <0.05). TBIL and IBL survival curves were statistically significant (P-value = 0.000, chi-squared = 15.990; P-value = 0.001, chi-squared = 11.356) (Figure 2). Higher levels of TBIL and IBL had longer OS and PFS (Figure 2). Multivariate COX regression analysis showed that tubal ligation, FIGO stage, early and late stage of tumor, chemotherapy, chemotherapy resistance and IBIL level (<6.75 vs s 5 vs µmol/L) were the influencing factors of PFS in EOC patients, and the difference was statistically significant (HR = 2.940, 95% CI: 1.326~6.522, P-value <0.05; HR = 6.171, 95% CI: 3.339~11.406, P-value = 0.000; HR = 0.250, 95% CI: 0.083~0.755, P-value <0.05; HR = 3.296, 95% CI: 1.015~10.703, P-value <0.05; HR = 5.702, 95% CI: 3.169~10.259, P-value = 0.000; HR = 1.814, 95% CI: 1.169~2.816, P-value <0.05) (Table 7).
Table 7.
Univariate and multivariate analysis of potential prognostic factors for progress free survival
| Variables | Univariate analysis | Multivariate analysis | ||||
|---|---|---|---|---|---|---|
|
|
|
|||||
| HR | 95% CI | P-value | HR | 95% CI | P-value | |
| Age (years) (<65 vs ≥65) | 1.012 | 0.704~1.453 | 0.950 | |||
| Menopause (yes vs no) | 1.725 | 1.230~2.419 | 0.002 | 0.867 | 0.540~1.393 | 0.555 |
| Tube ligation history (yes vs no) | 2.341 | 1.291~4.244 | 0.005 | 2.940 | 1.326~6.522 | 0.008 |
| Hypertension history (yes vs no) | 1.623 | 1.139~2.313 | 0.007 | 1.220 | 0.774~1.923 | 0.391 |
| Presurgery CA125 (U/mL) (<124 vs ≥124) | 1.767 | 1.255~2.487 | 0.001 | 0.586 | 0.338~1.014 | 0.056 |
| Tumor size (mm) (<9 vs ≥9) | 0.659 | 0.466~0.932 | 0.018 | 0.925 | 0.604~1.417 | 0.720 |
| Ascites (yes vs no) | 0.671 | 0.456~0.988 | 0.043 | 1.054 | 0.643~1.728 | 0.834 |
| Metastasis of lymph node (yes vs no) | 2.738 | 1.793~4.182 | 0.000 | 0.872 | 0.479~1.588 | 0.654 |
| FIGO Stage (I vs II vs III vs IV) | 3.375 | 2.652~4.295 | 0.000 | 6.171 | 3.339~11.406 | 0.000 |
| Early or late stage (I+II vs III+IV) | 8.513 | 5.099~14.210 | 0.000 | 0.250 | 0.083~0.755 | 0.014 |
| Differentiation (high vs medium vs low) | 5.897 | 3.527~9.861 | 0.000 | 1.336 | 0.603~2.958 | 0.475 |
| Chemotherapy (yes vs no) | 2.925 | 1.893~4.519 | 0.000 | 3.296 | 1.015~10.703 | 0.047 |
| Chemo-resistance (yes vs no) | 7.295 | 4.788~11.113 | 0.000 | 5.702 | 3.169~10.259 | 0.000 |
| TBIL (µmol/L) (<9.65 vs ≥9.65) | 0.509 | 0.363~0.715 | 0.000 | 1.081 | 0.439~2.657 | 0.866 |
| DBIL (µmol/L) (<2.95 vs ≥2.95) | 0.702 | 0.493~1.001 | 0.050 | 1.199 | 0.676~2.128 | 0.535 |
| IBL (µmol/L) (<6.75 vs ≥6.75) | 0.567 | 0.405~0.795 | 0.001 | 1.814 | 1.169~2.816 | 0.008 |
Discussion
Numerous studies have shown that oxidative stress may be involved in affecting many tumor behaviors, including survival, proliferation, chemotherapy resistance, radiation resistance, angiogenesis, and distant metastasis [13]. Oxidative stress can activate many proteins, such as Ras, P13K/Akt, and ERK1/2 [14]. After activation, these proteins usually upregulate the expression and activity of matrix metalloproteinase (MMP) [15], further promoting tumor cell invasion and metastasis [16]. In vitro experiments have shown that bilirubin can inhibit the activation of ERK1/2 and expression of MMP-2, as well as damage the invasion ability of nasopharyngeal carcinoma cells [17]. In vivo studies in mice have shown that bilirubin inhibits the lung metastasis of nasopharyngeal carcinoma cells [18]. Bilirubin is not only associated with the occurrence and development of tumors, but also with the prognosis of patients with cancers such as lung cancer [19], breast cancer [20], colorectal cancer [21], and oral squamous cell carcinoma [22]. A case-control study assessed the correlation between antioxidant levels in the body and the risk of breast cancer and found that moderate increases in serum bilirubin levels were positively correlated with a reduced risk of breast cancer [20]. Data from the third National Health and Nutrition Examination Survey of the United States population showed that the serum bilirubin levels were negatively correlated with colon cancer risk [23]. The correlation between bilirubin levels and ovarian cancer prognosis is still lacking. In this study, patients with higher preoperative serum TBIL and IBL levels showed prolonged OS and PFS compared with those with lower preoperative TBIL and IBL levels.
The main source of bilirubin is hemoglobin released by aging or apoptotic red blood cells [24]. Heme first produces biliverdin, which produces IBL in the liver under the action of biliverdin reductase (BLVRA and BLVRB) [25]. Under the action of glucuronyltransferase, IBL combines with glucuronic acid to form DBIL, which is then excreted into the small intestine with bile [26]. Bilirubin can be transformed into biliverdin again by the oxidation of glutathione [27]. Studies have shown that biliverdin has strong antioxidant properties at the cellular level [28]. Even in the presence of highly oxidizing molecules such as nitrite, superoxide, and hydroxyl radicals, biliverdin can protect cellular macromolecular compounds such as lipids and proteins from oxidative stress [29]. The bilirubin-biliverdin redox cycle further proves that bilirubin has potential antioxidant activity [30]. In addition, bilirubin exists mainly in the body as a fat-soluble diacid, which can freely enter and leave the phospholipid membrane of body cells and function in antioxidation. Thus, bilirubin may play an important physiological role as an intracellular antioxidant [31].
Bilirubin and biliverdin play regulatory roles in many biological processes and are effective endogenous activators of aromatic hydrocarbon receptors [aryl hydrocarbon receptor (AhR)] [32]. AhR is a ligand-activated transcription factor that acts on various genes, including heme oxygenase (HMOX)-1, cytochrome P450 mono-oxygenase1A1/2 (CYP1A1/2), cytochrome P450 mono-oxygenase2A6 (CYP2A6), and uridine diphosphoglucuronosyl transferase1A1 (UGT1A1), and participates in the biotransformation and transport of bilirubin [33]. The AhR signaling pathway seems to have a broader impact because it is part of known complex networks such as cell cycle regulation, mitogen-activated protein kinase (MAPK) cascade activation, and nuclear factor-erythroid-2-like signals [encoded by NFE2L2 (also known as Nrf2)] [34]. These pathways induce a series of genes related to AhR/Nrf2 signaling [35]. Target genes include genes related to apoptosis, the T helper cell-mediated immune response, and cell proliferation and differentiation (vascular endothelial cells, smooth muscle cells, and macrophages) [36].
In addition to bilirubin production, BLVRA has several other important biological functions, including the unique multi-specific (serine/threonine/tyrosine) kinase activity, which contributes to cell signal transduction [25]. BLVRA and HMOX1 can translocate from the cytoplasm to the nucleus and activate various signaling pathways by oxidative stress, including those involved in survival, the stress response, Jak-Stat, transforming growth factor-β, activated B nuclear factor kappa light chain enhancer, and p38MAPK signaling, as well as regulation of the expression of HMOX itself and p38MAPK [37]. Biliverdin and BLVRA have also been shown to regulate protein kinase C, a serine/threonine kinase associated with carcinogenesis [38]. This complex network suggests that intracellular bilirubin should be considered part of an antioxidant cell system through which cells can regulate their function [39]. Therefore, it is reasonable to assume that each cell and/or tissue may have a different intracellular bilirubin threshold level, which may determine the level of protection against oxidation.
This study found that the increased level of serum bilirubin correlates with better prognosis in patients with EOC, but the effective bilirubin threshold level still needs to be determined using a multicenter, large-sample study. Thus, bilirubin is not only a metabolite but also plays an important physiological role as an intracellular antioxidant that can resist the immunosuppression of proto-presenting cells and T cells and inhibit adhesion molecule expression and immune cell migration. In addition, bilirubin has an extensive inhibitory effect on protein phosphorylation, resulting in the regulation of intracellular signal pathways, with significance in vascular and autoimmune pathology as well as cancer. Moreover, bilirubin has been shown to inhibit the proliferation of the neointima and vascular smooth muscle cells in vivo and in vitro. Furthermore, bilirubin can inhibit the growth of tumor cells and may induce apoptosis. These concepts shed new light on bilirubin metabolism and suggest the possibility of using bilirubin as a new tool for improving autoimmunity and treating cancer. As our understanding of bilirubin and related metabolic enzymes continues to increase, some scholars have suggested the use of the term “bilirubinomics” to describe this research field [40].
This study has important clinical application value. Preoperative liver function examination is a routine blood examination with low cost and little trauma. If applied in clinical practice, it can effectively minimize medical costs. Due to the limitation of objective conditions, this study has some drawbacks. First, this is a single-center study with a small number of cases included; thus, it is necessary to further expand the sample size in a follow-up study or carry out a multi-center study. Furthermore, no information on the history of alcohol consumption, coffee intake [41], and cigarette smoking [42] was collected in this study. Those factors may cause liver damage, which may affect serum bilirubin levels.
This study included 282 patients who had undergone prior ovarian cancer surgery and analyzed the clinical data on the age at the time of disease onset, BMI, menopause, pregnancy, labor, number of abortions, history of cesarean section, history of tubal ligation, and general information of initial symptoms (such as abdominal distension, abdominal pain, and irregular vaginal bleeding), surgical pathology, and long-term prognosis. Preoperative TBIL, DBIL, and IBL levels showed significant correlation with CA125 levels, the FIGO stage, and pathological differentiation among patients in the preoperative TBIL level group (>9.65 µmol/L vs ≤9.65 µmol/L), DBIL level group (>2.95 µmol/L vs ≤2.95 µmol/L), and IBIL level group (>6.75 µmol/L vs ≤s vs µmol/L). Survival curve analysis showed that patients with higher levels of TBIL and IBIL showed prolonged OS and PFS compared with those with lower levels. The preoperative TBIL and IBIL levels correlated with the prognosis of EOC. The preoperative IBIL levels were found to be independent prognostic factors for OS and PFS in patients with EOS.
Acknowledgements
This work was funded by The Science and Technology Development Foundation of Nanjing Medical University (No. NMUB2019334), Municipal hospital gynecological clinical trial and improvement Project of Suzhou (No. SLT201955), Municipal Science and Technology plan of Suzhou (No. ss201873).
Disclosure of conflict of interest
None.
References
- 1.White KM, Seale H, Harrison R. Enhancing ovarian cancer care: a systematic review of guideline adherence and clinical variation. BMC Public Health. 2019;19:296. doi: 10.1186/s12889-019-6633-4. [DOI] [PMC free article] [PubMed] [Google Scholar]
- 2.Kumar S, Long J, Kehoe S, Sundar S, Cummins C. Quality of life outcomes following surgery for advanced ovarian cancer: a systematic review and meta-analysis. Int J Gynecol Cancer. 2019;29:1285–1291. doi: 10.1136/ijgc-2018-000125. [DOI] [PubMed] [Google Scholar]
- 3.Canaz E, Grabowski JP, Richter R, Braicu EI, Chekerov R, Sehouli J. Survival and prognostic factors in patients with recurrent low-grade epithelial ovarian cancer: an analysis of five prospective phase II/III trials of NOGGO metadata base. Gynecol Oncol. 2019;154:539–546. doi: 10.1016/j.ygyno.2019.06.014. [DOI] [PubMed] [Google Scholar]
- 4.Christophersen MK, Hogdall C, Hogdall E. The prospect of discovering new biomarkers for ovarian cancer based on current knowledge of susceptibility loci and genetic variation (Review) Int J Mol Med. 2019;44:1599–1608. doi: 10.3892/ijmm.2019.4352. [DOI] [PubMed] [Google Scholar]
- 5.Kawakami E, Tabata J, Yanaihara N, Ishikawa T, Koseki K, Iida Y, Saito M, Komazaki H, Shapiro JS, Goto C, Akiyama Y, Saito R, Saito M, Takano H, Yamada K, Okamoto A. Application of artificial intelligence for preoperative diagnostic and prognostic prediction in epithelial ovarian cancer based on blood biomarkers. Clin Cancer Res. 2019;25:3006–3015. doi: 10.1158/1078-0432.CCR-18-3378. [DOI] [PubMed] [Google Scholar]
- 6.Feng L, Gu S, Wang P, Chen H, Chen Z, Meng Z, Liu L. Pretreatment values of bilirubin and albumin are not prognostic predictors in patients with advanced pancreatic cancer. Cancer Med. 2018;7:5943–5951. doi: 10.1002/cam4.1848. [DOI] [PMC free article] [PubMed] [Google Scholar]
- 7.Rao P, Suzuki R, Mizobuchi S, Yamaguchi T, Sasaguri S. Bilirubin exhibits a novel anti-cancer effect on human adenocarcinoma. Biochem Biophys Res Commun. 2006;342:1279–1283. doi: 10.1016/j.bbrc.2006.02.074. [DOI] [PubMed] [Google Scholar]
- 8.Vitek L. Role of bilirubin in the prevention of cardiovascular diseases and cancer. Cas Lek Cesk. 2016;155:10–14. [PubMed] [Google Scholar]
- 9.Jiang D, Shi J, Yuan M, Duan X, Li L, Li Q. Levels of serum bilirubin in small cell lung cancer and non-small cell lung cancer patients. Cell Mol Biol (Noisy-le-grand) 2018;64:71–76. [PubMed] [Google Scholar]
- 10.Liu X, Meng QH, Ye Y, Hildebrandt MA, Gu J, Wu X. Prognostic significance of pretreatment serum levels of albumin, LDH and total bilirubin in patients with non-metastatic breast cancer. Carcinogenesis. 2015;36:243–248. doi: 10.1093/carcin/bgu247. [DOI] [PubMed] [Google Scholar]
- 11.Sun H, He B, Nie Z, Pan Y, Lin K, Peng H, Xu T, Chen X, Hu X, Wu Z, Wu D, Wang S. A nomogram based on serum bilirubin and albumin levels predicts survival in gastric cancer patients. Oncotarget. 2017;8:41305–41318. doi: 10.18632/oncotarget.17181. [DOI] [PMC free article] [PubMed] [Google Scholar]
- 12.Gao C, Fang L, Li JT, Zhao HC. Significance and prognostic value of increased serum direct bilirubin level for lymph node metastasis in Chinese rectal cancer patients. World J Gastroenterol. 2016;22:2576–2584. doi: 10.3748/wjg.v22.i8.2576. [DOI] [PMC free article] [PubMed] [Google Scholar]
- 13.Radestad E, Klynning C, Stikvoort A, Mogensen O, Nava S, Magalhaes I, Uhlin M. Immune profiling and identification of prognostic immune-related risk factors in human ovarian cancer. Oncoimmunology. 2019;8:e1535730. doi: 10.1080/2162402X.2018.1535730. [DOI] [PMC free article] [PubMed] [Google Scholar]
- 14.Tell G, Gustincich S. Redox state, oxidative stress, and molecular mechanisms of protective and toxic effects of bilirubin on cells. Curr Pharm Des. 2009;15:2908–2914. doi: 10.2174/138161209789058174. [DOI] [PubMed] [Google Scholar]
- 15.Zeng L, Qian J, Zhu F, Wu F, Zhao H, Zhu H. The prognostic values of matrix metalloproteinases in ovarian cancer. J Int Med Res. 2020;48:300060519825983. doi: 10.1177/0300060519825983. [DOI] [PMC free article] [PubMed] [Google Scholar]
- 16.Gencer S, Cebeci A, Irmak-Yazicioglu MB. Matrix metalloproteinase gene expressions might be oxidative stress targets in gastric cancer cell lines. Chin J Cancer Res. 2013;25:322–333. doi: 10.3978/j.issn.1000-9604.2013.06.05. [DOI] [PMC free article] [PubMed] [Google Scholar]
- 17.Yao JJ, Kou J, Peng QH, Dong J, Zhang WJ, Lawrence WR, Zhang F, Zhou GQ, Wang SY, Sun Y. Prognostic value of serum bilirubin in southern Chinese patients with advanced nasopharyngeal carcinoma. Clin Chim Acta. 2018;484:314–319. doi: 10.1016/j.cca.2018.05.058. [DOI] [PubMed] [Google Scholar]
- 18.Deng CC, Xu M, Li J, Luo XL, Zhu YJ, Jiang R, Zhang MX, Lei JJ, Lian YF, Zou X, You R, Chen LZ, Feng QS, Bei JX, Chen MY, Zeng YX. Unconjugated bilirubin is a novel prognostic biomarker for nasopharyngeal carcinoma and inhibits its metastasis via antioxidation activity. Cancer Prev Res (Phila) 2016;9:180–188. doi: 10.1158/1940-6207.CAPR-15-0257. [DOI] [PubMed] [Google Scholar]
- 19.Song YJ, Gao XH, Hong YQ, Wang LX. Direct bilirubin levels are prognostic in non-small cell lung cancer. Oncotarget. 2018;9:892–900. doi: 10.18632/oncotarget.23184. [DOI] [PMC free article] [PubMed] [Google Scholar]
- 20.Xu P, Ling ZL, Zhang J, Li Y, Shu N, Zhong ZY, Chen Y, Di XY, Wang ZJ, Liu L, Liu XD. Unconjugated bilirubin elevation impairs the function and expression of breast cancer resistance protein (BCRP) at the blood-brain barrier in bile duct-ligated rats. Acta Pharmacol Sin. 2016;37:1129–1140. doi: 10.1038/aps.2016.25. [DOI] [PMC free article] [PubMed] [Google Scholar]
- 21.Yang L, Ge LY, Yu T, Liang Y, Yin Y, Chen H. The prognostic impact of serum bilirubin in stage IV colorectal cancer patients. J Clin Lab Anal. 2018;32:e22272. doi: 10.1002/jcla.22272. [DOI] [PMC free article] [PubMed] [Google Scholar]
- 22.Zhang H, Li G, Zhu Z, Zheng Y, Wu Y, Zhang W, Gu N, Wang X, Song X. Serum bilirubin level predicts postoperative overall survival in oral squamous cell carcinoma. J Oral Pathol Med. 2018;47:382–387. doi: 10.1111/jop.12693. [DOI] [PubMed] [Google Scholar]
- 23.Zucker SD, Horn PS, Sherman KE. Serum bilirubin levels in the U.S. population: gender effect and inverse correlation with colorectal cancer. Hepatology. 2004;40:827–835. doi: 10.1002/hep.20407. [DOI] [PubMed] [Google Scholar]
- 24.Adeosun SO, Moore KH, Lang DM, Nwaneri AC, Hinds TD Jr, Stec DE. A novel fluorescence-based assay for the measurement of biliverdin reductase activity. React Oxyg Species (Apex) 2018;5:35–45. doi: 10.20455/ros.2018.809. [DOI] [PMC free article] [PubMed] [Google Scholar]
- 25.Weaver L, Hamoud AR, Stec DE, Hinds TD Jr. Biliverdin reductase and bilirubin in hepatic disease. Am J Physiol Gastrointest Liver Physiol. 2018;314:G668–G676. doi: 10.1152/ajpgi.00026.2018. [DOI] [PMC free article] [PubMed] [Google Scholar]
- 26.Chiddarwar AS, D’Silva SZ, Colah RB, Ghosh K, Mukherjee MB. Genetic variations in bilirubin metabolism genes and their association with unconjugated hyperbilirubinemia in adults. Ann Hum Genet. 2017;81:11–19. doi: 10.1111/ahg.12179. [DOI] [PubMed] [Google Scholar]
- 27.Grant DJ, Bell DA. Bilirubin UDP-glucuronosyltransferase 1A1 gene polymorphisms: susceptibility to oxidative damage and cancer? Mol Carcinog. 2000;29:198–204. [PubMed] [Google Scholar]
- 28.Gordon DM, Adeosun SO, Ngwudike SI, Anderson CD, Hall JE, Hinds TD Jr, Stec DE. CRISPR Cas9-mediated deletion of biliverdin reductase A (BVRA) in mouse liver cells induces oxidative stress and lipid accumulation. Arch Biochem Biophys. 2019;672:108072. doi: 10.1016/j.abb.2019.108072. [DOI] [PMC free article] [PubMed] [Google Scholar]
- 29.Zhang Y, Ding Y, Lu T, Zhang Y, Xu N, McBride DW, Tang J, Zhang JH. Biliverdin reductase-A attenuated GMH-induced inflammatory response in the spleen by inhibiting toll-like receptor-4 through eNOS/NO pathway. J Neuroinflammation. 2018;15:118. doi: 10.1186/s12974-018-1155-z. [DOI] [PMC free article] [PubMed] [Google Scholar]
- 30.Konickova R, Vankova K, Vanikova J, Vanova K, Muchova L, Subhanova I, Zadinova M, Zelenka J, Dvorak A, Kolar M, Strnad H, Rimpelova S, Ruml T, J Wong R, Vitek L. Anti-cancer effects of blue-green alga Spirulina platensis, a natural source of bilirubin-like tetrapyrrolic compounds. Ann Hepatol. 2014;13:273–283. [PubMed] [Google Scholar]
- 31.Lee S, Lee Y, Kim H, Lee DY, Jon S. Bilirubin nanoparticle-assisted delivery of a small molecule-drug conjugate for targeted cancer therapy. Biomacromolecules. 2018;19:2270–2277. doi: 10.1021/acs.biomac.8b00189. [DOI] [PubMed] [Google Scholar]
- 32.Biagioli M, Carino A, Fiorucci C, Annunziato G, Marchiano S, Bordoni M, Roselli R, Giorgio CD, Castiglione F, Ricci P, Bruno A, Faccini A, Distrutti E, Baldoni M, Costantino G, Fiorucci S. The Aryl Hydrocarbon Receptor (AhR) mediates the counter-regulatory effects of pelargonidins in models of inflammation and metabolic dysfunctions. Nutrients. 2019;11:1820. doi: 10.3390/nu11081820. [DOI] [PMC free article] [PubMed] [Google Scholar]
- 33.Bock KW. Aryl hydrocarbon receptor (AHR): from selected human target genes and crosstalk with transcription factors to multiple AHR functions. Biochem Pharmacol. 2019;168:65–70. doi: 10.1016/j.bcp.2019.06.015. [DOI] [PubMed] [Google Scholar]
- 34.Neavin DR, Lee JH, Liu D, Ye Z, Li H, Wang L, Ordog T, Weinshilboum RM. Single Nucleotide polymorphisms at a distance from Aryl Hydrocarbon Receptor (AHR) binding sites influence AHR ligand-dependent gene expression. Drug Metab Dispos. 2019;47:983–994. doi: 10.1124/dmd.119.087312. [DOI] [PMC free article] [PubMed] [Google Scholar]
- 35.Molzer C, Wallner M, Kern C, Tosevska A, Zadnikar R, Doberer D, Marculescu R, Wagner KH. Characteristics of the heme catabolic pathway in mild unconjugated hyperbilirubinemia and their associations with inflammation and disease prevention. Sci Rep. 2017;7:755. doi: 10.1038/s41598-017-00933-y. [DOI] [PMC free article] [PubMed] [Google Scholar]
- 36.Safe S, Han H, Goldsby J, Mohankumar K, Chapkin RS. Aryl Hydrocarbon Receptor (AhR) ligands as selective AhR modulators: genomic studies. Curr Opin Toxicol. 2018;11-12:10–20. doi: 10.1016/j.cotox.2018.11.005. [DOI] [PMC free article] [PubMed] [Google Scholar]
- 37.Gao Y, Cao Z, Yang X, Abdelmegeed MA, Sun J, Chen S, Beger RD, Davis K, Salminen WF, Song BJ, Mendrick DL, Yu LR. Proteomic analysis of acetaminophen-induced hepatotoxicity and identification of heme oxygenase 1 as a potential plasma biomarker of liver injury. Proteomics Clin Appl. 2017;11 doi: 10.1002/prca.201600123. [DOI] [PMC free article] [PubMed] [Google Scholar]
- 38.Sugishima M, Wada K, Unno M, Fukuyama K. Bilin-metabolizing enzymes: site-specific reductions catalyzed by two different type of enzymes. Curr Opin Struct Biol. 2019;59:73–80. doi: 10.1016/j.sbi.2019.03.005. [DOI] [PubMed] [Google Scholar]
- 39.Gonzalez-Sanchez E, Perez MJ, Nytofte NS, Briz O, Monte MJ, Lozano E, Serrano MA, Marin JJG. Protective role of biliverdin against bile acid-induced oxidative stress in liver cells. Free Radic Biol Med. 2016;97:466–477. doi: 10.1016/j.freeradbiomed.2016.06.016. [DOI] [PubMed] [Google Scholar]
- 40.Mathew LG, Beattie NR, Pritchett C, Lanzilotta WN. New insight into the mechanism of anaerobic heme degradation. Biochemistry. 2019;58:4641–4654. doi: 10.1021/acs.biochem.9b00841. [DOI] [PMC free article] [PubMed] [Google Scholar]
- 41.Shafiei F, Salari-Moghaddam A, Milajerdi A, Larijani B, Esmaillzadeh A. Coffee and caffeine intake and risk of ovarian cancer: a systematic review and meta-analysis. Int J Gynecol Cancer. 2019;29:579–584. doi: 10.1136/ijgc-2018-000102. [DOI] [PubMed] [Google Scholar]
- 42.Zhou A, Minlikeeva AN, Khan S, Moysich KB. Association between cigarette smoking and histotype-specific epithelial ovarian cancer: a review of epidemiologic studies. Cancer Epidemiol Biomarkers Prev. 2019;28:1103–1116. doi: 10.1158/1055-9965.EPI-18-1214. [DOI] [PMC free article] [PubMed] [Google Scholar]