Abstract
Ribonuclease H2 subunit A (RNASEH2A), a member of the RNase HII family, acts in DNA replication by mediating removal of lagging-strand Okazaki fragment RNA primers. We explored the roles of RNASEH2A in the prognosis of breast cancer, specifically in relation to proliferation, invasiveness, and sensitivity to cytotoxins of cells in the estrogen receptor (ER)-positive MCF-7 and the ER-negative MDA-MB-231 breast cancer cell lines. We collected 26 datasets from around the world, comprising 7815 accessible cases. In these datasets, we probed the association between expression of RNASEH2A and clinical parameters, primarily by inhibiting the expression of RNASEH2A with siRNAs. Such inhibition inhibited the growth and invasiveness of MCF-7 cells. Independent and pooled Kaplan-Meier and Cox analyses revealed that RNASEH2A overexpression was associated with aggressiveness and poor outcomes in a dose-dependent manner in breast cancers of ER-positive subtypes, but not with ER-negative subtypes. The prognostic performance of RNASEH2A mRNA in ER-positive breast cancer was comparable to that for other gene signatures, such as the 21-gene recurrence score. Overexpression of RNASEH2A was also positively associated with cancer cell resistance to chemotherapy; inhibition of RNASEH2A by siRNA enhanced the chemosensitivity in an in vitro study. Bioinformatic analyses indicated that the ER may modulate RNASEH2A action in mitosis, DNA repair, and differentiation through transcriptional regulation. RNASEH2A may be a useful prognostic and predictive biomarker in ER-positive breast cancer and may serve as a therapeutic target for the treatment of ER-positive breast cancer.
Keywords: Ribonuclease H2 Subunit A (RNASEH2A), breast cancer, prognostic biomarker, chemoresistance, bioinformatics
Introduction
Breast cancer is the most common cancer in women and the leading cause of cancer-related deaths in women [1]. In the past decade, we have learned that breast cancer is a heterogeneous disease with molecular subtypes that can be distinguished by immunohistochemical staining for the presence of hormone receptors, specifically the estrogen receptor (ER), progesterone receptor (PR), and the human epidermal growth factor receptor-2 (HER2). The tumor grade is also an important factor for identifying tumor subtypes. Breast cancer subtypes determined by these criteria include luminal A, luminal B, HER2-positive, and basal-like subtypes [2]. The classification of molecular subtypes is important for the prediction of tumor metastasis, patient survival, and the selection of an appropriate therapeutic protocol [3].
The most common breast cancer subtype, representing 65% of breast cancers, is ER-positive. ER-positive tumors are currently the most curable breast cancer subtype [4]. At present, three types of endocrine therapies are used to treat ER-positive breast cancers: (i) selective estrogen receptor modulators that block estrogen access to the estrogen receptor, (ii) selective estrogen receptor down-regulators that downregulate the estrogen receptor, and (iii) aromatase inhibitors that inhibit the production of estrogen [5-7]. For ER-positive breast cancer, the use of additional chemotherapy is dictated by pathoclinical factors or prognostic gene signatures, such as the Oncotype DX Breast Recurrent Score [8].
Ribonuclease H2 subunit A (RNASEH2A) is in the eukaryotic subfamily of the RNase HII family. RNASEH2A mediates the removal of lagging-strand Okazaki fragment RNA primers during DNA replication [9] by endonucleolytically cleaving ribonucleotides. In this action, RNASEH2A requires cofactors magnesium or manganese. This enzyme of RNASEH2A also promotes cell proliferation in breast cancer, sarcoma, and glioma cell lines, implicating it in cancer progression [10]. Furthermore, a positive correlation between cancer aggressiveness and RNASEH2A expression was observed in prostate cancer [11]. At present, it is not known if the expression of RNASEH2A is associated with patient survivability in other cancer types.
In our present study, the clinical significance and prognostic value of RNASEH2A were evaluated using the Gene Expression Omnibus (GEO) and The Cancer Genome Atlas (TCGA) gene expression datasets, resulting in 7815 assessable breast cancer cases. The transcription factors and enriched gene signatures of RNASEH2A were analyzed. An in vitro experiment was performed to validate the role of RNASEH2A in the proliferation and invasion of breast cancer cells and its role in the chemoresistance of these cells.
Materials and methods
Cell culture
MCF-7 (ER-positive) and MDA-MB-231 (ER-negative) breast cancer cell lines were obtained from the Stem Cell Bank, Chinese Academy of Sciences. Authentication of these cell lines was certified by the provider. Aliquots were frozen and stored in the liquid nitrogen vapor phase. Cells were cultured for no longer than 6 months after thawing. Dulbecco’s Modified Eagle’s Medium (Hyclone, Logan, UT) was supplemented with 10% fetal bovine serum (Bovogen, Essendon, Australia), penicillin (Genom, Zhejiang, China), and streptomycin (Genom, Zhejiang, China). Cells were incubated at 37°C in 5% CO2. Adriamycin (Doxorubicin) was purchased from Selleckchem (Houston, TX, USA).
Small interfering RNA (siRNA) inhibition assay
Synthesized siRNA duplexes were provided by GenePharma (Shanghai, China). The siRNA sequence was designed to target RNASEH2A: (5’-GGUCUACGCCAUCUGUUAUTT-3’, si-RNASEH2A#1) and (5’-GGGUCAAAUACAACCUGAATT-3’, si-RNASEH2A#2). Cells were transfected with siRNA using siRNA-mate (GenePharma) according to the manufacturer’s instructions. The final concentration of siRNA was adjusted to 50 nM. Silencing was assessed 24 h after transfection. Total RNA was extracted from the cells with TRIzol reagent (Ambion, TX, US) according to the manufacturer’s instructions. For reverse transcription, 1 μg of total RNA from each sample was added to the reaction system.
Western blotting
Cells were collected 48 h after transfection and lysed in radioimmunoprecipitation assay (RIPA) buffer (1% NP-40, 150 mM sodium chloride, 0.1% sodium dodecyl sulfate, 0.5% sodium deoxycholate, and 50 mM Tris, pH 8.0). Protein was quantified via BSA assay (Beyotime Institute of Biotechnology, Jiangsu, China). A 10% denaturing polyacrylamide gel was used to separate proteins that were subsequently transferred to polyvinylidene difluoride membrane (Millipore, Billerica, MA). Membranes were probed with various primary antibodies, including actin (Beyotime Institute of Biotechnology, Shanghai, China), RNASEH2A (Santa Cruz, CA, USA), ERK, AKT, p-ERK, p-AKT, E-cadherin and Vimentin (Cell Signaling Technology, MA, USA) against proteins of interest.
In vitro invasion assay
To measure cancer cell invasiveness, the movement of cells through a synthetic extracellular matrix, specifically Matrigel (Becton, Dickinson, and Company, New Jersey, US) was analyzed. Approximately 2×10⁴ cells were seeded on the Matrigel inserts in a 24-well chamber. After incubation for 24 h, the Matrigel inserts were wiped with a cotton-tipped swab to remove cells that had not migrated through the membrane. The invasive cells on the lower surface of the membrane were visualized with crystal violet staining (Beyotime Institute of Biotechnology) and then counted. This test was performed in triplicate.
In vitro cell cytotoxicity and proliferation assay
To assess cytotoxicity and cell proliferation, we used a Cell Counting Kit-8 (CCK8; Bimake, Houston, TX, USA) following the manufacturer’s instructions. Cells (4×10³) were seeded in each well of a 96-well plate and treated with siRNA or drugs. After 72 h of treatment, 10 µL of CCK8 solution was placed in the culture wells, and plates were incubated for 1-4 h. The absorbance of each well was measured at 450 nm with a 96-well plate reader. The data were normalized to the OD450 of wells containing solution only.
In vitro MMP activation assay
5×10⁵ cells were seeded in each well of the 6-well plate and changed the serum-free culture medium for transfection the next day. After 24 h, we changed the serum-free culture and continue incubating. After 72 h, we collected the supernatant and concentrated it to 30 μl. Total proteins (10 μl of concentrated supernatant and 10 μl loading buffer) were electrophoresed with 8% non-denaturing SDS-page gel (20 mA/gel) containing MMP substrate protein. After rinsed with distilled water, stained with coomassie blue and took photos after washing.
Microarray data sets
The published gene expression data from human subjects with breast cancer were obtained from https://www.ncbi.nlm.nih.gov/geo/NIH/GEO, www.ebi.ac.uk/array express, or http://www.cbioportal.org/TCGA [12]. Twenty-six independent breast cancer microarray datasets were selected for the present study (Supplementary Table 1). Detailed information is presented in the supplementary table.
We normalized the mRNA expression levels for each dataset before pooled analysis. Participants were re-stratified into four categories (Q1, Q2, Q3, and Q4) based on the percentile of gene expression. Stratified RNASEH2A expression level datasets were then pooled into a new dataset for further analysis.
Study design
This study is a translational research project that includes bioinformatics analyses, in vitro cell culture experiments, and a population-based, retrospective outcome study. The overall survival (OS) was calculated as the time from initial surgery to the date the patient was last seen. The progression-free survival (PFS) was defined as the time from initial surgery until tumor recurrence, including local relapse and metastasis. Only deaths from metastasis and local relapsed breast cancer were considered as the end of the survival period.
Gene set enrichment analysis (GSEA)
GSEA analysis software v2.0.14x was downloaded from the Broad Institute Gene Set Enrichment Analysis website (https://www.gsea-msigdb.org/gsea/index.jsp). The protocol was based on previously published study protocols [13]. The GSE22220 dataset format with 216 cases was converted into a GSEA dataset after modification. The gene set database was downloaded from the Broad Institute of Massachusetts Institute of Technology. The current release of the Molecular Signatures Database (v6.2 MSigDB) contains 17,810 gene sets for use with GSEA. The phenotype label was based on RNASEH2A expression levels; the number of permutations was set to 1,000. The ranked-list metric was calculated and generated with a Pearson model.
Data management and statistical methods
The gene expression database was downloaded, converted, constructed, and managed using Microsoft-Excel. The JMP 10.0 software (SAS Institution, Cary, NC, USA) was used for further data analysis and statistical evaluation. Group comparisons for continuous data were performed using a t-test for independent means or one-way analysis of variance. Categorical variables were compared using Fisher’s exact test, χ2 analysis, or the binomial test of proportions. Cox proportional hazard and Kaplan-Meier analysis models were used to analyze OS and PFS. In PFS analysis, we excluded patients with distant metastatic breast cancer that was not completely resected. Multivariate Cox analysis was applied to adjust for covariate effects, and stratification analysis was used to reduce the confounding effect on the estimated hazard ratios. Missing data were coded and excluded from the analysis. Stata SE 15 (StataCorp LLC, USA) was used for meta-analysis.
Results
Inhibition of RNASEH2A reduced invasion ability in ER-positive breast cancer
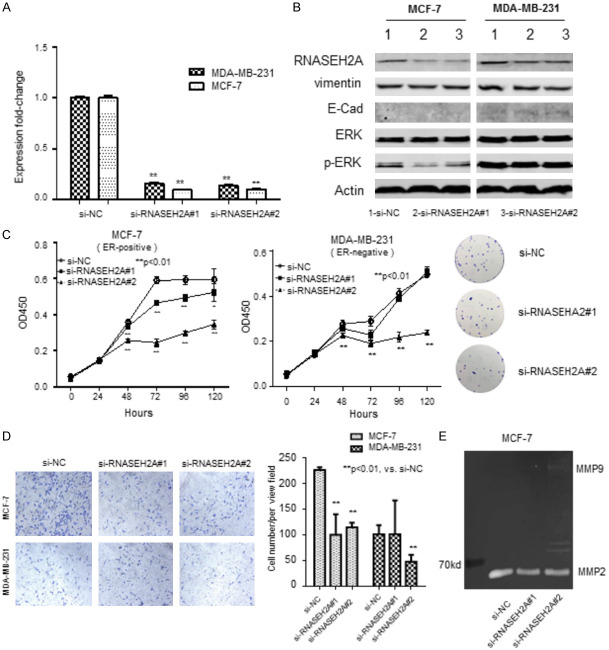
We conducted an in vitro experiment to identify the relationship between the expression of RNASEH2A and the aggressiveness of cancer. We assessed the effectiveness of the siRNAs (si-RNASEH2A#1 and siRNASEH2A#2). We performed quantitative PCR with cells transfected with the siRNAs. The amount of RNASEH2A mRNA was significantly reduced (P<0.01) by RNASEH2A siRNAs in both breast cancer cell lines, MCF-7 (ER-positive) and MDA-MB-231 (ER-negative) (Figure 1A). Subsequent western blots indicated that the amount of RNASEH2A protein in the cell lines transfected with either si-RNASEH2A was similarly significantly less than in the untransfected controls (Figure 1B). The levels of vimentin, ERK, p-ERK, and E-cadherin in transfected cells were similar to those in untransfected cells, with the following exceptions. Levels of p-ERK levels were slightly less in MCF-7 cells, and levels of E-cadherin, a valuable differentiation marker, were greater in MDA-MB-231 cells transfected with si-RNASEH2A#2.
Figure 1.
Characteristics of estrogen-receptor (ER)-positive breast cancer cell line MCF-7 and ER-negative breast cancer cell line MDA-MB-231 transfected with one of two RNASEH2A-specific siRNAs (si-RNASEH2A#1 or si-RNASEH2A#2). A. qRT-PCR assessment of RNASEH2A expression in transfected cells relative to untransfected cells. **, P<0.01. B. Western blots showing expression of RNASH2A, vimentin, E-cadherin, ERK, and p-ERK in transfected and untransfected cells. Actin served as the loading control. C. Cell proliferation as assessed by methylene blue staining. Optical density at 450 nm (OD450) represents the number of viable cells. **, P<0.01. *, P<0.05. D. Invasiveness of cells in a Matrigel membrane. Cells that migrated were stained with crystal violet staining solution and counted. **, P<0.01. *, P<0.05. E. Activation of matrix metalloproteinase (MMP) as determined with the gelatin zymography assay. ERK, extracellular signal-regulated kinase; pERK, phosphorylated ERK. Data represent the mean ± SE of the mean.
Cell proliferation of the two breast cancer lines were measured (Figure 1C). Proliferation of the transfected cells was significantly less than the control cells; this was apparent 24 h after transfection for MCF-7 cells and 24 h after transfection for MDA-MB-231 cells. An image showing typical colony formation of MCF-7 is shown in the panel to the right of Figure 1C. The colony formation assay visualized the inhibition efficiency of si-RNASEH2A in MCF-7 cells. We failed to show the colony formation results of MDA-MB-231 cells due to its weakness of adhesion ability.
The invasiveness of the transfected cells was also assessed. An image of the stained membrane is shown in the left panel of Figure 1D, and the counts are shown to the right. Invasiveness of both cell lines transfected with siRNASEH2A#2 was approximately 50% less than the control; however, si-RNASEH2A#1 only reduced the invasiveness of MCF-7 cells (approximately 50%; P<0.05 for all comparisons).
We measured the expression of matrix metallopeptidase 2 (MMP2), a promoter of tumor invasion [14], in transfected MCF-7 cells (Figure 1E). MMP2 expression was lower in the transfected cells than in the control cells. This is consistent with our observation that transfection decreased invasiveness. We conclude that inhibition of RNASEH2A by siRNA reduced both the growth and invasiveness of these two breast cancer cell lines, especially the ER-positive cell line MCF-7.
The expression of RNASEH2A correlates with the aggressive feature of ER-positive breast cancer
We compared the expression of RNASEH2A in normal breast tissue samples with breast tissue samples from patients with adenocarcinoma from the GSE3744 and GSE70947 datasets (Figure 2A). The expression of RNASEH2A was significantly upregulated in adenocarcinoma tissue. We divided the expression of RNASEH2A into two groups, high group and low group, according to the level and assessed the RNASEH2A-high mRNA expression level in the GSE25066 dataset (Figure 2B) and the TCGA dataset-2 (Figure 2C). These datasets are grouped according to cancer subtypes. In this analysis, the mean RNASEH2A mRNA expression was significantly higher (as determined by ANOVA) in the luminal B subtype, Her2-positive subtype, and basal-like subtype of these ER-positive breast cancers than in the normal tissues.
Figure 2.
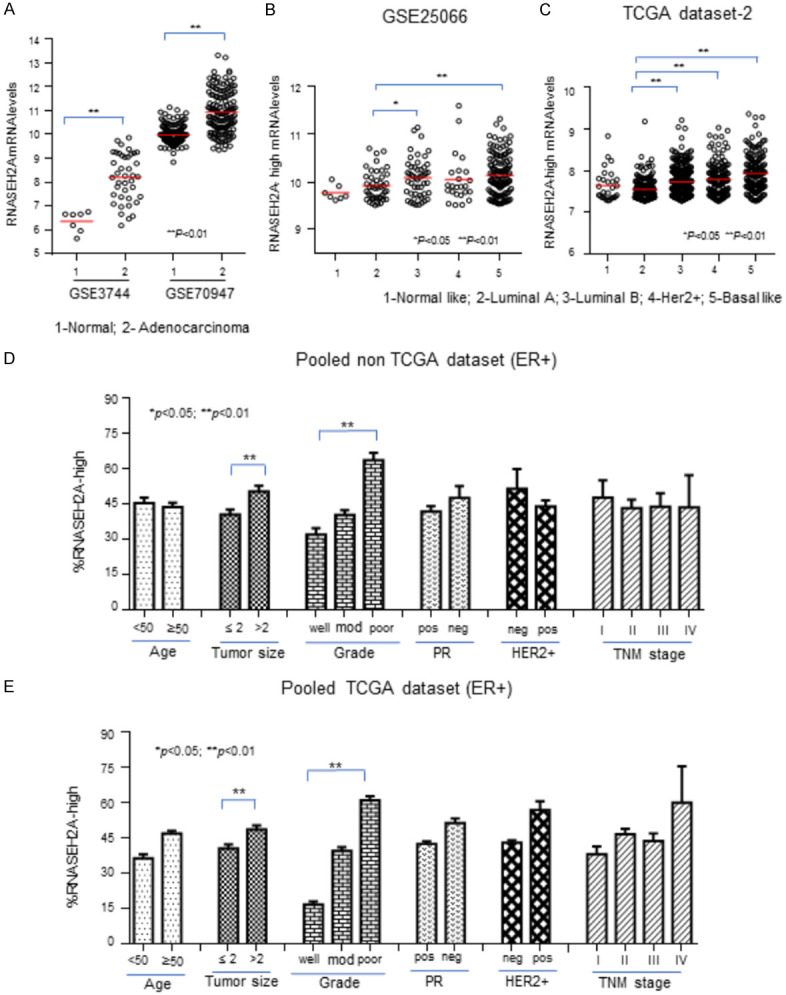
The clinical relevance of RNASEH2A in estrogen-receptor (ER)-positive breast cancer. A. RNASEH2A mRNA expression in normal breast tissues and breast adenocarcinoma tissues from the GSE3744 and GSE70947 datasets. B-E. Samples were grouped according to RNASEH2A mRNA expression levels; only data for the subgroup with the highest levels of RNASEH2A mRNA are presented. B and C. RNASEH2A mRNA levels associated with intrinsic molecular subtypes in the GSE25066 and TCGA datasets, respectively. D and E. Levels of RNASEH2A mRNA in subtypes determined by age, tumor size, Elson grade, presence of PR, HER2+ status, and TNM stages of breast cancer in pooled non-TCGA datasets and pooled TCGA datasets. PR; progesterone receptor; HER2+; human epidermal growth factor receptor 2-positive. Data represent the mean ± SE of the mean. **, P<0.01. *, P<0.05.
We pooled the non-TCGA dataset (Figure 2D). In the pooled analysis, the RNASEH2A mRNA expression level for the ER-positive subtypes was significantly (P<0.05) positively correlated with tumor size and negatively correlated with Elson grade (poor graded tumors had the highest expression), but there was no significant relationship between the parameters measured and expression in the pooled ER-negative subtypes (data not shown). We made similar observations when we pooled the TCGA dataset, shown in Figure 2E. Combining our experimental results, and this analysis suggests that RNASEH2A expression is an indicator of cancer aggressiveness, especially in ER-positive breast cancers.
Meta-analysis reveals the prognostic value of RNASEH2A in breast cancer
We conducted a meta-analysis based on Cox proportional analysis for RNASEH2A expression in each dataset (Figure 3A). The samples were re-categorized into two subgroups based on RNASEH2A expression: RNASEH2A-low and RNASEH2A-high. The hazard ratios (HRs) calculated for the low-expression group vs. the high-expression group for PFS reached statistical significance in 5 of 17 datasets. We suggest, based on the pooled analysis and the meta-analysis shown in Figure 3B and 3C, that RNASEH2A expression influences the PFS of breast cancer in an important way. PFS analyses of the pooled datasets showed that the RNASEH2A mRNA expression levels were positively and significantly associated with poor survival in a dose-dependent manner. In the funnel plot in Figure 3B, the standard error (SE) of the HRs for the 17 datasets is on the y-axis and their HRs were plotted on the x-axis to form a scatter plot. A sensitivity analysis showing meta-analysis estimates is presented in Figure 3C. In this figure, the HRs are presented for all but one dataset, and the data point is identified (on the y-axis) by the name of the omitted dataset. The results are considerably heterogeneous. Sensitivity analysis displayed the robustness of the pooled analysis. This meta-analysis indicates that overexpression of RNASEH2A is significantly associated with poor survivability of breast cancer patients.
Figure 3.
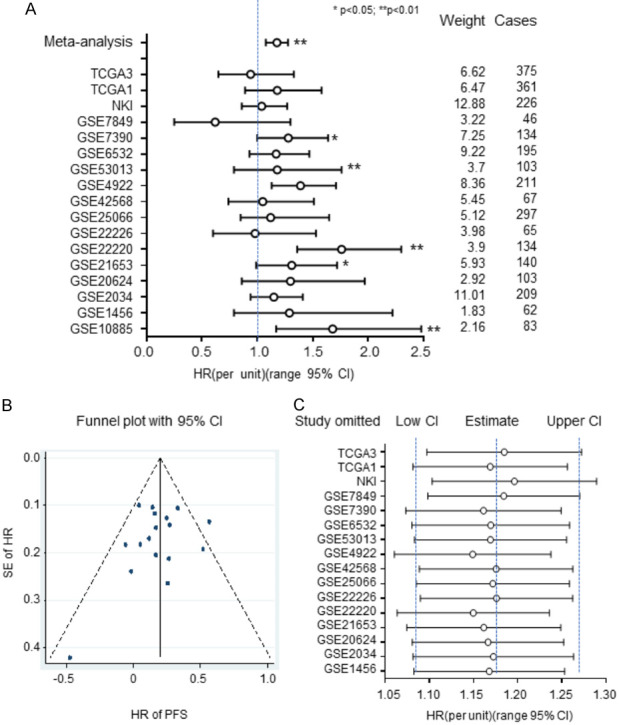
Results from a meta-analysis based on Cox proportional analysis for RNASEH2A expression for each dataset. Samples were re-categorized into two subgroups based on RNASEH2A expression: RNASEH2A-low and RNASEH2A-high. A. Hazard ratios of RNASEH2A for progression-free survival (PFS) were adjusted by pooled analysis and meta-analysis with the width defining the 95% CIs. B. Funnel plot for individual and pooled datasets. C. Sensitivity analysis for individual datasets. CI, confidence interval; HR, hazard ratio; PFS, progression-free survival; SE, standard error. Data represent the mean ± SE of the mean. **, P<0.01. *, P<0.05.
Stratification analysis validates the prognostic significance of RNASEH2A expression in ER-positive breast cancer
We next carried out an additional stratification analysis to reduce confounder effects. Using the pooled dataset, we performed a Kaplan-Meier analysis for OS in both ER-positive and ER-negative breast cancers (Figure 4A and 4B). We re-categorized RNASEH2A mRNA expression into four subgroups, Q1, Q2, Q3, and Q4, in order of increasing expression levels. The lowest expression subgroup, Q1, was set as the baseline for calculation of the HRs. The RNASEH2A mRNA expression levels were significantly associated with poor outcomes in a dose-dependent manner in the ER-positive breast cancers, but not in the ER-negative tumors. The prognostic value of RNASEH2A in ER-positive breast cancer patients was further evaluated in other subsets (Figure 4C). The results indicated that high expression levels of RNASEH2A are predictive of negative outcomes in ER-positive breast cancer patients regardless of the factors of age, tumor size, or lymph node involvement. However, the prognostic significance of RNASEH2A expression is better in tumors that have Elson grade 1 or 2 than for those in the grade 3 subgroup. Interestingly, RNASEH2A expression also has better prognostic values in participants from Asia and Europe rather than North America.
Figure 4.
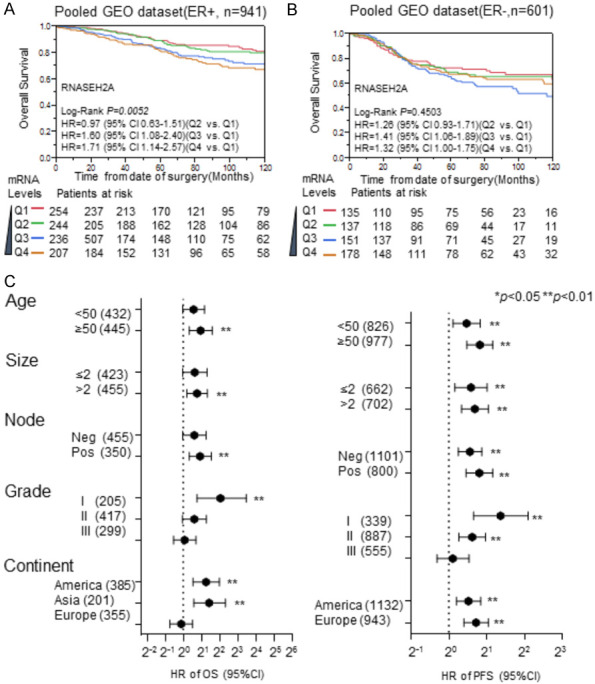
Stratification analysis for the prognostic value of RNASEH2A expression in subgroups of ER-positive breast cancer patients. A and B. Kaplan-Meier analysis of RNASEH2A expression impacts the overall survival of patients with estrogen-receptor (ER)-positive breast cancer and ER-negative breast cancer, respectively, in the pooled dataset. C. Stratification analysis for the prognostic significance of RNASEH2A expression in different breast cancer subtypes. The hazard ratios for progression-free survival and overall survival for RNASEH2A expression were determined using Cox proportional hazard analysis among different subgroups stratified by age, tumor size, lymph node involvement, and geographical origin of the dataset. HR, hazard ratio; PFS, progression-free survival; OS, overall survival; Q1, Q2, Q3, and Q4 indicate the level of RNASEH2A expression, with Q1 having the lowest expression. **, P<0.01. *, P<0.05.
The prognostic performance of RNASEH2A expression for ER-positive breast cancer was compared with other prognostic gene signatures, such as 70-genes [15], wound-response genes [16], the 21-gene recurrence score [8], Elson grade, and TNM staging [17]. In Cox analyses, the HR increased with RNASEH2A mRNA levels in a dose-dependent manner in the NKI dataset [18] (Figure 5A) and TCGA dataset-2 (Figure 5B). The prognostic performance of RNASEH2A was similar to the 70-genes, wound-response genes, and the 21-gene recurrence score in the NKI dataset (Figure 5A). It was also comparable to the 21-gene recurrence score in the TCGA dataset (Figure 5B). However, the prognostic performance of RNASEH2A expression and the gene signatures were more efficient than TNM stage in the NKI dataset but less efficient than the TNM stage in the TCGA dataset. Therefore, RNASEH2A expression is a promising prognostic indicator for ER-positive breast cancer patients.
Figure 5.
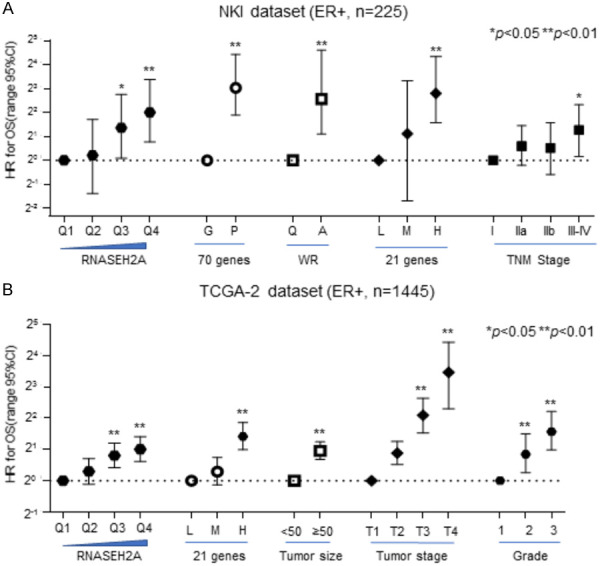
Cox analysis of several gene signatures and pathoclinical factors in ER-positive breast cancer was employed to compare prognostic performances. A. The NKI dataset. B. The TCGA dataset-2. HR, hazard ratio. Data represent the mean ± SE of the mean. **, P<0.01. *, P<0.05.
Estrogen receptor 1 (ESR1) is a potential transcription factor that targets RNASEH2A in breast cancer
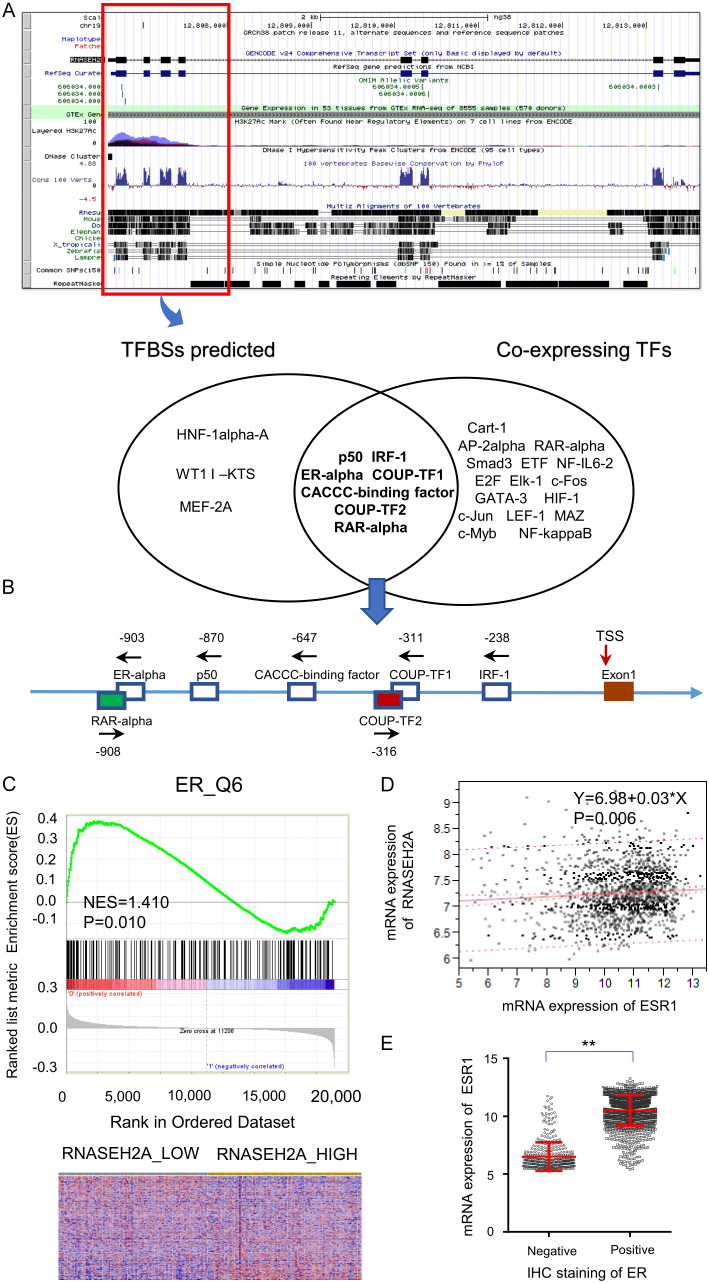
We investigated the mechanism of RNASEH2A on the invasiveness of ER-positive breast cancer. This inspired us to perform a bioinformatic analysis for predicting transcriptional regulation of RNASE2A. The identification of eligible transcription factors of RNASEH2A was based on a prediction of the UCSC Genome Browser and co-expression analysis (Figure 6A). We identified seven possible transcription factors: RAR-α, ER-α, p50, CACCC-binding factor, COUP-TF2, COUP-TF1, and IRF-1 located at -908, -903, -870, -647, -316, -311, and -238 in the RNASEH2A promoter relative to the transcription start site, respectively (Figure 6B). With respect to these transcription factors, gene set enrichment analysis also suggested that high expression of RNASEH2A enriched the ER targeting gene signature (Figure 6C). Considering the TCGA dataset, there was a statistically significant correlation between mRNA expression of ESR1 and RNASEH2A expression in ER-positive breast cancers, but not in ER-negative breast cancers (Figure 6D). ESR1 and ESR2 encode two forms of the human ER and are located at 6q25.1 and 14q23.2, respectively. ESR1 mRNA expression levels in ER-positive breast cancers are significantly higher than those in ER-negative breast cancers (Figure 6E); it may be that ESR1 is a regulatory target gene of RNASEH2A. Consistent with our previous findings, RNASEH2A expression may be important in ER-positive breast cancer.
Figure 6.
Results of bioinformatic analysis for predicting transcriptional regulation of RNASE2A. A. Identification of transcription factors that may regulate RNASEH2A was based on a prediction by the UCSC Genome Browser and co-expression analyses. B. Schematic representation of the transcription factors on the RNASEH2A promoter relative to the transcription start site (TSS). C. Gene-set enrichment analyses and prognosis of ER-positive breast cancer patients. D. Linear regression analysis between RNASEH2A and ESR1 expression in TCGA dataset-2. E. ESR1 mRNA expression in the ER-positive and ER-negative groups. TF, transcription factor; IHC, immunohistochemical stain; ESR1, estrogen receptor 1; ER, estrogen receptor.
The predictive capability of RNASEH2A for chemotherapy in breast cancer
Based on our findings, we propose that RNASEH2A is a valid prognostic indicator for ER-positive breast cancers. Thus, we explored its potential to serve as a biomarker for the selection of appropriate chemotherapy. We performed a stratified analysis to compare chemotherapy efficacy between RNASEH2A-low and RNASEH2A-high breast cancer patients. The NKI dataset and the TCGA dataset-2 were used for the analysis since they had chemotherapy information. Only data from stage II patients were selected for analysis to avoid TNM staging-related confounding effects. Other potential confounding factors were also added to adjust the HR. Chemotherapy did not affect the relative risk of OS in the RNASEH2A-low subgroup in TCGA-2 (Figure 7A), but significantly increased the relative risk of death (HR = 1.46; 95% CI 1.07-1.98) in the RNASEH2A-high subgroup (Figure 7B). In the NKI dataset, chemotherapy significantly reduced the OS of stage II breast cancer in the RNASEH2A-low subgroup (HR = 0.27, 95% Cl 0.06-0.87) (Figure 7C) but failed to reach statistical significance in the RNASEH2A-high subgroup (Figure 7D). Thus, overexpression of RNASEH2A may be associated with chemoresistance in ER-positive breast cancer at an early stage.
Figure 7.
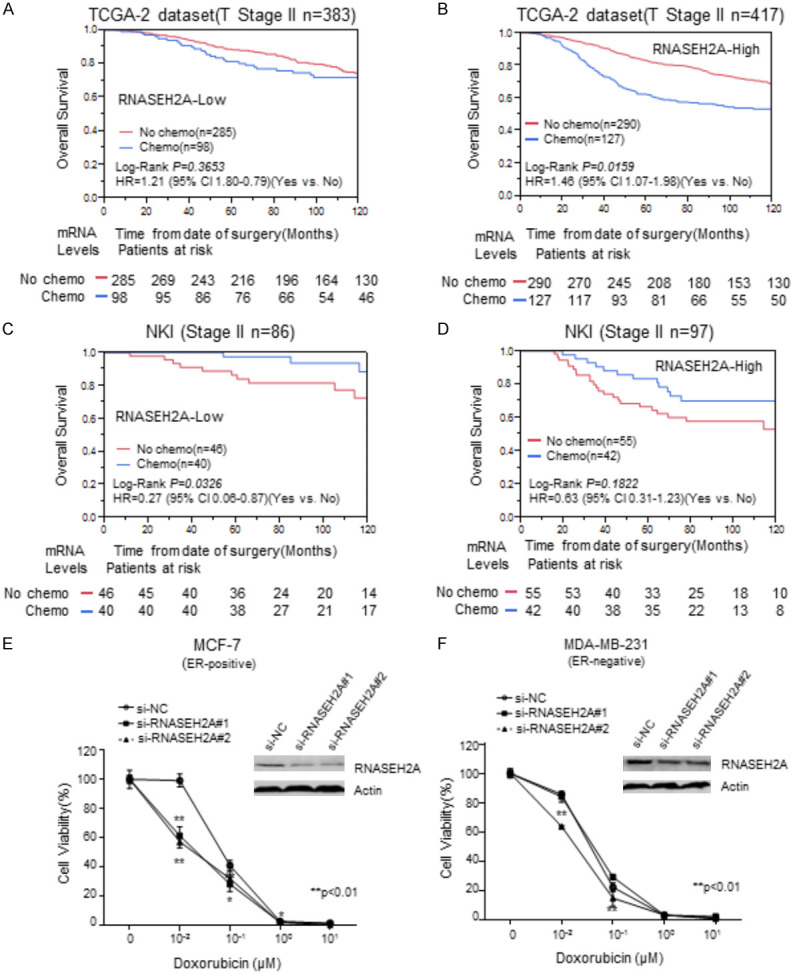
Stratification analysis of chemotherapy efficacy for patients with stage II breast cancer with various RNASEH2A expression levels for MCF-7 and MDA-MB-231 breast cancer lines. (A-D) Kaplan-Meier analyses of overall survival for chemotherapy in (A). the subgroup with low RNASEH2A expression in the TCGA dataset-2; (B) the subgroup with high RNASEH2A expression in the TCGA dataset-2; (C) the subgroup with low RNASEH2A expression in the NKI dataset; and (D) the subgroup with high RNASEH2A expression in the NKI dataset. (E and F) cytotoxicity curves. **, P<0.01. *, P<0.05.
An in vitro experiment was performed to confirm the results described above. We used the siRNAs that target RNASEH2A to transfect MCF-7 and MDA-MB-231 cells to reduce RNASEH2A expression. The cytotoxicity of doxorubicin on the transfected cells was subsequently assessed. Inhibition of RNASEH2A significantly enhanced the cytotoxicity of doxorubicin on MCF-7 cells (Figure 7E). The chemosensitivity of MDA-MB-231 cells was significantly improved by si-RNASEH2A#2, but not by siRNASEH2A#1 (Figure 7F). It may be that the reduction of RNASEH2A enhances the sensitivity of ER-positive breast cancers to chemotherapy. Thus, RNASEH2A expression is a potentially useful predictor of chemotherapy efficacy.
Oncofetal characteristics and gene interaction network analysis: identifying direct and indirect interacting partners of breast cancer
From the GSEA, we established a correlation between RNASEH2A expression and oncogenic gene signatures in the GSE22220 dataset. Samples were re-stratified as RNASEH2A-high (equal or higher than the median, n = 108) or RNASEH2A-low (less than the median, n = 108). Two representative GSEA results, the SMID breast cancer luminal A gene set (UP) and the BIDUS metastasis (UP) gene set, are displayed in Supplementary Figure 1A and 1B. The normalized enrichment score (NES) represents the strength of the relationship between RNASEH2A and the gene signature phenotype. Thus, high RNASEH2A expression is associated with the aggressiveness of breast cancer tumors.
To further explore the protein-protein interaction network of RNASEH2A, we used STRING (https://string-db.org/) to learn more about the proteins in this network (Supplementary Figure 1C). These genes are involved in the DNA replication pathway (RNASEH2B, RNASEH2C, and RNASEH1), cell cycle (MCM5, MCM7, MCM3, and PCNA), base excision repair (FEN1 and PCNA), and mitosis. Further pathway searching revealed that RNASEH2A is related to proliferation, invasion, and differentiation (Supplementary Figure 1D). Therefore, RNASEH2A may be involved in the regulation of DNA replication and excision repair, thereby promoting cancer cell invasion and chemoresistance, resulting in poor outcomes for ER-positive breast cancer patients.
Discussion
At present, few gene signatures are widely used for clinical applications for predicting survivability and guiding chemotherapy selection for ER-positive breast cancer patients. The Oncotype DX (21-gene recurrence score) test [8] is one of the guidelines used for predicting the likely outcome for women with early-stage breast cancer. However, given the medical precision that is possible today and the current focus on outcome-based therapy, it is clear that gene signatures for more breast cancer subtypes should be established in the future. Identification of novel potential biomarkers and therapeutic targets is critical for clinical and drug discovery purposes for breast cancer treatment.
In our in vitro studies, we observed that inhibition of RNASEH2A expression by siRNA suppressed proliferation and invasiveness of MCF-7 and MDA-MB-231 breast cancer cell lines (Figure 1). In a population-based analysis, we observed that RNASEH2A mRNA was overexpressed in cancerous tissue and significantly associated with tumor size and grade (Figure 2). Elevated RNASEH2A mRNA expression was significantly correlated with poor OS in a meta-analysis (Figure 3). From further Kaplan-Meier analysis, we concluded that RNASEH2A overexpression was significantly associated with poor survival in a dose-dependent manner in ER-positive breast cancer patients (Figure 4A), but not in ER-negative breast cancer patients. We further assessed the prognostic performance of RNASEH2A mRNA and compared it with multiple gene signatures, including 70-genes, wound-response genes, and the 21-gene recurrence score, as well as pathoclinical indicators. Expression of RNASEH2A not only correlated with poor prognoses in different breast cancer subtypes, but it had a similar prognostic capability as these multiple gene signatures in ER-positive breast cancers (Figure 5). From the combined results of this study, we conclude that RNASEH2A expression merits consideration as a useful prognostic biomarker for ER-positive breast cancer.
Homeostatic nucleotide metabolism is essential for the correct balance of cell proliferation, DNA replication, and genome stability [19]. RNASEH2A may affect this homeostasis and thereby affect cancer cell proliferation and invasion; therefore, enhanced RNASEH2A expression results in increased tumor growth and aggressiveness. Relevant to this suggestion is that abnormalities in ribonuclease H2 subunits A, B, and C in human germlines are implicated in a hyper-inflammatory Aicardi-Goutières syndrome (AGS) that results in malignancies; the development of malignancy in non-hyper-inflammatory AGS patient is rare [20-22]. The function of RNASEH2A is not limited to its role as a nucleotide degrading enzyme, as it is necessary for the maintenance of genome stability by removing ribonucleotides misincorporated by replicative polymerases [23,24]. RNASEH2A expression was elevated in tumors from colorectal cancer patients compared to non-tumorous tissues [25]; its expression is also upregulated in bladder, brain, breast, prostate, head and neck, seminoma, and leukemia cancers [10]. RNASEH2A expression is also essential for HIV replication [26]. It may be that the interaction of regulatory pathways with RNASEH2A affects the growth of tumor cells.
From the stratification analysis, we conclude that the prognostic performance of RNASEH2A expression for ER-positive breast cancer subtypes is better than for ER-negative subtypes (Figure 4A and 4B). The reason for this remains unclear, but it is an important question for future studies. Our analysis of possible transcription factors that regulate the transcription of RNASEH2A led to our hypothesis that the ER may bind to the promoter region of RNASEH2A and regulate its expression (Figure 6A). In support of this proposal, RNASEH2A overexpression significantly enriched the ER target gene signature (Figure 6C) and co-expression of ESR1 that encodes ER in ER-positive breast cancer (Figure 6D). Therefore, the ER may modulate the biological role of RNASEH2A through transcriptional regulation in ER-positive breast cancer. This will also be an interesting hypothesis to consider in future studies.
Stratification analysis demonstrated that the relative risk of death (HR of OS) following chemotherapy in the RNASEH2A-high subgroup is much higher than that in the RNASEH2A-low subgroup in the TCGA dataset (Stage II, ER-positive) (Figure 7A and 7B). This finding was also validated in the NKI dataset (Figure 7C and 7D). Furthermore, in a cytotoxicity assay in which expression of RNASEH2A was inhibited with siRNA, the sensitivity to doxorubicin of both transfected cell lines was greater than in the untransfected control (Figure 7E and 7F). Therefore, RNASEH2A may be a novel predictive biomarker and therapeutic target for the treatment of breast cancer at an early stage. Further cytotoxicity studies are warranted to confirm these results.
In summary, we conclude that overexpression of RNASEH2A enhances the aggressiveness of ER-positive breast cancer tumors and increases the likelihood of a poor outcome. Therefore, suppressing RNASEH2A expression will likely inhibit tumor growth, inhibit invasion of other tissues by the tumor, and increase the sensitivity of the cancer tissues to chemotherapy. RNASEH2A is a potential prognostic biomarker and therapeutic target for ER-positive breast cancer.
Acknowledgements
We gratefully acknowledge the NIH Gene Expression Omnibus (GEO), ArrayExpress (https://www.ebi.ac.uk/arrayexpress/), and the Cancer Genome Atlas pilot platform (http://cancergenome.nih.gov/) that made the genomic and clinical data for breast cancer available.
Disclosure of conflict of interest
None.
Abbreviations
- RNASEH2A
Ribonuclease H2 Subunit A
- ER
estrogen receptor
- PR
progesterone receptor
- HER2
human epidermal growth factor receptor 2
- GSEA
gene set enrichment analysis
- OS
overall survival
- PFS
progression-free survival
- HR
proportional hazard ratio
- 95% CI
95% confidence interval
- NC
negative control
Supporting Information
References
- 1.Ma FJ, Liu ZB, Hu X, Ling H, Li S, Wu J, Shao ZM. Prognostic value of myeloid differentiation primary response 88 and Toll-like receptor 4 in breast cancer patients. PLoS One. 2014;9:e111639. doi: 10.1371/journal.pone.0111639. [DOI] [PMC free article] [PubMed] [Google Scholar]
- 2.Anderson KN, Schwab RB, Martinez ME. Reproductive risk factors and breast cancer subtypes: a review of the literature. Breast Cancer Res Treat. 2014;144:1–10. doi: 10.1007/s10549-014-2852-7. [DOI] [PMC free article] [PubMed] [Google Scholar]
- 3.Tobin NP, Harrell JC, Lövrot J, Egyhazi Brage S, Frostvik Stolt M, Carlsson L, Einbeigi Z, Linderholm B, Loman N, Malmberg M, Walz T, Fernö M, Perou CM, Bergh J, Hatschek T, Lindström LS TEX Trialists Group. TEX Trialists Group: The molecular subtype and tumor characteristics of breast cancer metastases significantly influence patient post-relapse survival. Ann Oncol. 2015;26:81–8. doi: 10.1093/annonc/mdu498. [DOI] [PMC free article] [PubMed] [Google Scholar]
- 4.Tobin NP, Harrell JC, Lövrot J, Egyhazi Brage S, Frostvik Stolt M, Carlsson L, Einbeigi Z, Linderholm B, Loman N, Malmberg M, Walz T, Fernö M, Perou CM, Bergh J, Hatschek T, Lindström LS TEX Trialists Group. Expression signature of ten genes predicts the survival of patients with estrogen receptor positive-breast cancer that were treated with tamoxifen. Oncol Lett. 2018:573–579. doi: 10.3892/ol.2018.8663. [DOI] [PMC free article] [PubMed] [Google Scholar]
- 5.Nardone A, De Angelis C, Trivedi MV, Osborne CK, Schiff R. The changing role of ER in endocrine resistance. Breast. 2015;24(Suppl 2):S60–66. doi: 10.1016/j.breast.2015.07.015. [DOI] [PMC free article] [PubMed] [Google Scholar]
- 6.Jeselsohn R, Buchwalter G, De Angelis C, Brown M, Schiff R. ESR1 mutations-a mechanism for acquired endocrine resistance in breast cancer. Nat Rev Clin Oncol. 2015;12:573–583. doi: 10.1038/nrclinonc.2015.117. [DOI] [PMC free article] [PubMed] [Google Scholar]
- 7.Johnston SR. Enhancing endocrine therapy for hormone receptor-positive advanced breast cancer: cotargeting signaling pathways. J Natl Cancer Inst. 2015;107 doi: 10.1093/jnci/djv212. [DOI] [PubMed] [Google Scholar]
- 8.Paik S, Shak S, Tang G, Kim C, Baker J, Cronin M, Baehner FL, Walker MG, Watson D, Park T, Hiller W, Fisher ER, Wickerham DL, Bryant J, Wolmark N. A multigene assay to predict recurrence of tamoxifen-treated, node-negative breast cancer. N Engl J Med. 2004;351:2817–2826. doi: 10.1056/NEJMoa041588. [DOI] [PubMed] [Google Scholar]
- 9.Sparks JL, Chon H, Cerritelli SM, Kunkel TA, Johansson E, Crouch RJ, Burgers PM. RNase H2-initiated ribonucleotide excision repair. Mol Cell. 2012;47:980–986. doi: 10.1016/j.molcel.2012.06.035. [DOI] [PMC free article] [PubMed] [Google Scholar]
- 10.Feng S, Cao Z. Is the role of human RNase H2 restricted to its enzyme activity. Prog Biophys Mol Biol. 2016;121:66–73. doi: 10.1016/j.pbiomolbio.2015.11.001. [DOI] [PubMed] [Google Scholar]
- 11.Williams KA, Lee M, Hu Y, Andreas J, Patel SJ, Zhang S, Chines P, Elkahloun A, Chan-drasekharappa S, Gutkind JS, Molinolo AA, Crawford NP. A systems genetics approach identifies CXCL14, ITGAX, and LPCAT2 as novel aggressive prostate cancer susceptibility genes. PLoS Genet. 2014;10:e1004809. doi: 10.1371/journal.pgen.1004809. [DOI] [PMC free article] [PubMed] [Google Scholar]
- 12.Lee GY, Haverty PM, Li L, Kljavin NM, Bourgon R, Lee J, Stern H, Modrusan Z, Seshagiri S, Zhang Z, Davis D, Stokoe D, Settleman J, de Sauvage FJ, Neve RM. Comparative oncogenomics identifies PSMB4 and SHMT2 as potential cancer driver genes. Cancer Res. 2014;74:3114–3126. doi: 10.1158/0008-5472.CAN-13-2683. [DOI] [PubMed] [Google Scholar]
- 13.Subramanian A, Tamayo P, Mootha VK, Mukherjee S, Ebert BL, Gillette MA, Paulovich A, Pomeroy SL, Golub TR, Lander ES, Mesirov JP. Gene set enrichment analysis: a knowledge-based approach for interpreting genome-wide expression profiles. Proc Natl Acad Sci U S A. 2005;102:15545–15550. doi: 10.1073/pnas.0506580102. [DOI] [PMC free article] [PubMed] [Google Scholar]
- 14.Kang DY, Sp N, Kim DH, Joung YH, Lee HG, Park YM, Yang YM. Salidroside inhibits migration, invasion and angiogenesis of MDA‑MB 231 TNBC cells by regulating EGFR/Jak2/STAT3 signaling via MMP2. Int J Oncol. 2018;53:877–885. doi: 10.3892/ijo.2018.4430. [DOI] [PubMed] [Google Scholar]
- 15.van ‘t Veer LJ, Dai H, van de Vijver MJ, He YD, Hart AA, Mao M, Peterse HL, van der Kooy K, Marton MJ, Witteveen AT, Schreiber GJ, Kerkhoven RM, Roberts C, Linsley PS, Bernards R, Friend SH. Gene expression profiling predicts clinical outcome of breast cancer. Nature. 2002;415:530–536. doi: 10.1038/415530a. [DOI] [PubMed] [Google Scholar]
- 16.Saal LH, Johansson P, Holm K, Gruvberger-Saal SK, She QB, Maurer M, Koujak S, Ferrando AA, Malmström P, Memeo L, Isola J, Bendahl PO, Rosen N, Hibshoosh H, Ringnér M, Borg A, Parsons R. Poor prognosis in carcinoma is associated with a gene expression signature of aberrant PTEN tumor suppressor pathway activity. Proc Natl Acad Sci U S A. 2007;104:7564–7569. doi: 10.1073/pnas.0702507104. [DOI] [PMC free article] [PubMed] [Google Scholar]
- 17.Edge SB, Compton CC. The American Joint Committee on Cancer: the 7th edition of the AJCC cancer staging manual and the future of TNM. Ann Surg Oncol. 2010;17:1471–1474. doi: 10.1245/s10434-010-0985-4. [DOI] [PubMed] [Google Scholar]
- 18.van de Vijver MJ, He YD, van’t Veer LJ, Dai H, Hart AA, Voskuil DW, Schreiber GJ, Peterse JL, Roberts C, Marton MJ, Parrish M, Atsma D, Witteveen A, Glas A, Delahaye L, van der Velde T, Bartelink H, Rodenhuis S, Rutgers ET, Friend SH, Bernards R. A gene-expression signature as a predictor of survival in breast cancer. N Engl J Med. 2002;347:1999–2009. doi: 10.1056/NEJMoa021967. [DOI] [PubMed] [Google Scholar]
- 19.Kohnken R, Kodigepalli KM, Wu L. Regulation of deoxynucleotide metabolism in cancer: novel mechanisms and therapeutic implications. Mol Cancer. 2015;14:176. doi: 10.1186/s12943-015-0446-6. [DOI] [PMC free article] [PubMed] [Google Scholar]
- 20.Merati M, Buethe DJ, Cooper KD, Honda KS, Wang H, Gerstenblith MR. Aggressive CD8(+) epidermotropic cutaneous T-cell lymphoma associated with homozygous mutation in SAMHD1. JAAD Case Rep. 2015;1:227–229. doi: 10.1016/j.jdcr.2015.05.003. [DOI] [PMC free article] [PubMed] [Google Scholar]
- 21.Volkman HE, Stetson DB. The enemy within: endogenous retroelements and autoimmune disease. Nat Immunol. 2014;15:415–422. doi: 10.1038/ni.2872. [DOI] [PMC free article] [PubMed] [Google Scholar]
- 22.Pokatayev V, Hasin N, Chon H, Cerritelli SM, Sakhuja K, Ward JM, Morris HD, Yan N, Crouch RJ. RNase H2 catalytic core Aicardi-Goutieres syndrome-related mutant invokes cGAS-STING innate immune-sensing pathway in mice. J Exp Med. 2016;213:329–336. doi: 10.1084/jem.20151464. [DOI] [PMC free article] [PubMed] [Google Scholar]
- 23.Hiller B, Achleitner M, Glage S, Naumann R, Behrendt R, Roers A. Mammalian RNaseH2 removes ribonucleotides from DNA to maintain genome integrity. J Exp Med. 2012;209:1419–1426. doi: 10.1084/jem.20120876. [DOI] [PMC free article] [PubMed] [Google Scholar]
- 24.Reijns MA, Rabe B, Rigby RE, Mill P, Astell KR, Lettice LA, Boyle S, Leitch A, Keighren M, Kilanowski F, Devenney PS, Sexton D, Grimes G, Holt IJ, Hill RE, Taylor MS, Lawson KA, Dorin JR, Jackson AP. Enzymatic removal of ribonucleotides from DNA is essential for mammalian genome integrity and development. Cell. 2012;149:1008–1022. doi: 10.1016/j.cell.2012.04.011. [DOI] [PMC free article] [PubMed] [Google Scholar]
- 25.Yang CA, Huang HY, Chang YS, Lin CL, Lai IL, Chang JG. DNA-sensing and nuclease gene expressions as markers for colorectal cancer progression. Oncology. 2016;92:115–124. doi: 10.1159/000452281. [DOI] [PubMed] [Google Scholar]
- 26.Genovesio A, Kwon YJ, Windisch MP, Kim NY, Choi SY, Kim HC, Jung S, Mammano F, Perrin V, Boese AS, Casartelli N, Schwartz O, Nehrbass U, Emans N. Automated genome-wide visual profiling of cellular proteins involved in HIV infection. J Biomol Screen. 2011;16:945–958. doi: 10.1177/1087057111415521. [DOI] [PubMed] [Google Scholar]
Associated Data
This section collects any data citations, data availability statements, or supplementary materials included in this article.


