Abstract
COVID-19 is an emerging infection caused by a novel coronavirus that is moving so rapidly that on 30 January 2020 the World Health Organization declared the outbreak a Public Health Emergency of International Concern and on 11 March 2020 as a pandemic. An early diagnosis of COVID-19 is crucial for disease treatment and control of the disease spread. Real-time reverse-transcription polymerase chain reaction (RT-PCR) demonstrated a low sensibility; therefore chest computed tomography (CT) plays a pivotal role not only in the early detection and diagnosis, especially for false negative RT-PCR tests, but also in monitoring the clinical course and in evaluating the disease severity. This paper reports the CT findings with some hints on the temporal changes over the course of the disease: the CT hallmarks of COVID-19 are bilateral distribution of ground glass opacities with or without consolidation in the posterior and peripheral lung, but the predominant findings in later phases include consolidations, linear opacities, “crazy-paving” pattern, “reversed halo” sign and vascular enlargement. The CT findings of COVID-19 overlap with the CT findings of other diseases, in particular the viral pneumonia including influenza viruses, parainfluenza virus, adenovirus, respiratory syncytial virus, rhinovirus, human metapneumovirus, etc. There are differences as well as similarities in the CT features of COVID-19 compared with those of the severe acute respiratory syndrome. The aim of this article is to review the typical and atypical CT findings in COVID-19 patients in order to help radiologists and clinicians to become more familiar with the disease.
Keywords: Coronavirus pneumonia, Lungs, Chest CT, Ground glass opacities, Consolidation, Reticular pattern, Crazy-paving pattern
Introduction
The virus now known as SARS-CoV-2, showed up in Wuhan market in December 2019 and, starting from there, it rapidly spread throughout the world [1, 2], faster than other coronaviruses such as SARS-CoV-1 previously did. The global economic, social, historical, institutional and scientific impact of COVID-19 is and will remain substantial; the scientific community is still working to identify the disease in its earlier stages, when it is asymptomatic and the nasopharyngeal swab may still be negative.
The clinical expressions of COVID-19 range from asymptomatic course to mild (low-level fever, fatigue, and a dry cough together with symptoms such as nasal congestion, a runny nose, diarrhea and slight weakness with or without pneumonia) to severe form, characterized by dyspnea and/or hypoxemia that can quickly progress to septic shock, uncorrectable metabolic acidosis, coagulation disorders, hospital admission, need for intensive care, and death in 4.3–15% of patients [3].
Early disease progression can be rapid [4]. The severe clinical form is characterized by abnormal laboratory findings, such as hyperferritinemia, leukopenia, alterations of liver function tests, and high levels of cytokines (i.e., IL6, IL-1B, IL-1RA, IL-2, IL-10, and TNF-α) [4, 5] and chemokines such as IP-10 and MCP-1 [6, 7]. Liver injury in patients with coronavirus infections is often transient and can be directly caused by the viral infection of liver cells [8]. Several evidences suggest that the virus may induce a pro-inflammatory state related to the over-activation of effector T cells with associated massive production of pro-inflammatory cytokines that may play a key role in the development of the lung disease and damage, which in turn lead to acute lung injury (ALI) [9–11]. In the absence of a specific treatment or vaccine for COVID-19, early diagnosis and the subsequent isolation of infected patients are essential for disease control [12].
Chest computed tomography (CT) has a significant role in the very early stages of the infection, when the nasopharyngeal swab may still be negative, for eventually placing the diagnosis of COVID-19 in patients highly suspicious (i.e., clinical features and exposure history) [13] and set up a prognosis, as well as over the course of the disease for evaluating changes in severity requiring treatment adjustments.
Role of chest computed tomography in COVID-19
Taking into account that real-time reverse-transcription polymerase chain reaction (RT-PCR) of upper and lower respiratory specimens (such as nasopharyngeal or oropharyngeal swabs, sputum, tracheal aspirates, and bronchoalveolar lavage) is the reference standard for diagnosis of COVID-19 [14], it have to be highlighted that although RT-PCR is highly specific, recent studies have shown that it is only 30–60% sensitive [15] and it has been reported to be less sensitive than CT during the early course of the disease [16].
The reason for that may be related to a low patient viral load, improper sampling, the timing of sampling, or laboratory issues [15]. False negative results may also occur if amplification inhibitors are present in the specimen or if an inadequate quantitative of organisms is present in the specimen. Positive and negative predictive values are highly dependent on prevalence.
Moreover, RT-PCR is time-consuming [17] and a rapid decision-making is necessary in the early stages of an epidemic disease. Consequently, some COVID-19 patients may not be promptly identified and, therefore, not treated and isolated, with contribution to the disease spread; it is highly suggested to discharge the patient after obtaining two consecutive negative RT-PCR test results [15, 17, 18]. Chest CT is a widely accessible, fast and non-invasive diagnostic tool for pneumonia.
Although RT-PCR remains the reference for the diagnosis of COVID-19, CT may at least partially overcome the limitations of RT-PCR [13]. Using RT-PCR as the reference, Ai et al. [17] confirmed the high sensitivity of CT (97%), but a poor specificity was recorded (25%), with an accuracy of 68% for the diagnosis of COVID-19; therefore, typical findings on CT may rule out false negative RT-PCR tests; however there is a considerable overlap between COVID-19 and other viral pneumonia CT features [19, 20]. The same authors also highlight the fact that follow-up chest CT scans were capable of detecting an improvement in the condition of 42% of patients before their RT-PCR findings were negative [17]. They also analyzed the positive predictive value (PPV), negative predictive value (NPV), accuracy, sensitivity and specificity of chest CT in different age groups of both genders, and found that it was more accurate and had higher PPVs in patients aged ≥ 60 years than in younger patients and that, although there were no gender-based differences in its sensitivity, accuracy and PPV, it was more specific and had higher NPVs in women [17]. The sixth edition of the official diagnosis and treatment protocol of the National Health Commission of China states that chest CT is one of the diagnostic criteria for COVID-19 [21]. The Fleischner Society released a Multinational Consensus Statement about the role of chest CT for patients management during COVID-19 pandemic were they assess that imaging is indicated in patients highly suspected of COVID-19 (i.e., with moderate-severe clinical features and a high pre-test probability of disease) and in patients with COVID-19 and worsening respiratory status [22].
Therefore, CT can play a major role both in diagnosis of patients with high suspicion of COVID-19 [22], and in the management of COVID-19 patients [23]: it is effective for the detection of the disease in presence of unspecific or no clinical symptoms, and for the detection of possible clinical worsening before the peak of lung involvement occurs (6–11 days) [24, 25].
Regarding the CT acquisition protocol, the need for high-quality images may be conditioned by the high risk of motion artifacts in dyspneic, coughing patients. Volumetric acquisitions in deep inspiration are preferred; there are no reports about sequential axial acquisitions [25]. Even if some studies report protocols with high slice thickness (up to 8 mm) [26], a slice thickness < 3 mm is preferred, being the optimal 0.6–1.5 mm with no reconstruction gap [27]. Optimal scan parameters for a non-contrast chest CT are 100–120 kV with modulated mA for dose-saving and optimal pitch values of 1–1.5 [27, 28]. However, the management of motion artifacts relies on low rotation times and high pitch values; in this case the high-pitch, dual source acquisition may be helpful though not fully validated for pulmonary imaging [29]. In case of suspicion of pulmonary embolism (PE), a post-contrast CT angiography is required. The contrast material should be administered at a high injection rate (> 3 ml/s), followed by a saline chaser. The post-contrast acquisition is optimized with bolus-tracking techniques [30].
Considering the need for serial examinations during the disease course, some authors raised concerns about radiation dose suggesting the implementation of low-dose CT protocols [31]. The available strategies involve both the lowering of tube voltage and/or tube current with implementation of iterative reconstructions: it has to be pointed that most of these protocols were developed in a screening-setting for detection of lung nodules [32]. A relatively new technique is the spectral shaping where a tin filter removes the low component of the X-ray spectrum with significant reduction in radiation dose. Preliminary results in COVID-19 demonstrated encouraging results of spectral shaping coupled with dual-source acquisition [33, 34].
CT imaging features of COVID-19
COVID-19 demonstrated characteristic CT features during its course, so serial CT examinations may be helpful for monitoring disease course and to ensure a timely treatment. The hallmark of COVID-19 is the bilateral presence of patchy ground glass opacities (GGOs) that may coalesce into dense, consolidative lesions, with a predominantly peripheral distribution under the pleura and along the bronchovascular bundles [3, 35]. As the disease progresses, the number of lesions may rapidly increase and extend to central areas with the left lower lobe being more often involved than the upper/middle and right lobes [36]. During the disease recovery, the lesions are gradually absorbed over a period of two weeks, leading to the formation of fibrotic stripes [25].
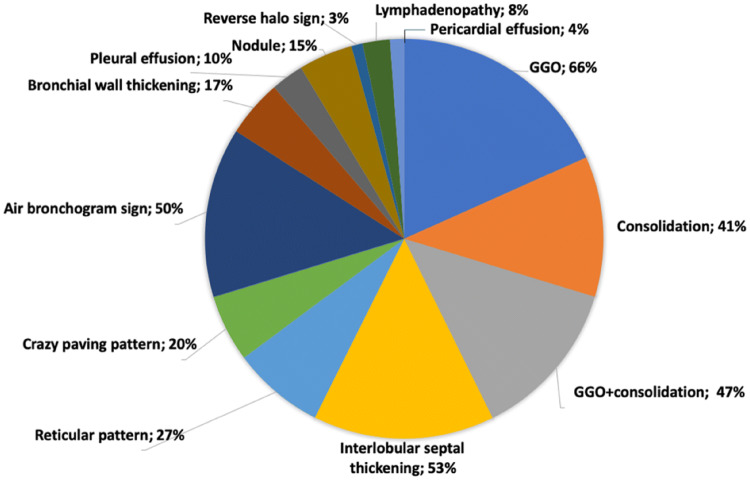
In addition to GGOs and consolidations, COVID-19 pneumonia may show other CT findings or patterns such as interstitial thickening, crazy-paving pattern, “reversed halo sign”, “halo sign”, and airway and vascular changes. These may help to differentiate COVID-19 pneumonia from other forms of pneumonia. Figure 1 shows the CT manifestations of COVID-19 described in published articles.
Fig. 1.
Average percentage of each chest CT manifestation of COVID-19 calculated from published studies
Ground glass opacities (GGOs)
GGOs are unspecific findings defined as hazy lung opacities that do not obscure the underlying vascular or bronchial margins (Fig. 2), are supposed to be related to a partial airspace filling or to interstitial thickening [37]. The predominant CT pattern in COVID-19 is bilateral GGOs associated with consolidations, but the findings may differ from patient to patient or the stage of the disease [3, 35]. Bernheim et al. [36] described the imaging findings of 121 symptomatic patients in relation to the time between symptom onset and the time of the patient underwent to a CT scan. In this case series, 56% of the CT examinations of “early” patients (i.e., 0–2 days after symptom onset) were normal, whereas only 9% of the “intermediate “ patients (3–5 days) and 4% of the “late “ patients (6–12 days) had normal CT findings [36]. This is in line with the data published by Pan et al. who observed a vast predominance of small sub-pleural GGOs during early disease, with the subsequent development of crazy-paving and of consolidation up to two weeks (peaking after 10 days) [25]. Wang et al. confirmed the predominance of GGOs after symptom onset, with the percentage decreasing during the course of the disease; they also described the co-presence of consolidation as the second most prevalent finding with the percentage increasing to 24% at 6–11 days after disease onset [24]. Xu et al. described the first postmortem biopsy study in which they found pulmonary edema and a hyaline membrane, which suggests the underlying pathological mechanism of GGOs [38]. In addition to GGOs the authors reported the presence of interstitial thickening and areas of consolidation [39], which together may suggest lung damage due to organizing pneumonia [40].
Fig. 2.
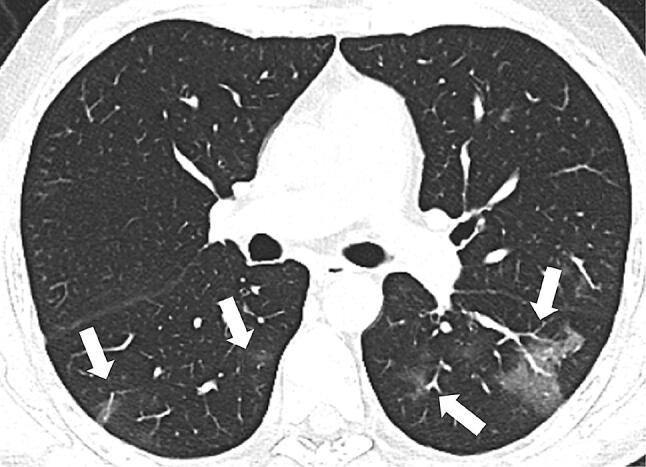
64-year-old man with COVID-19 in early stage of illness. Chest CT scan showing bilateral GGOs in the apical segments of both lower lobes (white arrows)
Consolidations
Consolidations are due to the complete replacement of alveolar airspaces by pathological fluids or cells, thus leading to an increase in parenchymal density that obscures the underlying vessels and bronchial walls [37] (Fig. 3). Consolidations are reported in 2–63% of cases, they may be multifocal, patchy or segmental, with sub-pleural or peri-bronchovascular distribution [28, 41]. The underlying pathological mechanism in COVID-19 may be the presence of cellular fibromyxoid exudates in the alveolar spaces [37]. The development of consolidations may be related to disease progression within two weeks after disease onset [25], this is in accordance with the fact that within 1–3 weeks, GGOs are preceding or co-existing with consolidations [42]. Moreover, as consolidations have been found to be more common in middle-late disease or in patients aged > 50 years [39], they may be a warning sign of a severe course.
Fig. 3.
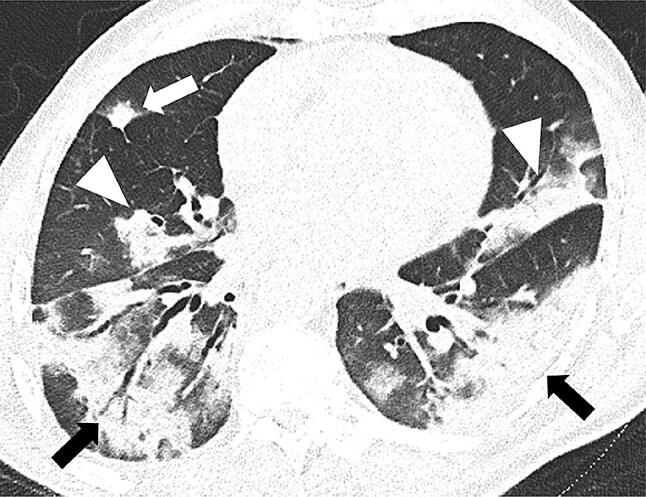
77-year-old man with COVID-19 in intermediate stage of illness. Chest CT scan showing large bilateral areas of consolidation with an air bronchogram in both lower lobes (black arrows). Less extensive consolidations can be seen in the left upper and middle lobe (white arrowheads), as well as a solid nodule surrounded by a ground glass halo in the middle lobe (white arrow)
Reticular opacities
A reticular pattern consists in a complex network of linear opacities related to interlobular and intralobular septal thickening [37, 43] (Fig. 4) due to lymphocyte infiltration [38]. It is the third most common finding in COVID-19 after GGOs and consolidations [28, 39, 42], and its frequency increases along the course of the disease [42].
Fig. 4.
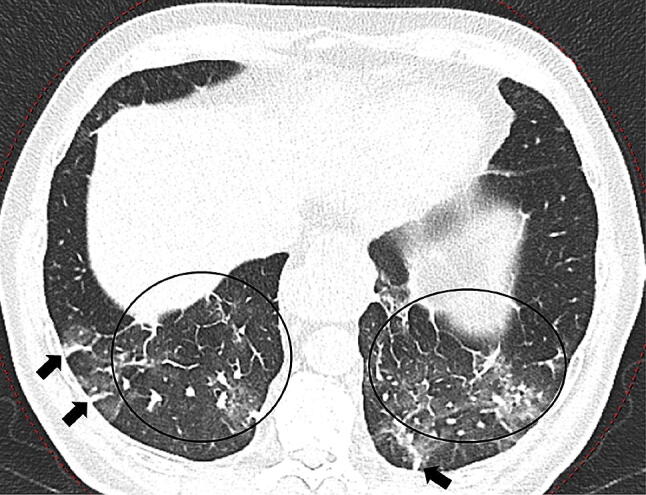
69-year-old woman with COVID-19 in remission stage of illness. Chest CT scan showing GGOs and thickened pulmonary interstitial structures (black circles), with a reticular pattern and fibrous stripes in both lower lobes (black arrows)
Crazy-paving
A crazy-paving pattern is defined as the presence of GGOs with superimposed interlobular septal thickening giving the appearance of irregular paving stones [37] (Fig. 5). In COVID-19, this finding is less frequent than GGOs alone and consolidations [25]. As previously found in the case of SARS, it may be related to alveolar edema coupled with inflammation of interstitial structures [28, 44]. It has been reported in 5–36% of COVID-19 patients [41], and may be considered a sign of progression or the peak stage when associated with GGOs and consolidations [25].
Fig. 5.
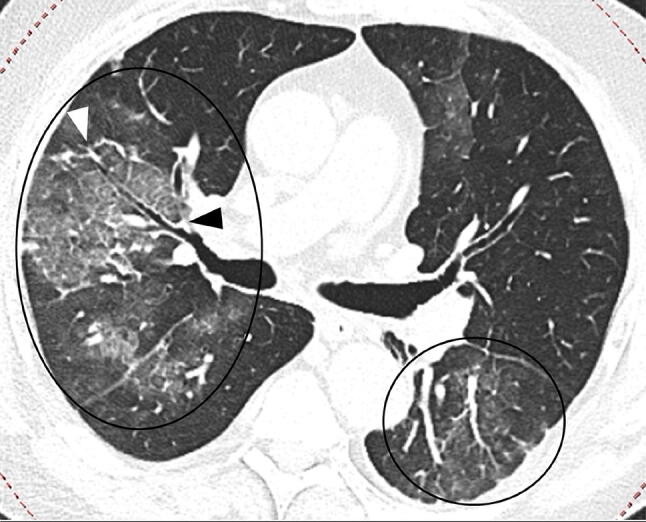
67-year-old man with COVID-19 in intermediate stage of illness. CT scan showing bilateral multifocal GGOs with superimposed interlobular septal thickening and visible intralobular lines (“crazy-paving”) (black circles). Bronchial wall thickening (black arrowhead) and multiple small vascular enlargements (“white arrowheads”) can also be seen in the right upper lobe
Air bronchograms
Air bronchograms, in which air-filled bronchi are visible within a highly attenuated parenchymal background [37] (Fig. 3), have been recorded in case-series of patients affected by COVID-19 [39]. However, an autoptic study of COVID-19 patients by Xi et al. [45] reported that actually the bronchi are filled by gelatinous mucus plugs, and therefore the term “air bronchogram” may be considered inaccurate as the bronchi are not filled with air and were found in association with a slight bronchial dilatation. For these reasons, Ye et al. [35] suggested that “bronchiolectasis” may be a more appropriate term; they also hypothesized that the high viscosity of the mucus may lead to bronchiolar damage, thus causing the bronchiolectasis and characteristic dry cough of COVID-19 patients.
Airway changes
The reported COVID-19-related airway changes were bronchiectasis [16] in some patients and bronchial wall thickening in 10–20% of cases [28, 41] (Fig. 5). The assumed pathological mechanism is bronchial obstruction and bronchial wall inflammatory damage, both leading to the destruction of bronchial wall structures, to the development of fibrosis, and to consequent bronchiectasis [37]. A recently published study found a significantly higher percentage of bronchial wall thickening in patients with severe/critical COVID-19 [41].
Pleural changes
The most frequent pleural change in COVID-19 patients is not pleural effusion (5% of cases), but pleural thickening (32%) [42] (Fig. 6). Intriguingly, as in the case of Middle East respiratory syndrome coronavirus (MERS-CoV) infection, the presence of pleural effusion has been suggested as a prognostic factor of a worse outcome [41, 42]. The presence of pleural thickening seems to be confirmed by autopsy findings [45].
Fig. 6.
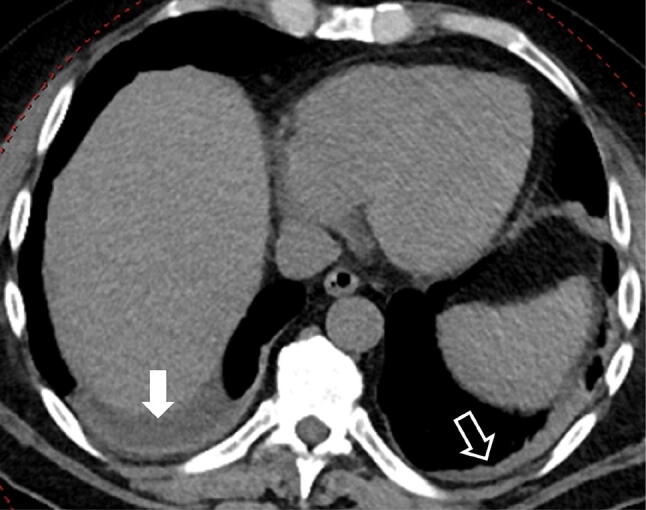
70-year-old woman with COVID-19 in intermediate stage of illness. CT scan showing the presence of right pleural effusion (white full arrow), and consolidation and pleural thickening in the left lower lobe (white empty arrow)
Nodules
A pulmonary nodule is defined as a rounded or irregular parenchymal opacity of < 3 cm in diameter [37] (Fig. 3); it is frequently related to the presence of viral pneumonia [46]. Multifocal solid irregular nodules were found in 3–13% of COVID-19 patients [25], sometimes in association with “halo sign” [47].
Halo sign and reversed halo or atoll sign
A “halo sign” is a nodule or mass surrounded by GGOs [37] (Fig. 7). It is not considered to be specific for COVID-19 as it has only been reported in a few case series [21, 47]. The pathological mechanism underlying this sign is unclear; it has been associated with angio-invasive fungal infections or hypervascular metastases, as a possible sign of peri-lesion hemorrhage [48], viral infections, and organizing pneumonia [49]. Specularly, the “reversed halo sign” or “atoll sign” is the presence of a ring-like area of consolidation with a superimposed rounded GGO [37]. These signs have been reported in association to COVID-19 and is thought to be related to a healing lesion with a lower density core or an evolving lesion around a preexisting GGO [50, 51]. It has previously been described in association with cryptogenic organizing pneumonia and other pulmonary infections [52, 53]. However, Li et al. [21] found the halo or reversed halo sign, respectively, in 17.6% and 3.8% of the COVID-19 patients, and were not reported in SARS or MERS patients.
Fig. 7.
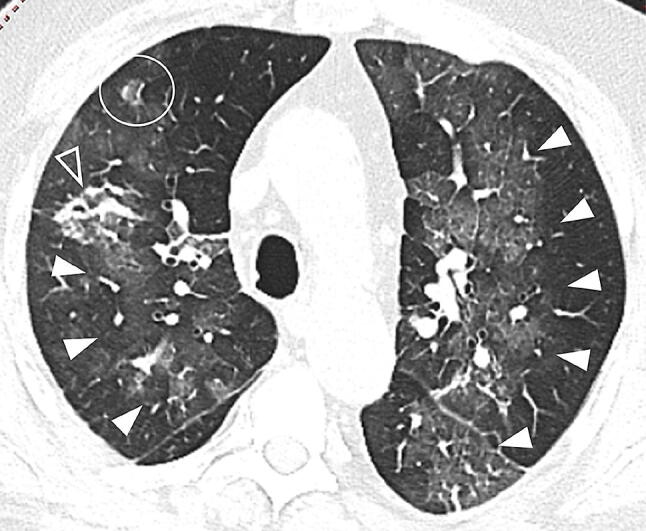
59-year-old woman with COVID-19 in intermediate stage of illness. CT scan showing a reversed halo sign (focal rounded GGOs surrounded by ring-like consolidation) in the anterior segment of the right upper lobe (white circle). It also shows GGOs bilaterally in the upper lobes and in the apical segment of the left lower lobe, with superimposed interlobular septal thickening and intralobular lines (“crazy-paving”) in the left lung (white full arrowheads), and focal consolidation with an air bronchogram in the right upper lobe (white empty arrowhead)
Lymphadenopathy
A mediastinal lymph node is defined as lymphadenopathy when its short-axis diameter is > 1 cm [37] (Fig. 8). This finding has been reported in 4–8% of patients with COVID-19 [28, 42], and it has been suggested as a likely significant risk factor for COVID-19-patients with severe/critical pneumonia [41]. However, a bacterial superinfection should be suspected when lymphadenopathies are found in association with pleural effusion and tiny lung nodules [15, 17, 18].
Fig. 8.

80-year-old man with COVID-19 in worsening stage of illness. Chest CT scan showing enlarged mediastinal lymph nodes (white arrows)
Pericardial effusion
Pericardial effusion has been reported in about 5% of COVID-19 patients and is assumed to be related to the presence of severe inflammation [28, 41] (Fig. 9). This hypothesis that may have been confirmed by a recent study that showed a higher incidence of pericardial effusion in association with severe/critical patients [41].
Fig. 9.
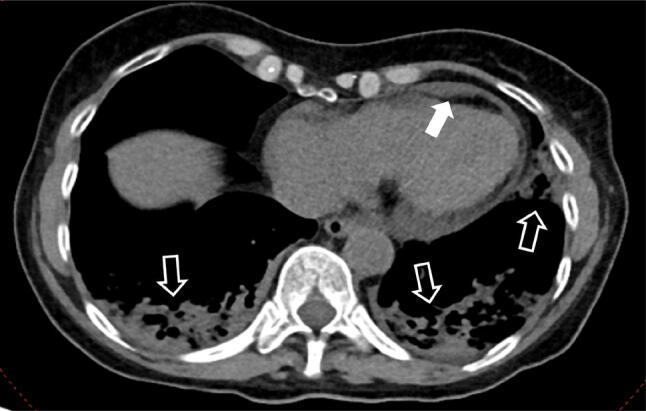
75-year-old man with COVID-19 in worsening stage of illness. CT scan showing pericardial effusion (white full arrow) and multiple extensive consolidations in both lower lobes and in the left upper lobe (white empty arrows)
COVID-19 and pulmonary embolism (PE)
Recently, some papers reported presence of coagulation disorders in patients affected by COVID-19 and suggested that microvascular thrombotic events may be involved in respiratory failure in COVID-19 [54–56] rising the hypothesis that subsegmental vascular enlargement close to GGOs could be a sing related to thrombosis [27, 35, 57]; however this sign may be also related to loco-regional hyperemia. Increased level of D-dimer has been reported in severe COVID-19 and correlated with poor prognosis [3, 56, 58]. Broadly speaking, infection of the respiratory tract is a known risk factor of inpatient PE [59], current literature reports PE in 22–30% of patients affected by COVID-19 [30, 56, 60, 61] (Fig. 10) and CT angiography is indicated when PE is clinically suspected.
Fig. 10.
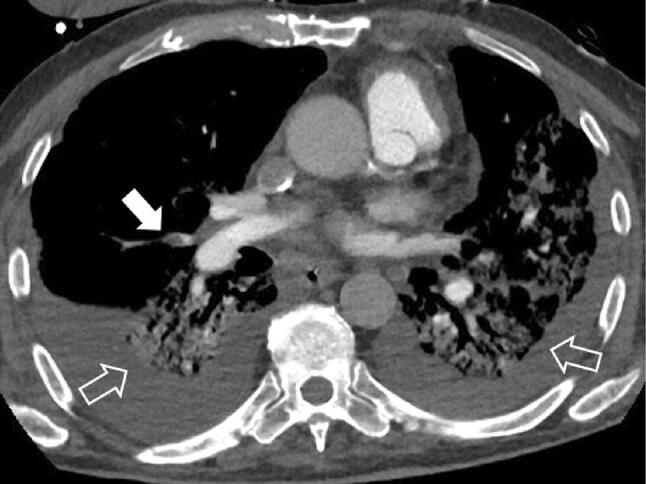
67-year-old man with COVID-19 complicated by pulmonary embolism, in worsening stage of illness. CT Angiography. Image shows a pulmonary embolus in a segmental branch of the right pulmonary artery for the middle lobe (white arrow) in a patient with bilateral consolidations and pleural effusion (empty arrows)
Differential diagnosis
Being RT-PCR the reference for COVID-19 diagnosis, CT demonstrated high sensitivity (97%) but poor specificity (25%) [17]. This is mostly due to the fact that the CT appearance of COVID-19 overlap with other viral pneumonia, including influenza viruses, parainfluenza virus, adenovirus, respiratory syncytial virus, rhinovirus, human metapneumovirus, etc. (Table 1) [19, 21, 62]. Similarly to COVID-19, most of the viral pneumonia involve both lungs and multiple lung lobes with predominant distribution in posterior and peripheral part of the lungs; however, there are some findings that could be useful in the differential diagnosis. The main CT feature of pneumonia by respiratory syncytial virus is small centrilobular nodules and areas of consolidation which are often asymmetrically distributed in the lungs. On chest CT, adenovirus pneumonia shows bilateral multifocal GGOs with patchy consolidations and may present lobar or segmental distribution. In human parainfluenza virus pneumonia presence of centrilobular nodules with bronchial wall thickening may allow to differentiate from other viral pneumonias. Chest CT in patients with influenza pneumonia shows bilateral patchy areas of GGOs with or without focal areas of consolidation, usually in the lower lobes.
Table 1.
CT manifestations of different types of pneumonia (modified from [62])
| COVID-19 | Other viral pneumonias | Common pneumonia | |
|---|---|---|---|
| Etiology | SARS-CoV-2 | Influenza A and B viruses, parainfluenza virus, cytomegalovirus, adenovirus, respiratory syncytial virus | Bacteria such as streptococci, mycoplasma, and chlamydia |
| Early symptoms | Fever and dry cough in most cases, sometimes diarrhea | High fever, cough, pharyngalgia, myalgia, etc | Fever, mild nasal obstruction, rhinorrhea, etc., in most cases |
| History | History of exposure to Wuhan or other epidemic regions; mainly males aged 40–60 years | Common in children in winter and spring; less common in adults or the community | Common in winter in children and the community |
| Laboratory test | Positive NAAT, normal or low WBC count, low lymphocyte count, and high serum CRP levels | Positive NAAT detection of influenza A and B viruses, parainfluenza virus, cytomegalovirus, adenovirus, and respiratory syncytial virus; increased lymphocyte count | High WBC count, high erythrocyte sedimentation rate, and significantly high CRP concentration |
| Chest CT findings |
Early stage: pure GGOs Progressive stage: multiple GGOs, consolidations in lesions, crazy-paving pattern Advanced stage: diffuse exudative lesions, lung whiteout |
Interstitial inflammation, high-attenuation reticular patterns or multiple high-attenuation fibrous streaks, localized pulmonary edema and/or atelectasis | Bronchial pneumonia, lobar pneumonia, bronchial wall thickening, centrilobular nodules, multiple consolidations mainly involving the lung parenchyma |
CRP C-reactive protein, CT computed tomography, GGO ground-glass opacity, NAAT nucleic acid amplification test, SARS-CoV-2 severe acute respiratory syndrome coronavirus 2, WBC white blood cell
Radiological presentation of COVID-19 is not much different from pneumonia associated with the other two coronaviruses, SARS and MERS, probably the reason of that should be related to the fact that since they belong to the same coronaviridae family, they present the same underlying pathological mechanism. The pulmonary lesions in SARS-CoV-1 included bilateral extensive consolidation; localized hemorrhage and necrosis; desquamative pulmonary alveolitis and bronchitis; proliferation and desquamation of alveolar epithelial cells; exudation of proteins, monocytes, lymphocytes, and plasma cells in alveoli; and hyaline membrane formation [5, 16, 35, 63, 64]. However, differently from the reported SARS cases, the COVID-19 pneumonia showed a tendency of multifocal distribution and a periphery distribution of GGO at the upper lobes and a basilar or subpleural preference in the lower lobes [65]. Moreover, the frequency of consolidation and severity score were also much lower than in SARS, which might explain the lower death rates of COVID-19 pneumonia than SARS. Similarly to MERS, COVID-19 pneumonia also presents a distribution at the right and left lower lobes but a more peripheral distribution could be recognized in the right and left upper lobes [65]. The archetypal responses associated with COVID-19 pneumonia are acute GGOs that may later fuse together into consolidations that gradually develop and organize themselves in a linear pattern with a prevalent peripheral distribution, and eventually show a crazy-paving pattern or a reversed halo sign [66]. Conversely, SARS and MERS pneumonias are usually associated with single foci [66] and there are no references to halo or reversed halo signs in the literature. Furthermore, unlike COVID-19, neither SARS nor MERS were significant associated with lymphadenopathy, pleural effusion, nodules, or cavitations [65].
Moreover, COVID-19 CT features demonstrated some overlap with other pulmonary conditions such as pulmonary edema, pulmonary hemorrhage [67], bronchiolitis obliterans, chronic obstructive pulmonary disease and drug-induced lung disease [62]. In pulmonary edema, chest CT demonstrates GGOs with central distribution, often associated with smooth interlobular septal thickening, pleural effusion, and cardiomegaly, indicating congestive heart failure. In diffuse pulmonary hemorrhage, CT demonstrates patchy or diffuse GGOs often in association with consolidations or ill-defined centrilobular opacities [67]. In bronchiolitis, air trapping is the principal CT feature and it may be associated to bronchial wall thickening, bronchiectasis, and profusion of centrilobular opacities. In chronic obstructive pulmonary disease, bronchial wall thickening may be seen in addition to lung emphysema. Drug-induced lung diseases are various and may demonstrate a variety of lung presentations, ranging from an adult respiratory distress syndrome to pulmonary fibrosis. For example, the most common chest CT features in methotrexate-induced lung disease diffuse parenchymal opacification, reticular opacities, and centrilobular nodules with a non-specific interstitial pneumonia pattern [62].
Therefore, it is necessary that the radiologists are confident with the different imaging patterns of COVID-19 and their changes during the course of the disease [24, 35] in order to guarantee the prompt detection of disease progression and potential complications.
Conclusions
In conclusion, our comprehensive review of published studies and front-line experience of interpreting CT images of COVID-19 pneumonia confirm the importance of CT in the diagnosis and management of COVID-19 infection. Unlike other forms of pneumonia, COVID-19 pneumonia shows a high prevalence of bilateral GGOs with a predominantly peripheral distribution on CT scans that are often paired with consolidations and interstitial thickening, and is less frequently associated with widespread distribution, pleural effusion or lymphadenopathy [19, 62].
Clinicians and radiologists should familiarize themselves with CT findings in COVID-19 patients for various reasons [68, 69]: chest CT images can arise an early suspicion of COVID-19 pneumonia and, in the correct clinical setting, bilateral GGOs or consolidation should prompt radiologists to suggest it as a possible diagnosis; CT can, therefore, complement RT-PCR in COVID-19 diagnosis [22]. Chest CT, also, plays an important follow-up role as the progression of the CT features of the disease may indicate a parallel progression in disease severity that should be promptly notified to clinicians (e.g., the suspicion of a secondary bacterial infection). A possible limitation of CT is the radiation dose because COVID-19 can affect everyone, including newborns and infants; preliminary data on low-dose CT protocols showed encouraging results.
Compliance with ethical standards
Conflict of interest
The authors declare that they have no conflict of interest.
Ethical standards
This article does not contain any studies with human participants or animals performed by any of the authors.
Footnotes
Publisher's Note
Springer Nature remains neutral with regard to jurisdictional claims in published maps and institutional affiliations.
Contributor Information
Marina Carotti, Email: marina.carotti@gmail.com.
Fausto Salaffi, Email: fausto.salaffi@gmail.com.
Piercarlo Sarzi-Puttini, Email: piercarlo.sarziputtini@gmail.com.
Andrea Agostini, Email: dott.andrea.agostini@gmail.com.
Alessandra Borgheresi, Email: alessandra.borgheresi@gmail.com.
Davide Minorati, Email: davide.minorati@hotmail.com.
Massimo Galli, Email: massimo.galli@unimi.it.
Daniela Marotto, Email: daniela.marotto@tiscali.it.
Andrea Giovagnoni, Email: a.giovagnoni@univpm.it.
References
- 1.Zhu N, Zhang D, Wang W, et al. A novel coronavirus from patients with pneumonia in China, 2019. N Engl J Med. 2020;382:727–733. doi: 10.1056/NEJMoa2001017. [DOI] [PMC free article] [PubMed] [Google Scholar]
- 2.Sohrabi C, Alsafi Z, O'Neill N, et al. World Health Organization declares global emergency: a review of the 2019 novel coronavirus (COVID-19) Int J Surg. 2020;76:71–76. doi: 10.1016/j.ijsu.2020.02.034. [DOI] [PMC free article] [PubMed] [Google Scholar]
- 3.Wang D, Hu B, Hu C, et al. Clinical characteristics of 138 hospitalized patients with 2019 novel coronavirus-infected pneumonia in Wuhan, China. JAMA. 2020 doi: 10.1001/jama.2020.1585. [DOI] [PMC free article] [PubMed] [Google Scholar]
- 4.Huang C, Wang Y, Li X, et al. Clinical features of patients infected with 2019 novel coronavirus in Wuhan, China. Lancet. 2020;395:497–506. doi: 10.1016/S0140-6736(20)30183-5. [DOI] [PMC free article] [PubMed] [Google Scholar]
- 5.Okabayashi T, Kariwa H, Yokota S-I, et al. Cytokine regulation in SARS coronavirus infection compared to other respiratory virus infections. J Med Virol. 2006;78:417–424. doi: 10.1002/jmv.20556. [DOI] [PMC free article] [PubMed] [Google Scholar]
- 6.Lo AWI, Tang NLS, To K-F. How the SARS coronavirus causes disease: host or organism? J Pathol. 2006;208:142–151. doi: 10.1002/path.1897. [DOI] [PMC free article] [PubMed] [Google Scholar]
- 7.Channappanavar R, Perlman S. Pathogenic human coronavirus infections: causes and consequences of cytokine storm and immunopathology. Semin Immunopathol. 2017;39:529–539. doi: 10.1007/s00281-017-0629-x. [DOI] [PMC free article] [PubMed] [Google Scholar]
- 8.Zhang C, Shi L, Wang F-S. Liver injury in COVID-19: management and challenges. Lancet Gastroenterol Hepatol. 2020;5:428–430. doi: 10.1016/S2468-1253(20)30057-1. [DOI] [PMC free article] [PubMed] [Google Scholar]
- 9.Channappanavar R, Fehr AR, Vijay R, et al. Dysregulated type I interferon and inflammatory monocyte-macrophage responses cause lethal pneumonia in SARS-CoV-infected mice. Cell Host Microbe. 2016;19:181–193. doi: 10.1016/j.chom.2016.01.007. [DOI] [PMC free article] [PubMed] [Google Scholar]
- 10.Dholaria BR, Bachmeier CA, Locke F. Mechanisms and management of chimeric antigen receptor T-cell therapy-related toxicities. BioDrugs. 2019;33:45–60. doi: 10.1007/s40259-018-0324-z. [DOI] [PMC free article] [PubMed] [Google Scholar]
- 11.Lee DW, Gardner R, Porter DL, et al. Current concepts in the diagnosis and management of cytokine release syndrome. Blood. 2014;124:188–195. doi: 10.1182/blood-2014-05-552729. [DOI] [PMC free article] [PubMed] [Google Scholar]
- 12.Marotto D, Sarzi-Puttini P. What is the role of rheumatologists in the era of COVID-19? Autoimmun Rev. 2020;19:102539. doi: 10.1016/j.autrev.2020.102539. [DOI] [PMC free article] [PubMed] [Google Scholar]
- 13.Xie X, Zhong Z, Zhao W, et al. Chest CT for typical 2019-nCoV pneumonia: relationship to negative RT-PCR testing. Radiology. 2020 doi: 10.1148/radiol.2020200343. [DOI] [PMC free article] [PubMed] [Google Scholar]
- 14.American College of Radiology ACR Recommendations for the use of Chest Radiography and Computed Tomography (CT) for Suspected COVID-19 Infection. In: ACR. https://www.acr.org/Advocacy-and-Economics/ACR-Position-Statements/Recommendations-for-Chest-Radiography-and-CT-for-Suspected-COVID19-Infection. Accessed 1 Apr 2020
- 15.Fang Y, Zhang H, Xie J, et al. Sensitivity of chest CT for COVID-19: comparison to RT-PCR. Radiology. 2020 doi: 10.1148/radiol.2020200432. [DOI] [PMC free article] [PubMed] [Google Scholar]
- 16.Fang Y, Zhang H, Xu Y, et al. CT manifestations of two cases of 2019 novel coronavirus (2019-nCoV) pneumonia. Radiology. 2020 doi: 10.1148/radiol.2020200280. [DOI] [PMC free article] [PubMed] [Google Scholar]
- 17.Ai T, Yang Z, Hou H, et al. Correlation of chest CT and RT-PCR testing in coronavirus disease 2019 (COVID-19) in China: a report of 1014 cases. Radiology. 2020 doi: 10.1148/radiol.2020200642. [DOI] [PMC free article] [PubMed] [Google Scholar]
- 18.Kanne JP, Little BP, Chung JH, et al. Essentials for radiologists on COVID-19: an update-radiology scientific expert panel. Radiology. 2020 doi: 10.1148/radiol.2020200527. [DOI] [PMC free article] [PubMed] [Google Scholar]
- 19.Bai HX, Hsieh B, Xiong Z, et al. Performance of radiologists in differentiating COVID-19 from viral pneumonia on chest CT. Radiology. 2020 doi: 10.1148/radiol.2020200823. [DOI] [PMC free article] [PubMed] [Google Scholar]
- 20.Liu M, Zeng W, Wen Y, et al. COVID-19 pneumonia: CT findings of 122 patients and differentiation from influenza pneumonia. Eur Radiol. 2020;395:1–7. doi: 10.1007/s00330-020-06928-0. [DOI] [PMC free article] [PubMed] [Google Scholar]
- 21.Li Y, Xia L. Coronavirus disease 2019 (COVID-19): role of chest CT in diagnosis and management. AJR Am J Roentgenol. 2020 doi: 10.2214/AJR.20.22954. [DOI] [PubMed] [Google Scholar]
- 22.Rubin GD, Haramati LB, Kanne JP, et al. The role of chest imaging in patient management during the COVID-19 pandemic: a multinational consensus statement from the Fleischner Society. Radiology. 2020 doi: 10.1148/radiol.2020201365. [DOI] [PMC free article] [PubMed] [Google Scholar]
- 23.Xiong Y, Sun D, Liu Y, et al. Clinical and high-resolution CT features of the COVID-19 infection: comparison of the initial and follow-up changes. Invest Radiol Publish. 2020 doi: 10.1097/RLI.0000000000000674. [DOI] [PMC free article] [PubMed] [Google Scholar]
- 24.Wang Y, Dong C, Hu Y, et al. Temporal changes of CT findings in 90 patients with COVID-19 pneumonia: a longitudinal study. Radiology. 2020 doi: 10.1148/radiol.2020200843. [DOI] [PMC free article] [PubMed] [Google Scholar]
- 25.Pan F, Ye T, Sun P, et al. Time course of lung changes on chest CT during recovery from 2019 novel coronavirus (COVID-19) pneumonia. Radiology. 2020 doi: 10.1148/radiol.2020200370. [DOI] [PMC free article] [PubMed] [Google Scholar]
- 26.Chung M, Bernheim A, Mei X, et al. CT imaging features of 2019 novel coronavirus (2019-nCoV) Radiology. 2020 doi: 10.1148/radiol.2020200230. [DOI] [PMC free article] [PubMed] [Google Scholar]
- 27.Caruso D, Zerunian M, Polici M, et al. Chest CT features of COVID-19 in Rome. Italy Radiol. 2020 doi: 10.1148/radiol.2020201237. [DOI] [PMC free article] [PubMed] [Google Scholar]
- 28.Wu J, Wu X, Zeng W, et al. Chest CT findings in patients with corona virus disease 2019 and its relationship with clinical features. Invest Radiol. 2020 doi: 10.1097/RLI.0000000000000670. [DOI] [PMC free article] [PubMed] [Google Scholar]
- 29.Kim SH, Choi YH, Cho H-H, et al. Comparison of image quality and radiation dose between high-pitch mode and low-pitch mode spiral chest CT in small uncooperative children: the effect of respiratory rate. Eur Radiol. 2016;26:1149–1158. doi: 10.1007/s00330-015-3930-x. [DOI] [PubMed] [Google Scholar]
- 30.Grillet F, Behr J, Calame P, et al. Acute pulmonary embolism associated with COVID-19 pneumonia detected by pulmonary CT angiography. Radiology. 2020 doi: 10.1148/radiol.2020201544. [DOI] [PMC free article] [PubMed] [Google Scholar]
- 31.Kang Z, Li X, Zhou S. Recommendation of low-dose CT in the detection and management of COVID-2019. Eur Radiol. 2020;395:1–2. doi: 10.1007/s00330-020-06809-6. [DOI] [PMC free article] [PubMed] [Google Scholar]
- 32.Khawaja RDA, Singh S, Madan R, et al. Ultra low-dose chest CT using filtered back projection: comparison of 80-, 100- and 120 kVp protocols in a prospective randomized study. Eur J Radiol. 2014;83:1934–1944. doi: 10.1016/j.ejrad.2014.06.024. [DOI] [PubMed] [Google Scholar]
- 33.Gordic S, Morsbach F, Schmidt B, et al. Ultralow-dose chest computed tomography for pulmonary nodule detection: first performance evaluation of single energy scanning with spectral shaping. Invest Radiol. 2014;49:465–473. doi: 10.1097/RLI.0000000000000037. [DOI] [PubMed] [Google Scholar]
- 34.Agostini A, Floridi C, Borgheresi A, et al. Proposal of a low-dose, long-pitch, dual-source chest CT protocol on third-generation dual-source CT using a tin filter for spectral shaping at 100 kVp for CoronaVirus Disease 2019 (COVID-19) patients: a feasibility study. Radiol med. 2020;395:507–509. doi: 10.1007/s11547-020-01179-x. [DOI] [PMC free article] [PubMed] [Google Scholar]
- 35.Ye Z, Zhang Y, Wang Y, et al. Chest CT manifestations of new coronavirus disease 2019 (COVID-19): a pictorial review. Eur Radiol. 2020;382:1–9. doi: 10.1007/s00330-020-06801-0. [DOI] [PMC free article] [PubMed] [Google Scholar]
- 36.Bernheim A, Mei X, Huang M, et al. Chest CT findings in coronavirus disease-19 (COVID-19): relationship to duration of infection. Radiology. 2020 doi: 10.1148/radiol.2020200463. [DOI] [PMC free article] [PubMed] [Google Scholar]
- 37.Hansell DM, Bankier AA, MacMahon H, et al. Fleischner Society: glossary of terms for thoracic imaging. Radiology. 2008;246:697–722. doi: 10.1148/radiol.2462070712. [DOI] [PubMed] [Google Scholar]
- 38.Xu Z, Shi L, Wang Y, et al. Pathological findings of COVID-19 associated with acute respiratory distress syndrome. Lancet Respir Med. 2020;8:420–422. doi: 10.1016/S2213-2600(20)30076-X. [DOI] [PMC free article] [PubMed] [Google Scholar]
- 39.Song F, Shi N, Shan F, et al. Emerging coronavirus 2019-nCoV pneumonia. Radiology. 2020 doi: 10.1148/radiol.2020200274. [DOI] [PMC free article] [PubMed] [Google Scholar]
- 40.Kanne JP. Chest CT findings in 2019 novel coronavirus (2019-nCoV) infections from Wuhan, China: key points for the radiologist. Radiology. 2020;295:16–17. doi: 10.1148/radiol.2020200241. [DOI] [PMC free article] [PubMed] [Google Scholar]
- 41.Li K, Wu J, Wu F, et al. The clinical and chest CT features associated with severe and critical COVID-19 pneumonia. Invest Radiol. 2020 doi: 10.1097/RLI.0000000000000672. [DOI] [PMC free article] [PubMed] [Google Scholar]
- 42.Shi H, Han X, Jiang N, et al. Radiological findings from 81 patients with COVID-19 pneumonia in Wuhan, China: a descriptive study. Lancet Infect Dis. 2020 doi: 10.1016/S1473-3099(20)30086-4. [DOI] [PMC free article] [PubMed] [Google Scholar]
- 43.Ajlan AM, Ahyad RA, Jamjoom LG, et al. Middle East respiratory syndrome coronavirus (MERS-CoV) infection: chest CT findings. AJR Am J Roentgenol. 2014;203:782–787. doi: 10.2214/AJR.14.13021. [DOI] [PubMed] [Google Scholar]
- 44.Wong KT, Antonio GE, Hui DSC, et al. Thin-section CT of severe acute respiratory syndrome: evaluation of 73 patients exposed to or with the disease1. Radiology. 2003;228:395–400. doi: 10.1148/radiol.2283030541. [DOI] [PubMed] [Google Scholar]
- 45.Xi Liu RW, Guoqiang Q, al E YW. A observational autopsy report of COVID-19 (Chinese) J Forensic Med. 2020;36:19–21. [Google Scholar]
- 46.Franquet T. Imaging of pulmonary viral pneumonia. Radiology. 2011;260:18–39. doi: 10.1148/radiol.11092149. [DOI] [PubMed] [Google Scholar]
- 47.Li X, Zeng X, Liu B, Yu Y. COVID-19 infection presenting with CT halo sign. Radiol Cardiothorac Imaging. 2020 doi: 10.1148/ryct.2020200026. [DOI] [PMC free article] [PubMed] [Google Scholar]
- 48.Kuhlman JE, Fishman EK, Siegelman SS. Invasive pulmonary aspergillosis in acute leukemia: characteristic findings on CT, the CT halo sign, and the role of CT in early diagnosis. Radiology. 1985;157:611–614. doi: 10.1148/radiology.157.3.3864189. [DOI] [PubMed] [Google Scholar]
- 49.Pinto PS. The CT halo sign. Radiology. 2004;230:109–110. doi: 10.1148/radiol.2301020649. [DOI] [PubMed] [Google Scholar]
- 50.Huang P, Liu T, Huang L, et al. Use of chest CT in combination with negative RT-PCR assay for the 2019 novel coronavirus but high clinical suspicion. Radiology. 2020 doi: 10.1148/radiol.2020200330. [DOI] [PMC free article] [PubMed] [Google Scholar]
- 51.Xu R, Du M, Li L, et al. CT imaging of one extended family cluster of corona virus disease 2019 (COVID-19) including adolescent patients and “silent infection”. Quant Imaging Med Surg. 2020;10:800–804. doi: 10.21037/qims.2020.02.13. [DOI] [PMC free article] [PubMed] [Google Scholar]
- 52.Zompatori M, Poletti V, Battista G, Diegoli M. Bronchiolitis obliterans with organizing pneumonia (BOOP), presenting as a ring-shaped opacity at HRCT (the atoll sign). A case report. Radiol Med. 1999;97:308–310. [PubMed] [Google Scholar]
- 53.Gasparetto EL, Escuissato DL, Davaus T, et al. Reversed halo sign in pulmonary paracoccidioidomycosis. Am J Roentgenol. 2005;184:1932–1934. doi: 10.2214/ajr.184.6.01841932. [DOI] [PubMed] [Google Scholar]
- 54.Tang N, Li D, Wang X, Sun Z. Abnormal coagulation parameters are associated with poor prognosis in patients with novel coronavirus pneumonia. J Thromb Haemost. 2020;18:844–847. doi: 10.1111/jth.14768. [DOI] [PMC free article] [PubMed] [Google Scholar]
- 55.Magro C, Mulvey JJ, Berlin D, et al. Complement associated microvascular injury and thrombosis in the pathogenesis of severe COVID-19 infection: a report of five cases. Transl Res. 2020 doi: 10.1016/j.trsl.2020.04.007. [DOI] [PMC free article] [PubMed] [Google Scholar]
- 56.Oudkerk M, Büller HR, Kuijpers D, et al. Diagnosis, prevention, and treatment of thromboembolic complications in COVID-19: report of the national institute for public health of the netherlands. Radiology. 2020 doi: 10.1148/radiol.2020201629. [DOI] [PMC free article] [PubMed] [Google Scholar]
- 57.Albarello F, Pianura E, Di Stefano F, et al. 2019-novel coronavirus severe adult respiratory distress syndrome in two cases in Italy: an uncommon radiological presentation. Int J Infect Dis. 2020;93:192–197. doi: 10.1016/j.ijid.2020.02.043. [DOI] [PMC free article] [PubMed] [Google Scholar]
- 58.Zhou F, Yu T, Du R, et al. Clinical course and risk factors for mortality of adult inpatients with COVID-19 in Wuhan, China: a retrospective cohort study. Lancet. 2020;395:1054–1062. doi: 10.1016/S0140-6736(20)30566-3. [DOI] [PMC free article] [PubMed] [Google Scholar]
- 59.Goeijenbier M, van Wissen M, van de Weg C, et al. Review: Viral infections and mechanisms of thrombosis and bleeding. J Med Virol. 2012;84:1680–1696. doi: 10.1002/jmv.23354. [DOI] [PMC free article] [PubMed] [Google Scholar]
- 60.Leonard-Lorant I, Delabranche X, Severac F, et al. Acute pulmonary embolism in COVID-19 patients on CT angiography and relationship to D-dimer levels. Radiology. 2020 doi: 10.1148/radiol.2020201561. [DOI] [PMC free article] [PubMed] [Google Scholar]
- 61.Poyiadi N, Cormier P, Patel PY, et al. Acute pulmonary embolism and COVID-19. Radiology. 2020 doi: 10.1148/radiol.2020201955. [DOI] [PMC free article] [PubMed] [Google Scholar]
- 62.Dai W-C, Zhang H-W, Yu J, et al. CT imaging and differential diagnosis of COVID-19. Can Assoc Radiol J. 2020;71:195–200. doi: 10.1177/0846537120913033. [DOI] [PMC free article] [PubMed] [Google Scholar]
- 63.Qian L, Yu J, Shi H. Severe acute respiratory disease in a huanan seafood market worker: images of an early casualty. Radiol Cardiothorac Imaging. 2020;2:e200033–2. doi: 10.1148/ryct.2020200033. [DOI] [PMC free article] [PubMed] [Google Scholar]
- 64.Kay F, Abbara S. The many faces of COVID-19: spectrum of imaging manifestations. Radiol Cardiothorac Imaging. 2020;2:e200037. doi: 10.1148/ryct.2020200037. [DOI] [PMC free article] [PubMed] [Google Scholar]
- 65.Hosseiny M, Kooraki S, Gholamrezanezhad A, et al. Radiology perspective of coronavirus disease 2019 (COVID-19): lessons from severe acute respiratory syndrome and middle east respiratory syndrome. AJR Am J Roentgenol. 2020 doi: 10.2214/AJR.20.22969. [DOI] [PubMed] [Google Scholar]
- 66.Paul NS, Roberts H, Butany J, et al. Radiologic pattern of disease in patients with severe acute respiratory syndrome: the toronto experience. RadioGraphics. 2004;24:553–563. doi: 10.1148/rg.242035193. [DOI] [PubMed] [Google Scholar]
- 67.Saba L, Sverzellati N. Is COVID evolution due to occurrence of pulmonary vascular thrombosis? J Thorac Imaging. 2020 doi: 10.1097/RTI.0000000000000530. [DOI] [PMC free article] [PubMed] [Google Scholar]
- 68.Sarzi-Puttini P, Giorgi V, Sirotti S, et al. COVID-19, cytokines and immunosuppression: what can we learn from severe acute respiratory syndrome? Clin Exp Rheumatol. 2020;38:337–342. [PubMed] [Google Scholar]
- 69.Ng M-Y, Lee EY, Yang J, et al. Imaging profile of the COVID-19 infection: radiologic findings and literature review. Radiol Cardiothorac Imaging. 2020;2:e200034. doi: 10.1148/ryct.2020200034. [DOI] [PMC free article] [PubMed] [Google Scholar]


