

Abstract
Background
As an increasing number of patients exhibit concomitant cardiac and pulmonary disease, limitations of standard diagnostic criteria are more frequently encountered. Here, we apply noninvasive 129Xe magnetic resonance imaging (MRI) and spectroscopy to identify patterns of regional gas transfer impairment and haemodynamics that are uniquely associated with chronic obstructive pulmonary disease (COPD), idiopathic pulmonary fibrosis (IPF), left heart failure (LHF) and pulmonary arterial hypertension (PAH).
Methods
Healthy volunteers (n=23) and patients with COPD (n=8), IPF (n=12), LHF (n=6) and PAH (n=10) underwent 129Xe gas transfer imaging and dynamic spectroscopy. For each patient, three-dimensional maps were generated to depict ventilation, barrier uptake (129Xe dissolved in interstitial tissue) and red blood cell (RBC) transfer (129Xe dissolved in RBCs). Dynamic 129Xe spectroscopy was used to quantify cardiogenic oscillations in the RBC signal amplitude and frequency shift.
Results
Compared with healthy volunteers, all patient groups exhibited decreased ventilation and RBC transfer (both p≤0.01). Patients with COPD demonstrated more ventilation and barrier defects compared with all other groups (both p≤0.02). In contrast, IPF patients demonstrated elevated barrier uptake compared with all other groups (p≤0.007), and increased RBC amplitude and shift oscillations compared with healthy volunteers (p=0.007 and p≤0.01, respectively). Patients with COPD and PAH both exhibited decreased RBC amplitude oscillations (p=0.02 and p=0.005, respectively) compared with healthy volunteers. LHF was distinguishable from PAH by enhanced RBC amplitude oscillations (p=0.01).
Conclusion
COPD, IPF, LHF and PAH each exhibit unique 129Xe MRI and dynamic spectroscopy signatures. These metrics may help with diagnostic challenges in cardiopulmonary disease and increase understanding of regional lung function and haemodynamics at the alveolar–capillary level.
Introduction
Over the past 30 years, mortality related to both chronic obstructive pulmonary disease (COPD) and interstitial lung disease (ILD) has increased in the USA [1]. Among the factors associated with increased mortality in both COPD and ILD is the frequent presence of comorbid cardiovascular disease such as heart failure [2, 3]. Acute respiratory symptoms in patients with comorbid heart failure and lung disease can often have mixed cardiac and pulmonary origin, which complicates the interpretation of standard diagnostic testing [4]. For example, in patients with concomitant COPD and heart failure, interpretation of spirometry may be challenging [5] and echocardiographic acoustic windows may be impeded by gas trapping [6]. Similarly, pulmonary oedema can mimic certain types of ILD on computed tomography (CT) scans [7].
Magnetic resonance imaging (MRI) has become a valuable tool for the evaluation of pulmonary hypertension and heart failure, owing to its noninvasive nature, high reproducibility, and sensitivity to change in morphological, functional and flow-related parameters [8]. Multiparametric cardiac MRI models have high diagnostic accuracy in patients suspected of having pulmonary hypertension [9]. Dynamic contrast-enhanced lung perfusion MRI has high sensitivity compared with scintigraphy in screening for chronic thromboembolic pulmonary hypertension [10] and MRI has been used to predict mean pulmonary arterial pressure (mPAP) in patients with COPD [11]. However, these methods do not directly address ventilation and pulmonary gas exchange nor do they address impairment occurring within the microvasculature.
To address these challenges, MRI using hyperpolarised 129Xe is emerging as a promising means for noninvasive, spatially resolved, assessment of pulmonary function [12]. This method, which is rapid and well tolerated, permits direct three-dimensional (3D) imaging, not only of ventilation distribution, but also pulmonary gas transfer. This is enabled by the free diffusion of xenon from the alveoli, through the interstitial barrier tissues (comprised of alveolar epithelial cells, interstitial tissues, capillary endothelial cells and plasma) and into red blood cells (RBCs) (figure 1); in each of these three compartments 129Xe exhibits distinct frequency shifts [12]. Thus, with two breath-holds of 129Xe, quantitative maps can now be generated to depict the distribution of 129Xe in airspaces, its uptake in barrier tissues and its transfer to RBCs [13, 14]. This imaging approach is now capable of spatially resolving the heterogeneous disease burden for a wide array of conditions, including COPD, idiopathic pulmonary fibrosis (IPF) and pulmonary vascular disease [15, 16]. Furthermore, while 129Xe imaging provides useful quantification of regional functional burden, a more detailed characterisation of whole-lung 129Xe spectroscopic indices provides additional metrics that may help to further discriminate the underlying pathologies. For example, in IPF the spectroscopic ratio of RBC to barrier signal provides a global metric of gas transfer impairment that has been shown to strongly correlate with the diffusing capacity of the lung for carbon monoxide (DLCO) [17]. Moreover, the signal frequency of 129Xe interacting with capillary RBCs is uniquely sensitive to their level of oxygenation [18]. Such 129Xe spectra can be acquired dynamically every 20 ms, revealing temporal oscillations in pulmonary gas exchange that reflect cardiopulmonary haemodynamics [19].
FIGURE 1.
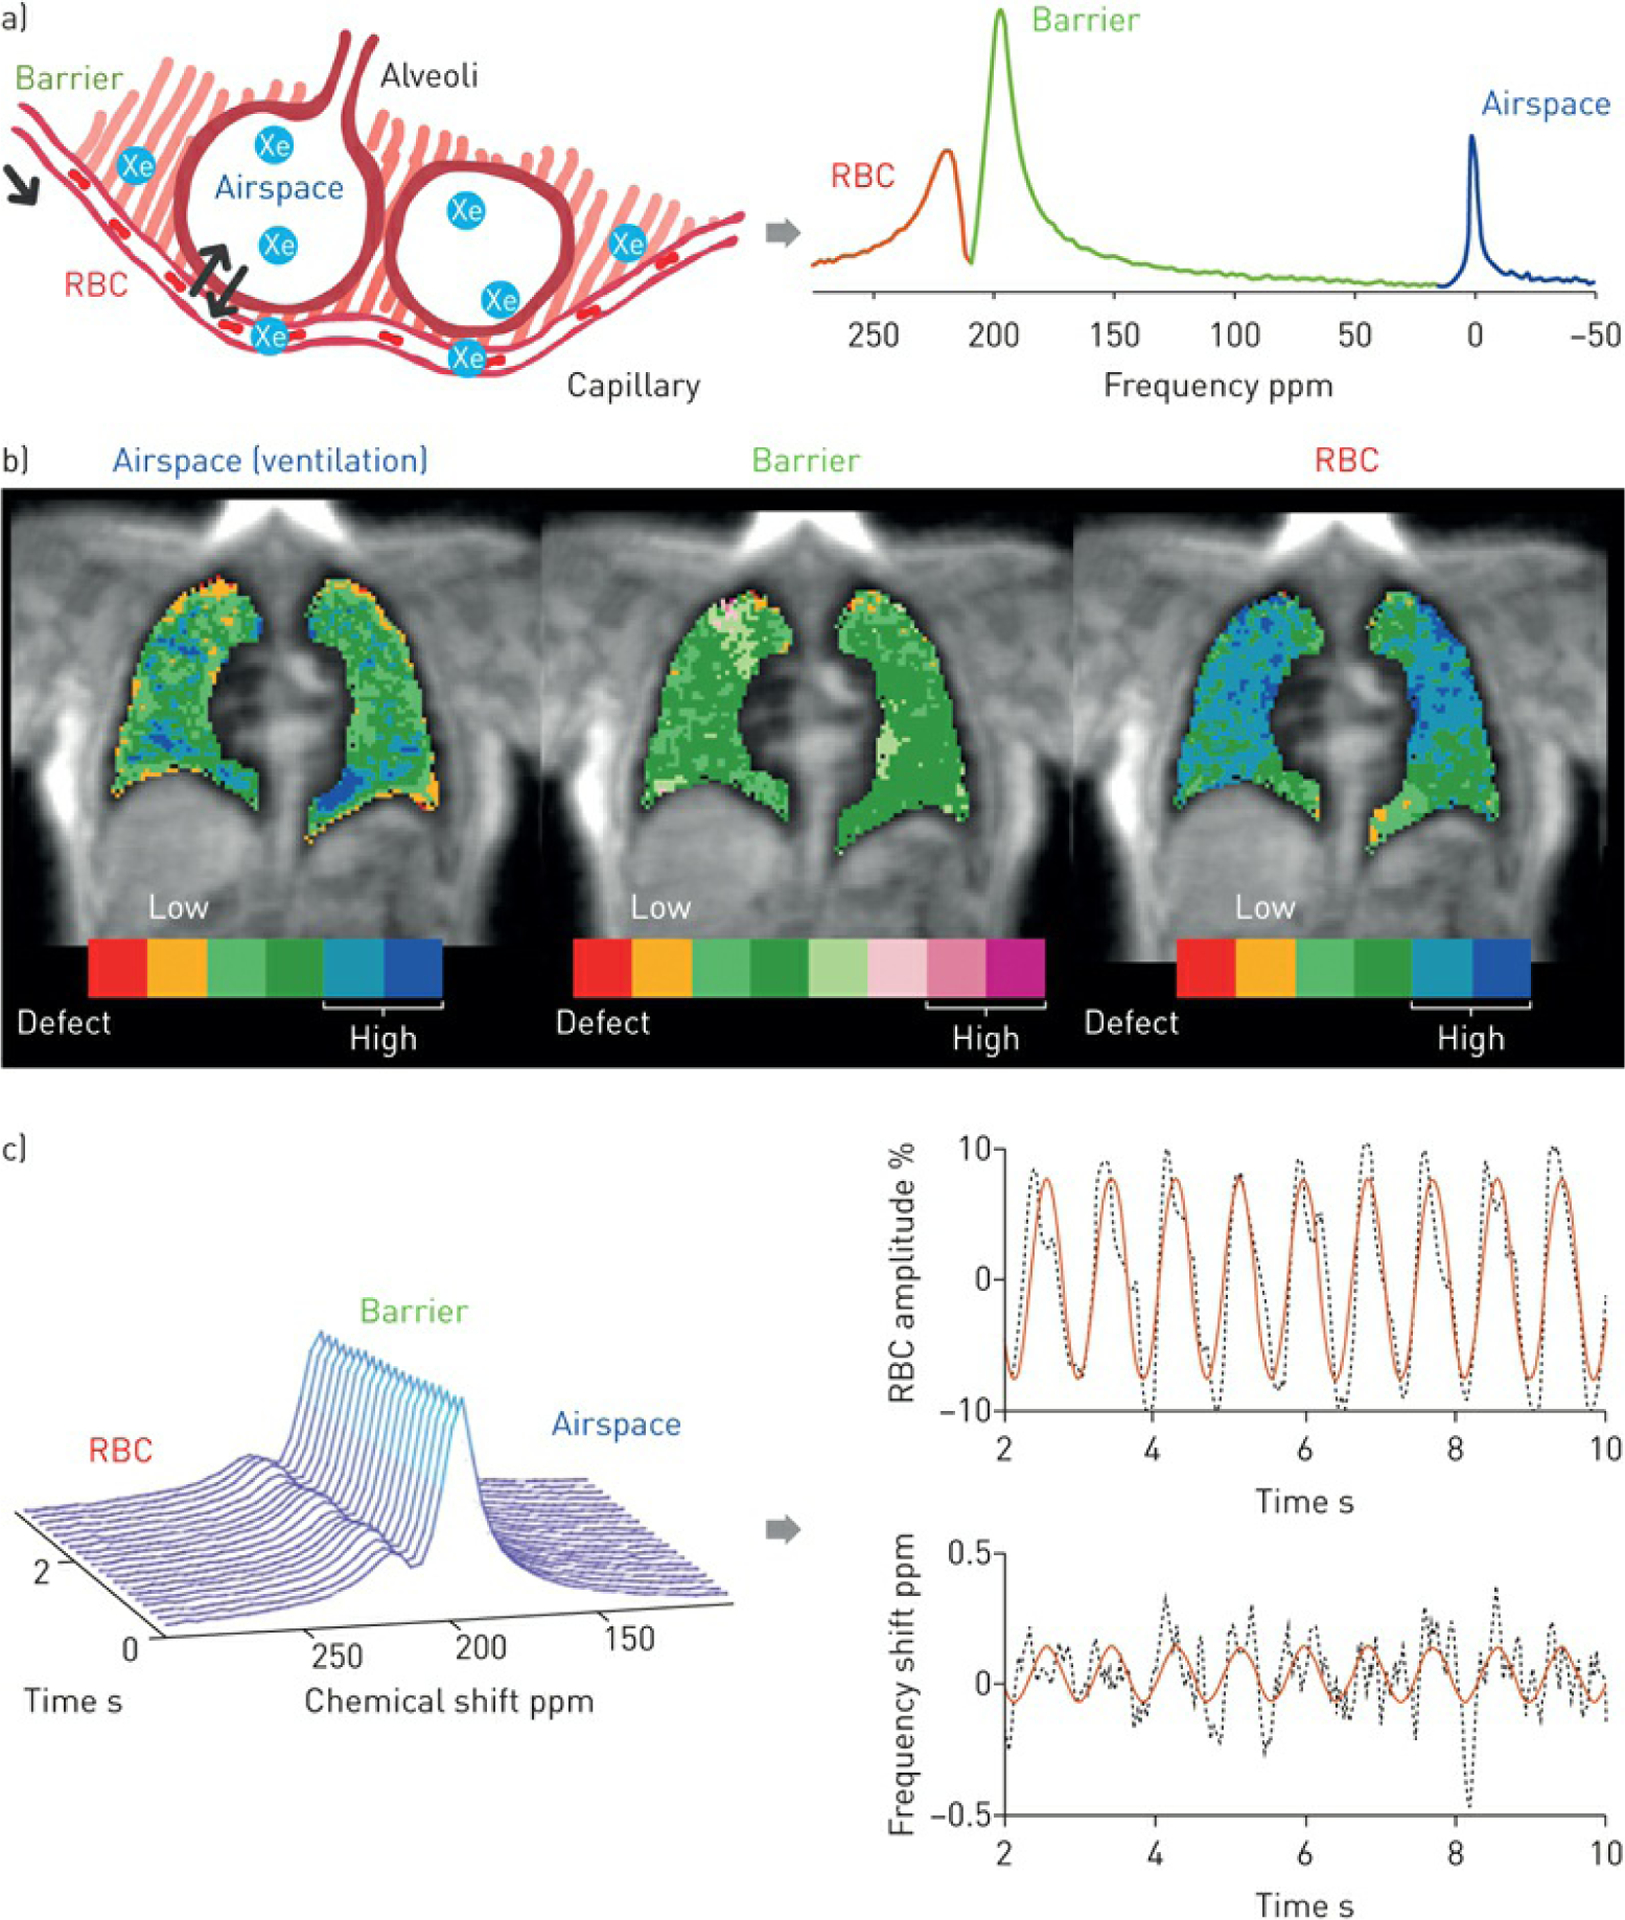
a) Alveolar–capillary model and 129Xe spectrum. 129Xe freely diffuses from airspace to interstitial barrier tissue to red blood cells (RBCs). In these compartments, the 129Xe atom exhibits distinct frequency shifts of 0, 198 and 217 ppm, respectively. b) Three-dimensional (3D) imaging and quantification. These properties are exploited to enable 3D imaging and quantification of 129Xe distribution in airspace (ventilation), its barrier uptake and RBC transfer. These maps are colour coded to represent different signal intensity levels, with the central green bins representing voxels in the normal reference range. c) Dynamic spectroscopy and quantification. 129Xe spectra are acquired dynamically every 20 ms, revealing cardiogenic oscillations of RBC amplitude (%) and frequency shift (ppm).
The array of noninvasive imaging and spectroscopic markers of pulmonary gas transfer and haemodynamics that can be derived from hyperpolarised 129Xe presents an appealing approach for comprehensive and noninvasive phenotyping of cardiopulmonary physiology in individual patients. However, to date most studies have focused on only one form of 129Xe contrast or investigated them in only a single disease. Here, we sought to apply a comprehensive panel of noninvasive 129Xe MRI and spectroscopy to a cohort of patients with known heart and lung disease in order to identify features that could differentiate signatures of COPD, IPF, left heart failure (LHF) or pulmonary arterial hypertension (PAH).
Methods
Subject recruitment
The protocol was approved by the Institutional Review Board of Duke University Medical Center (Durham, NC, USA). Healthy volunteers and patients with a clinical diagnosis of COPD, IPF, LHF or PAH were recruited, and all provided written, informed consent. All healthy volunteers had no smoking history or known respiratory conditions. COPD was diagnosed using spirometric measures of post-bronchodilator forced expiratory volume in 1 s (FEV1)/forced vital capacity (FVC) ≤70% predicted [20]. The diagnosis of IPF was established according to American Thoracic Society/European Respiratory Society criteria, either from a confirmed pattern of usual interstitial pneumonia on CT or from surgical lung biopsy [21]. LHF consisted of patients with both heart failure with preserved ejection fraction (n=4) or heart failure with reduced ejection fraction (n=2), which was confirmed by echocardiogram [22]. The patients with heart failure with preserved ejection fraction had a left ventricular ejection fraction ≥55% and either evidence of an elevated pulmonary capillary wedge pressure (PCWP) >15 mmHg at right heart catheterisation (n=2: PCWP 19 and 38 mmHg) and/or clinical evidence of LHF without echocardiographic or catheterisation evidence of pre-capillary pulmonary hypertension or right heart failure (n=4). PAH was defined according to the World Health Organization criteria and diagnosed by right heart catheterisation with a resting mPAP ≥25 mmHg and a PCWP ≤15 mmHg [23]. Haemodynamics of the PAH group at the time of diagnosis were (median (interquartile range)): mPAP 46 (39–59) mmHg, PCWP 12 (10–14) mmHg, pulmonary vascular resistance 6 (4–8) Wood Units and cardiac index 2.9 (2.4–3.5) L·min−1·m−2 . All clinical tests were performed as a part of routine care. Pulmonary function tests were performed on all patients and 83% of healthy volunteers to assess baseline pulmonary function.
129Xe gas hyperpolarisation and MRI acquisition
129Xe gas was hyperpolarised via continuous flow spin exchange optical pumping and cryogenic accumulation [24], using commercially available systems (Model 9820 and 9810; Polarean, Durham, NC, USA). 129Xe spectroscopy and imaging were acquired on either a 1.5 T (15M4 Excite; GE, Chicago, IL, USA) or a 3 T (Magnetom Trio; Siemens, Erlangen, Germany) scanner during two separate breath-holds of 129Xe. Subjects first underwent dynamic spectroscopy during which 129Xe free induction decays (FIDs) were collected every 20 ms (echo time 0.932 ms, flip angle □20°, dwell time 32 μs, 512/1024 points) during a breath-hold [19]. 3D images were then acquired using an interleaved radial acquisition of gas- and dissolved-phase signal during a 15 s breath-hold. The signal was acquired at an echo time that allowed the two dissolved-phase compartments to be decomposed using the 1-point Dixon method [12]. This generated 3D images of the gas, barrier and RBC components with 2.8 mm isotropic voxels.
Quantitative processing and analysis
3D images of each compartment were rendered into quantitative maps and cast into colour clusters using thresholds derived from healthy reference cohorts established for both 1.5 and 3 T acquisitions [13, 25]. Maps of 129Xe in the barrier tissues and RBCs were normalised on a voxel-by-voxel basis by dividing by the local ventilation signal. The resulting binning maps depict 129Xe ventilation, barrier tissue uptake (129Xe dissolved in interstitial tissue) and RBC transfer (129Xe dissolved in RBCs). Each of these maps was quantified by calculating the percentage of the lung exhibiting signal defects and high signal [13]. The dynamically acquired FIDs were fit in the time domain to determine the gas, barrier and RBC spectral parameters [19]. The time-dependent cardiogenic oscillations in the RBC amplitude and frequency shift were quantified by their peak-to-peak value relative to the mean [19]. Imaging and spectroscopic findings were compared across all cohorts.
Statistical methods
Imaging and spectroscopic features were compared between cohorts. All computations were performed using JMP version 14 (SAS Institute, Cary, NC, USA). First, ANOVA was performed using the nonparametric Kruskal–Wallis test. When a significant difference was detected, the Mann–Whitney U-test was further used for pair-wise analysis. Statistical significance was concluded when p<0.05.
Results
Study cohort
This study included 23 healthy volunteers, 8 patients with COPD, 12 patients with IPF, 6 patients with LHF and 10 patients with PAH. Subject demographics and pulmonary function test results are summarised in table 1. 3D isotropic images of 129Xe in the gas, barrier and RBC compartments were acquired on 19 healthy volunteers and all patients. Dynamic spectroscopy was acquired on 13 healthy volunteers, 6 patients with COPD, 8 patients with IPF, 5 patients with LHF and 10 patients with PAH.
TABLE 1.
Demographic and clinical characteristics stratified by condition
| Healthy volunteers# |
COPD# | IPF# | LHF# | PAH#,¶,+ | |||||
|---|---|---|---|---|---|---|---|---|---|
| Subjects | 23 | 8 | 12 | 6 | 10 | ||||
| Age years | 26 (22–32) | 61.5 (57.0–71.8) | 68 (63.3–71.5) | 63.5 (58.0–69.0) | 50 (46.5–54.0) | ||||
| Female | 5 (22) | 3 (38) | 2 (17) | 2 (33) | 5 (50) | ||||
| Non-White race | 7 (30) | 0 (0) | 0 (0) | 1 (17) | 2 (20) | ||||
| BMI kg·m−2 | 24.0 (23.3–27.4) | 24.3 (22.5–26.5) | 28.8 (24.7–33.0) | 29.4 (25.1–32.3) | 29.6 (24.9,33.9) | ||||
| Current or prior tobacco use | 0 (0) | 6 (75) | 8 (67) | 4 (67) | 3 (30) | ||||
| Supplemental oxygen at rest | 0 (0) | 5 (63) | 4 (33) | 1 (17) | 2 (20) | ||||
| 6MWD m | 395 (324–429), n=4 |
461 (369–515), n=10 |
451 (374–528), n=2 |
500 (426–575) | |||||
| PFTs§ | |||||||||
| FEV1 % pred | 92 (78–102), n=19 | 34 (27–55) | 70 (57–80) | 72 (58–85), n=4 | 83 (63–94), n=9 | ||||
| FVC % pred | 96 (83–103), n=19 | 79 (63–91) | 63 (50–76) | 75 (57–95), n=4 | 96 (68–99), n=9 | ||||
| FEV1/FVC % pred | 81 (78–88), n=19 | 49 (40–54), n=7 | 84 (80–89) | 84 (81–89), n=3 | 82 (74–87), n=4 | ||||
| TLC % pred | 102 (92–113), n=18 | 100 (93–107), n=2 | 48 (43–63), n=3 | 94 (88–100), n=2 | 95 (86–107), n=9 | ||||
| DLCO mL·min−1·mmHg−1 | 28 (22–31), n=17 | 11 (9–15) | 11.5 (9–14) | 21 (15–28) | 16 (13–21) | ||||
| Kco mL·min−1·mmHg−1·L−1 |
5.2 (4.7–5.8), n=17 | 2.7 (1.7–4.0), n=8 | 3.3 (2.9–3.9) | 4.7 (2.7–4.8) | 3.9 (3.4–5.2) | ||||
Data are presented as n, median (interquartile range) or n (%). COPD: chronic obstructive pulmonary disease; IPF: idiopathic pulmonary fibrosis; LHF: left heart failure; PAH: pulmonary arterial hypertension; BMI: body mass index; 6MWD: 6-min walk distance; PFT: pulmonary function test; FEV1 : forced expiratory volume in 1 s; FVC: forced vital capacity; TLC: total lung capacity; DLCO diffusing capacity of the lung for carbon monoxide; KCO : transfer coefficient of the lung for carbon : monoxide; MRI: magnetic resonance imaging.
13 healthy subjects were scanned on a 1.5 T MRI system while 10 were scanned at 3 T; all IPF patients were scanned at 1.5 T, and all COPD, LHF and PAH patients were scanned at 3 T;
PAH patients were on therapy with a combination of prostacyclin analogues, phosphodiesterase-5 inhibitors or endothelin receptor antagonists;
the PAH cohort consisted of seven patients with idiopathic PAH, one patient associated with HIV, one patients associated with drugs/toxins and one patients associated with connective tissue disease;
most recent available clinical values presented (PFTs were performed within 6 months of MRI for all subjects; right heart catheterisations were historical and performed at the tim of initial diagnosis).
Identifying disease-specific imaging-derived metrics
Representative ventilation and gas transfer maps from subjects in each group are depicted in figure 2. For each map, the percentages of voxels falling in the defect, low and high bins are reported. In the healthy volunteer, the majority of the 129Xe signal in all three compartments fell within ±1SD from the mean of the reference distribution and thus in the “normal” green colour bins. By contrast, the COPD subject exhibited significant defects in all three compartments (ventilation, barrier and RBC), indicated by the red colour bins. The IPF subject exhibited relatively normal ventilation, but significant areas of high barrier uptake (purple), accompanied by defects in RBC transfer in the lower lobes. Both the LHF and PAH subjects exhibited slight ventilation defects, relatively normal barrier, but more significant deficits in RBC transfer.
FIGURE 2.
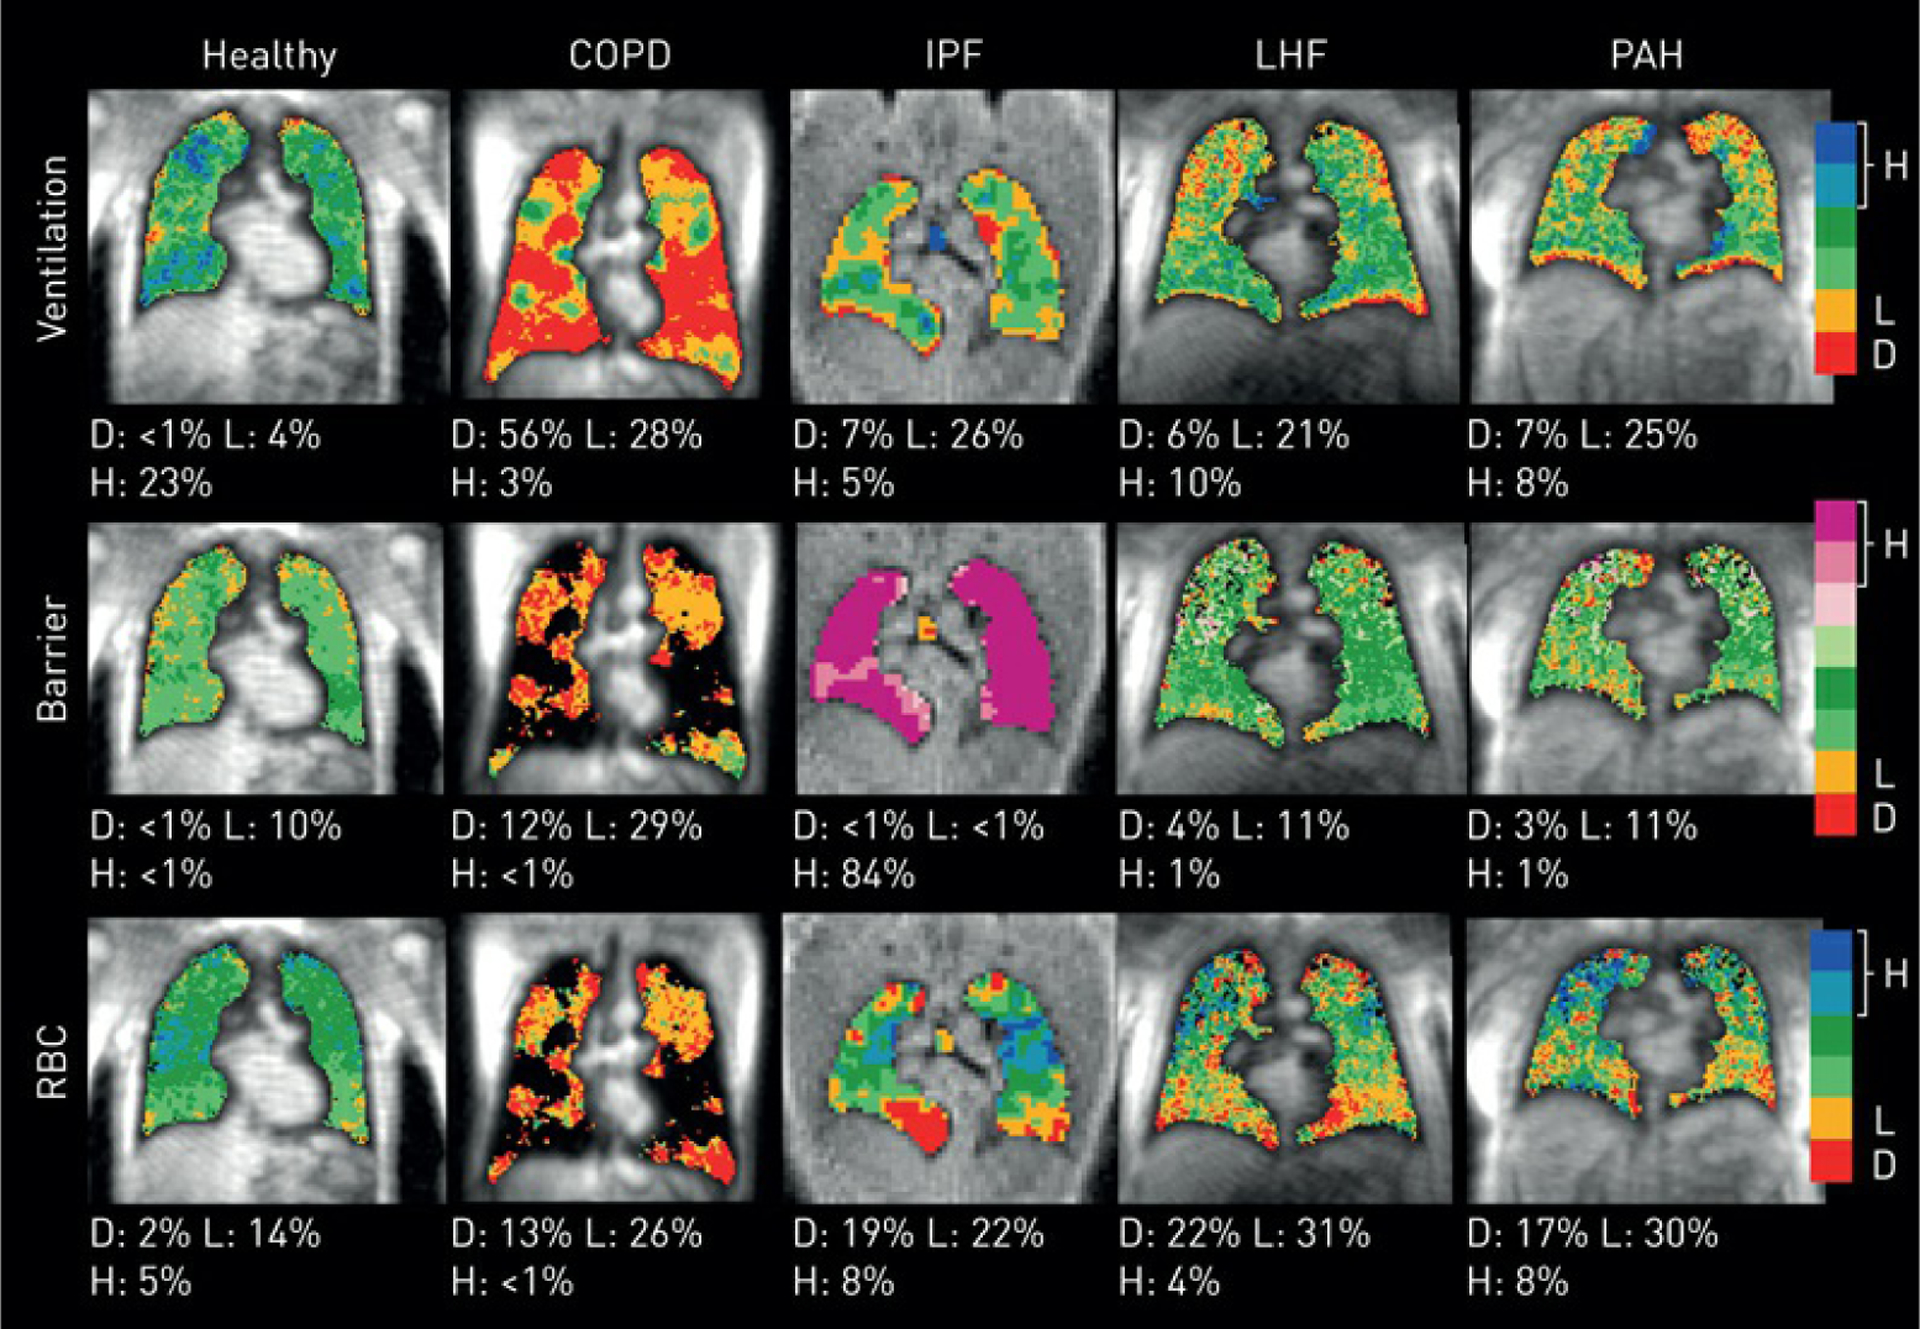
Ventilation, normalised barrier uptake and RBC transfer maps of representative subjects from each cohort. COPD: chronic obstructive pulmonary disease; IPF: idiopathic pulmonary fibrosis; LHF: left heart failure; PAH: pulmonary arterial hypertension. The colour bins represent signal intensity, with red for the lowest, blue/purple for the highest and green representing voxels in the healthy reference range. Each map is quantified by the percentage of defect (D), low (L) and high (H), calculated as the voxel fraction of the lowest, second lowest and the highest two bins for each map, respectively. The voxels with ventilation defect were excluded from the analysis of barrier uptake and RBC transfer maps.
Figure 3 evaluates these imaging features quantitatively across the cohorts, comparing the percentages of ventilation defects, RBC defects, barrier defects and high barrier. Compared with healthy subjects, all patient groups exhibited a larger percentage of defects in ventilation (p≤0.01 for all comparisons) and RBC transfer (p≤0.01 for all comparisons). The COPD cohort stood out for exhibiting the largest percentages of ventilation defects (41.5±22.6%; p≤0.02 for all comparisons) and was the only one to show defects in barrier uptake (10.4±7.1%; p≤0.02 for all comparisons). By contrast, IPF patients were distinguished from the other groups by the largest percentage of voxels with high 129Xe uptake in the barrier tissue (39.8%; p≤0.007 for all comparisons). IPF subjects exhibited only modest ventilation defects (11.5±6.7%; p=0.0003 versus healthy) but substantial RBC defects (11.3±6.7%; p=0.0001 versus healthy). LHF and PAH patients presented with similar imaging characteristics with mildly elevated ventilation defects (LHF: 11.7±6.2%; p=0.01 versus healthy and PAH: 8.4±4.7%; p=0.01 versus healthy) and increased RBC transfer defects (LHF: 13.3±10.2%; p=0.01 versus healthy and PAH: 14.5±9.3%; p=0.002 versus healthy).
FIGURE 3.
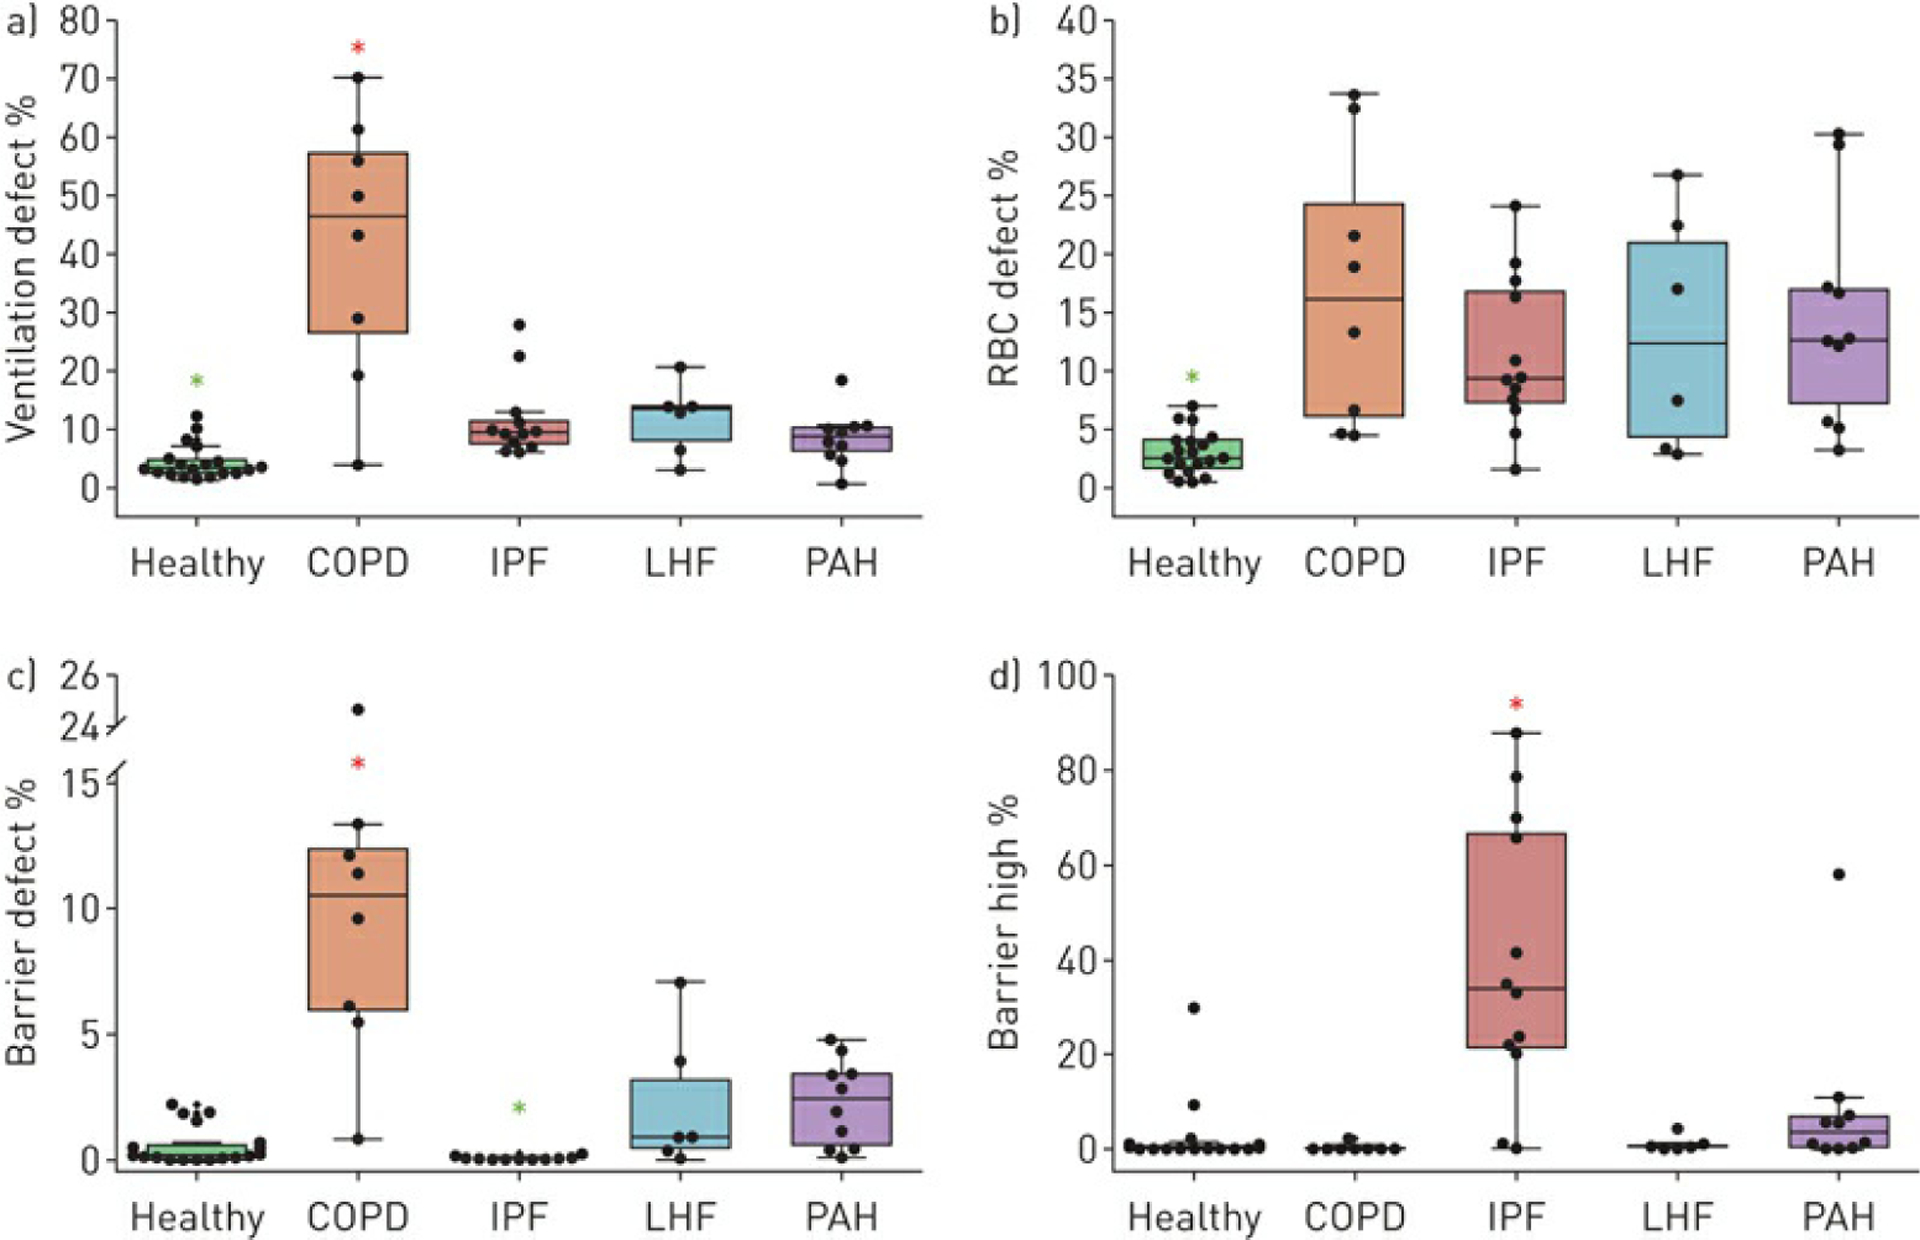
a) Ventilation defect, b) red blood cell (RBC) defect, c) barrier defect and d) barrier high percentage comparisons for all cohorts. COPD: chronic obstructive pulmonary disease; IPF: idiopathic pulmonary fibrosis; LHF: left heart failure; PAH: pulmonary arterial hypertension. Asterisks indicate a significantly increased (red) or decreased (green) value compared with all other cohorts. Compared with healthy subjects, all disease cohorts showed increased ventilation defect (p≤0.01) and RBC defect (p≤0.01). COPD was characterised by significantly elevated percentages of ventilation defects (p≤0.02) and barrier defects (p≤0.02). IPF uniquely exhibited reduced barrier defects (p≤0.02), but elevated percentages of high barrier (p≤0.007).
PAH and LHF exhibited slightly elevated ventilation defects and modestly elevated RBC defects.
Disease-specific spectroscopy-derived metrics
Figure 4 shows the RBC signal amplitude and shift oscillations for representative subjects from each group. Notably, the RBC signal amplitudes for each patient oscillate at a frequency identical to the heart rate. The IPF patient also exhibits such cardiogenic oscillations prominently in the RBC frequency shift.
FIGURE 4.
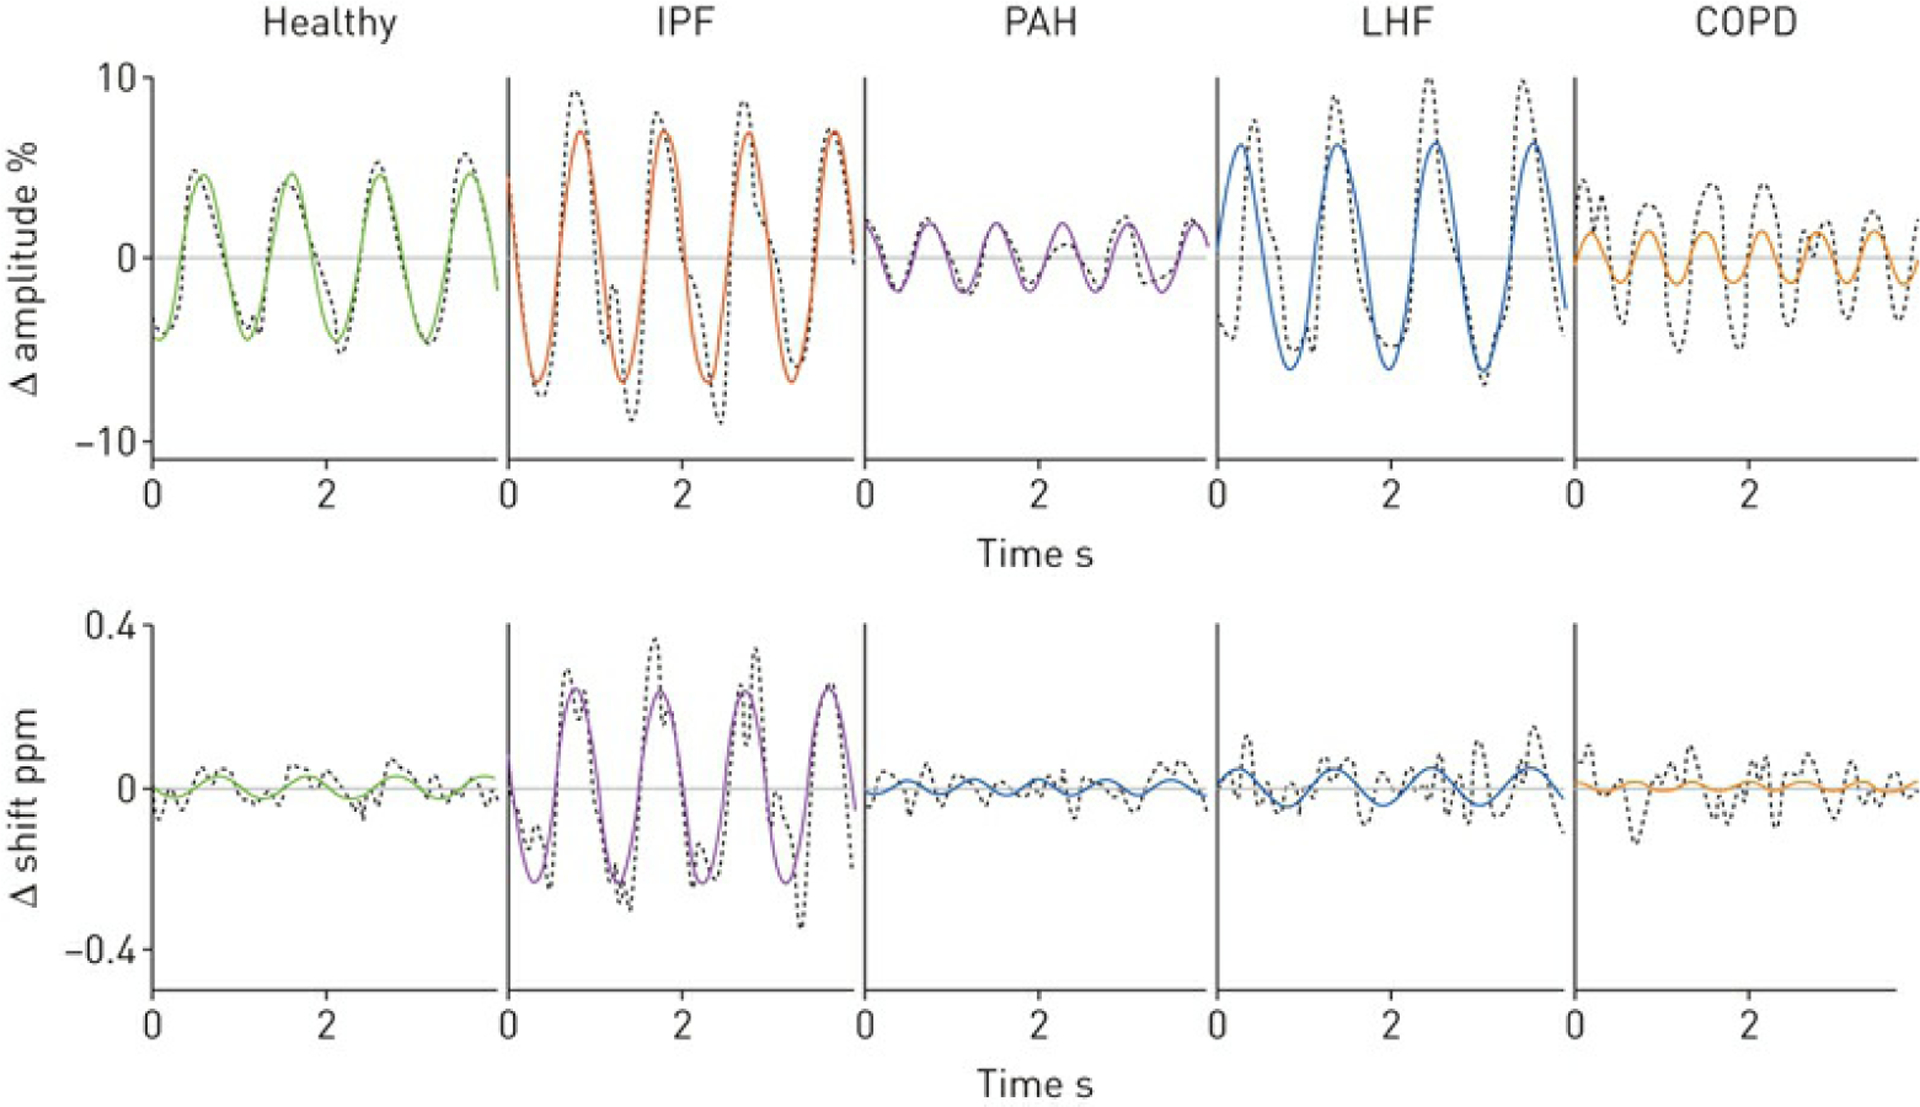
Red blood cell (RBC) signal amplitude and frequency shift demonstrate cardiogenic oscillations in representative patients. IPF: idiopathic pulmonary fibrosis; LHF: left heart failure; PAH: pulmonary arterial hypertension; COPD: chronic obstructive pulmonary disease. The IPF and LHF patients exhibit enhanced RBC amplitude oscillations. By contrast, RBC signal oscillations are diminished in the PAH and COPD patients. Only the IPF patient exhibits oscillations in the RBC shift.
Figure 5 shows the group-wise comparison of the cardiogenic RBC amplitude and shift metrics. In healthy subjects, the RBC amplitudes oscillated at a height of 10.0±2.6% peak-to-peak with very little RBC shift oscillation (0.07±0.05 ppm). The RBC shift only oscillates significantly in the IPF cohort (0.46±0.33 ppm; p≤0.01 for all comparisons). IPF patients also exhibited larger RBC amplitude oscillations (16.7±5.5%; p=0.007) compared with healthy volunteers. RBC amplitude oscillations were diminished in both COPD and PAH compared with healthy volunteers (COPD: 5.5±4.7%; p=0.02 and PAH: 6.0±3.6%; p=0.005). In subjects with LHF, the RBC amplitude oscillations were larger than in healthy volunteers, but this did not reach statistical significance (13.0±5.1%; p=0.2). However, these oscillations were significantly higher compared with subjects with PAH (p=0.01).
FIGURE 5.
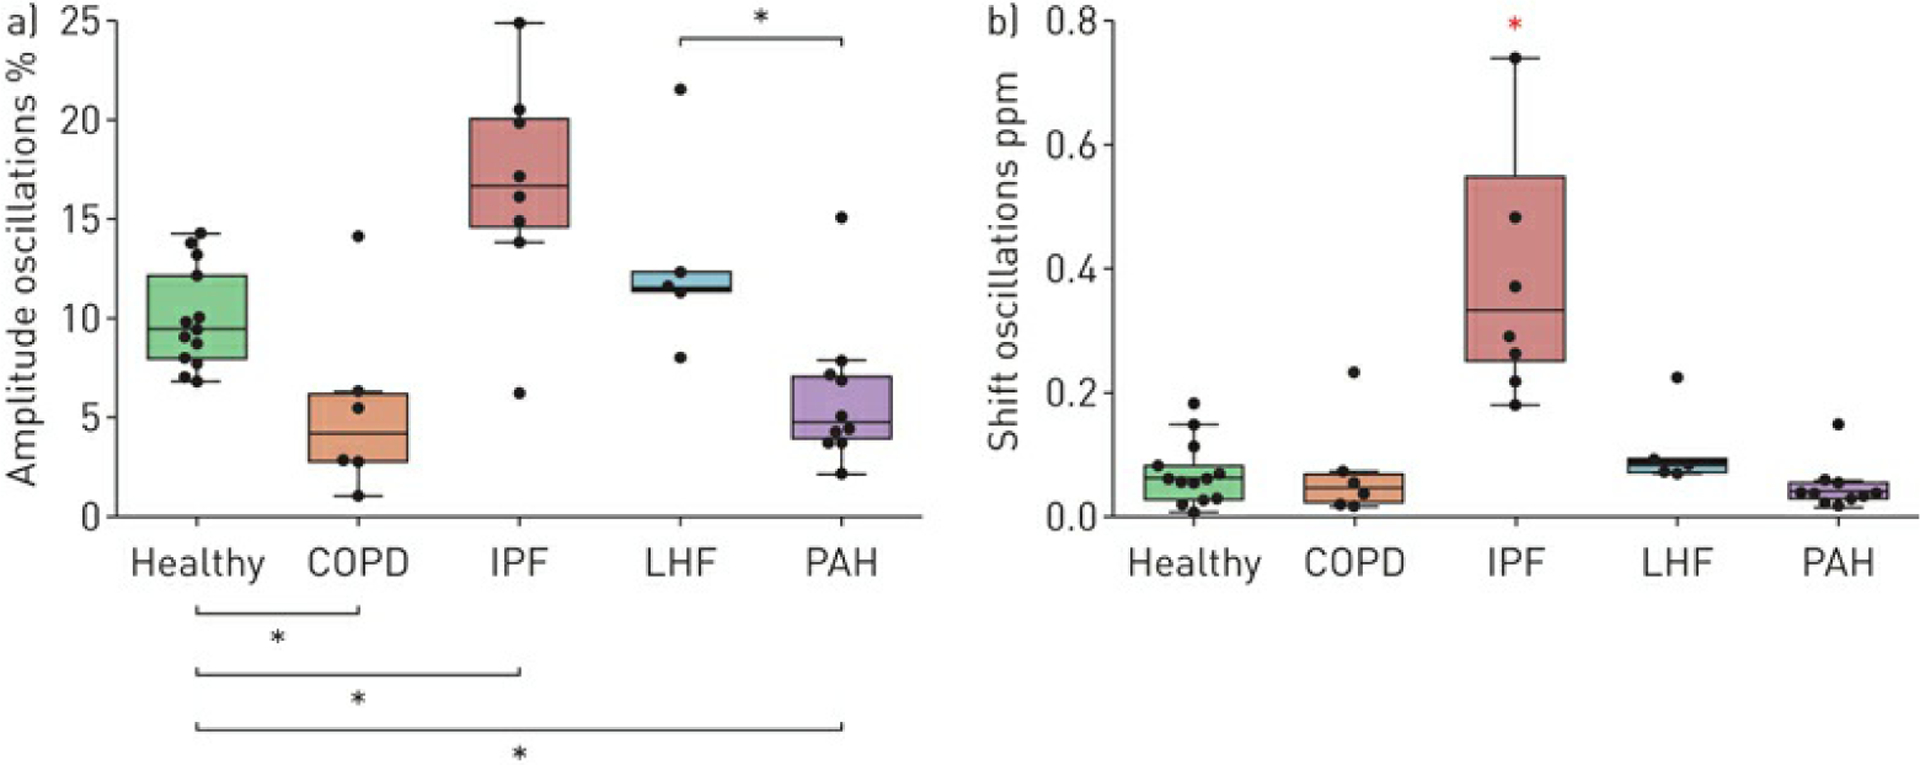
Red blood cell (RBC) a) amplitude and b) frequency shift oscillations compared across cohorts. COPD: chronic obstructive pulmonary disease; IPF: idiopathic pulmonary fibrosis; LHF: left heart failure; PAH: pulmonary arterial hypertension. Black asterisks indicate a significant difference between cohorts and the red asterisk indicates an increased value compared with all other cohorts. Compared with healthy subjects, COPD (p=0.02) and PAH (p=0.005) exhibited decreased RBC amplitude oscillations, while they were increased in IPF (p=0.007). Moreover, in LHF the RBC amplitude oscillations were significantly increased compared with PAH (p=0.01). IPF patients exhibited significantly increased RBC shift oscillations compared with all other cohorts (p≤0.01).
Discussion
In this study, we identified unique 129Xe MRI and spectroscopy signatures for patients with COPD, IPF, PAH and LHF. COPD was characterised by significantly elevated ventilation and barrier defect percentages compared with all other disorders, as well as diminished RBC amplitude oscillations. However, in the COPD cohort the ventilation defect percentage varied widely in both scale and distribution, consistent with the heterogeneity of the disease [26]. In contrast, IPF was characterised primarily by elevated barrier uptake, virtually absent barrier defect percentage, elevated RBC amplitude oscillations and prominent oscillations in RBC shift. PAH and LHF presented with similar imaging characteristics (slight elevations in ventilation, barrier and RBC defect percentages compared with healthy volunteers). However, PAH was distinguished from LHF by RBC amplitude oscillations that were lower than in healthy subjects, whereas in LHF such oscillations were enhanced. All four disease cohorts exhibited increased RBC transfer defects compared with healthy subjects.
The observation that ventilation defects are prominent in patients with COPD is consistent with numerous previous studies [14, 27, 28]. We now add the observation that, in COPD, barrier uptake is also diminished, likely reflecting emphysematous lung destruction and loss of surface area for gas exchange. This loss would further lead to diminished RBC transfer. In IPF we confirm that the disease is characterised by increased barrier uptake with defects in RBC transfer primarily in the lung bases [14]. Furthermore, we provide important context for our prior work showing that cardiogenic oscillations in 129Xe RBC amplitude and shift are significantly enhanced in patients with IPF relative to healthy controls [19]. Having now acquired such data in this broader cohort, this suggests that the RBC shift oscillations are, thus far, unique to IPF, and are not observed in COPD, LHF and PAH. Moreover, the enhanced RBC amplitude oscillations seen in IPF are only additionally seen in LHF, suggesting that perhaps this is a marker of post-capillary pulmonary hypertension.
Connecting 129Xe MRI to conventional metrics of gas exchange
The ability of 129Xe MRI to produce 3D quantitative maps of ventilation, barrier uptake and RBC transfer invites an effort to relate these imaging features to diffusing capacity (DLCO) and its underlying rate constant, the transfer coefficient of the lung for carbon monoxide KCO (DLCO divided by accessible alveolar volume VA). This appeals to the framework of Roughton and Forster [29], which treats the pulmonary diffusing capacity DL as being comprised of two serial conductances:
where DM is the membrane conductance and θVc is attributable to the capillary blood volume Vc and its reaction rate θ with CO. The membrane term DM is directly proportional to the alveolar surface area available for gas exchange, but inversely proportional to barrier thickness. Both these aspects are inherently seen in the 129Xe barrier/gas signal distribution. When mean barrier/gas (Bar) decreases, it indicates a loss of surface area, and when it increases, it indicates barrier thickening. This suggests that a patient’s Bar compared with a healthy reference value, (or its inverse when Bar>Barref), can serve as a surrogate for DM. , constructed in this fashion, is akin to a relative rate constant, and we thus multiply by VA and a proportionality constant α to arrive at the membrane conductance . In a similar manner, mean RBC/gas signal relative to reference reflects the capillary blood volume conductance according to . Thus, with knowledge of α and β the overall diffusing capacity can be calculated from these xenon MRI metrics as:
Notably, the left-hand side of the equation is simply the inverse of the transfer coefficient KCO. Combined with alveolar volume VA, it is also possible to estimate DLCO. Using the 129Xe MRI metrics from this full patient cohort, the relevant reference population values [13, 30] and KCO data, we found α=11.0 and β=12.8 mL·min−1·mmHg−1 L−1 provided a best fit. This is represented in figure 6a, showing a 3D surface that reflects the way in which relative barrier and RBC contribute to KCO. Similarly, the correlations of the image-estimated KCO and DLCO values with the measured values are shown in figure 6b and c. Within this framework we see that imaging predictions of KCO are relatively strong and when multiplied by VA generate an image-predicted DLCO that is remarkably well correlated with the measured value. This approach, which will need to be confirmed prospectively, provides a strong foundation for using 129Xe MRI to interpret DLCO across a range of patient populations with all combinations of low and high barrier and as well as capillary blood volumes.
FIGURE 6.
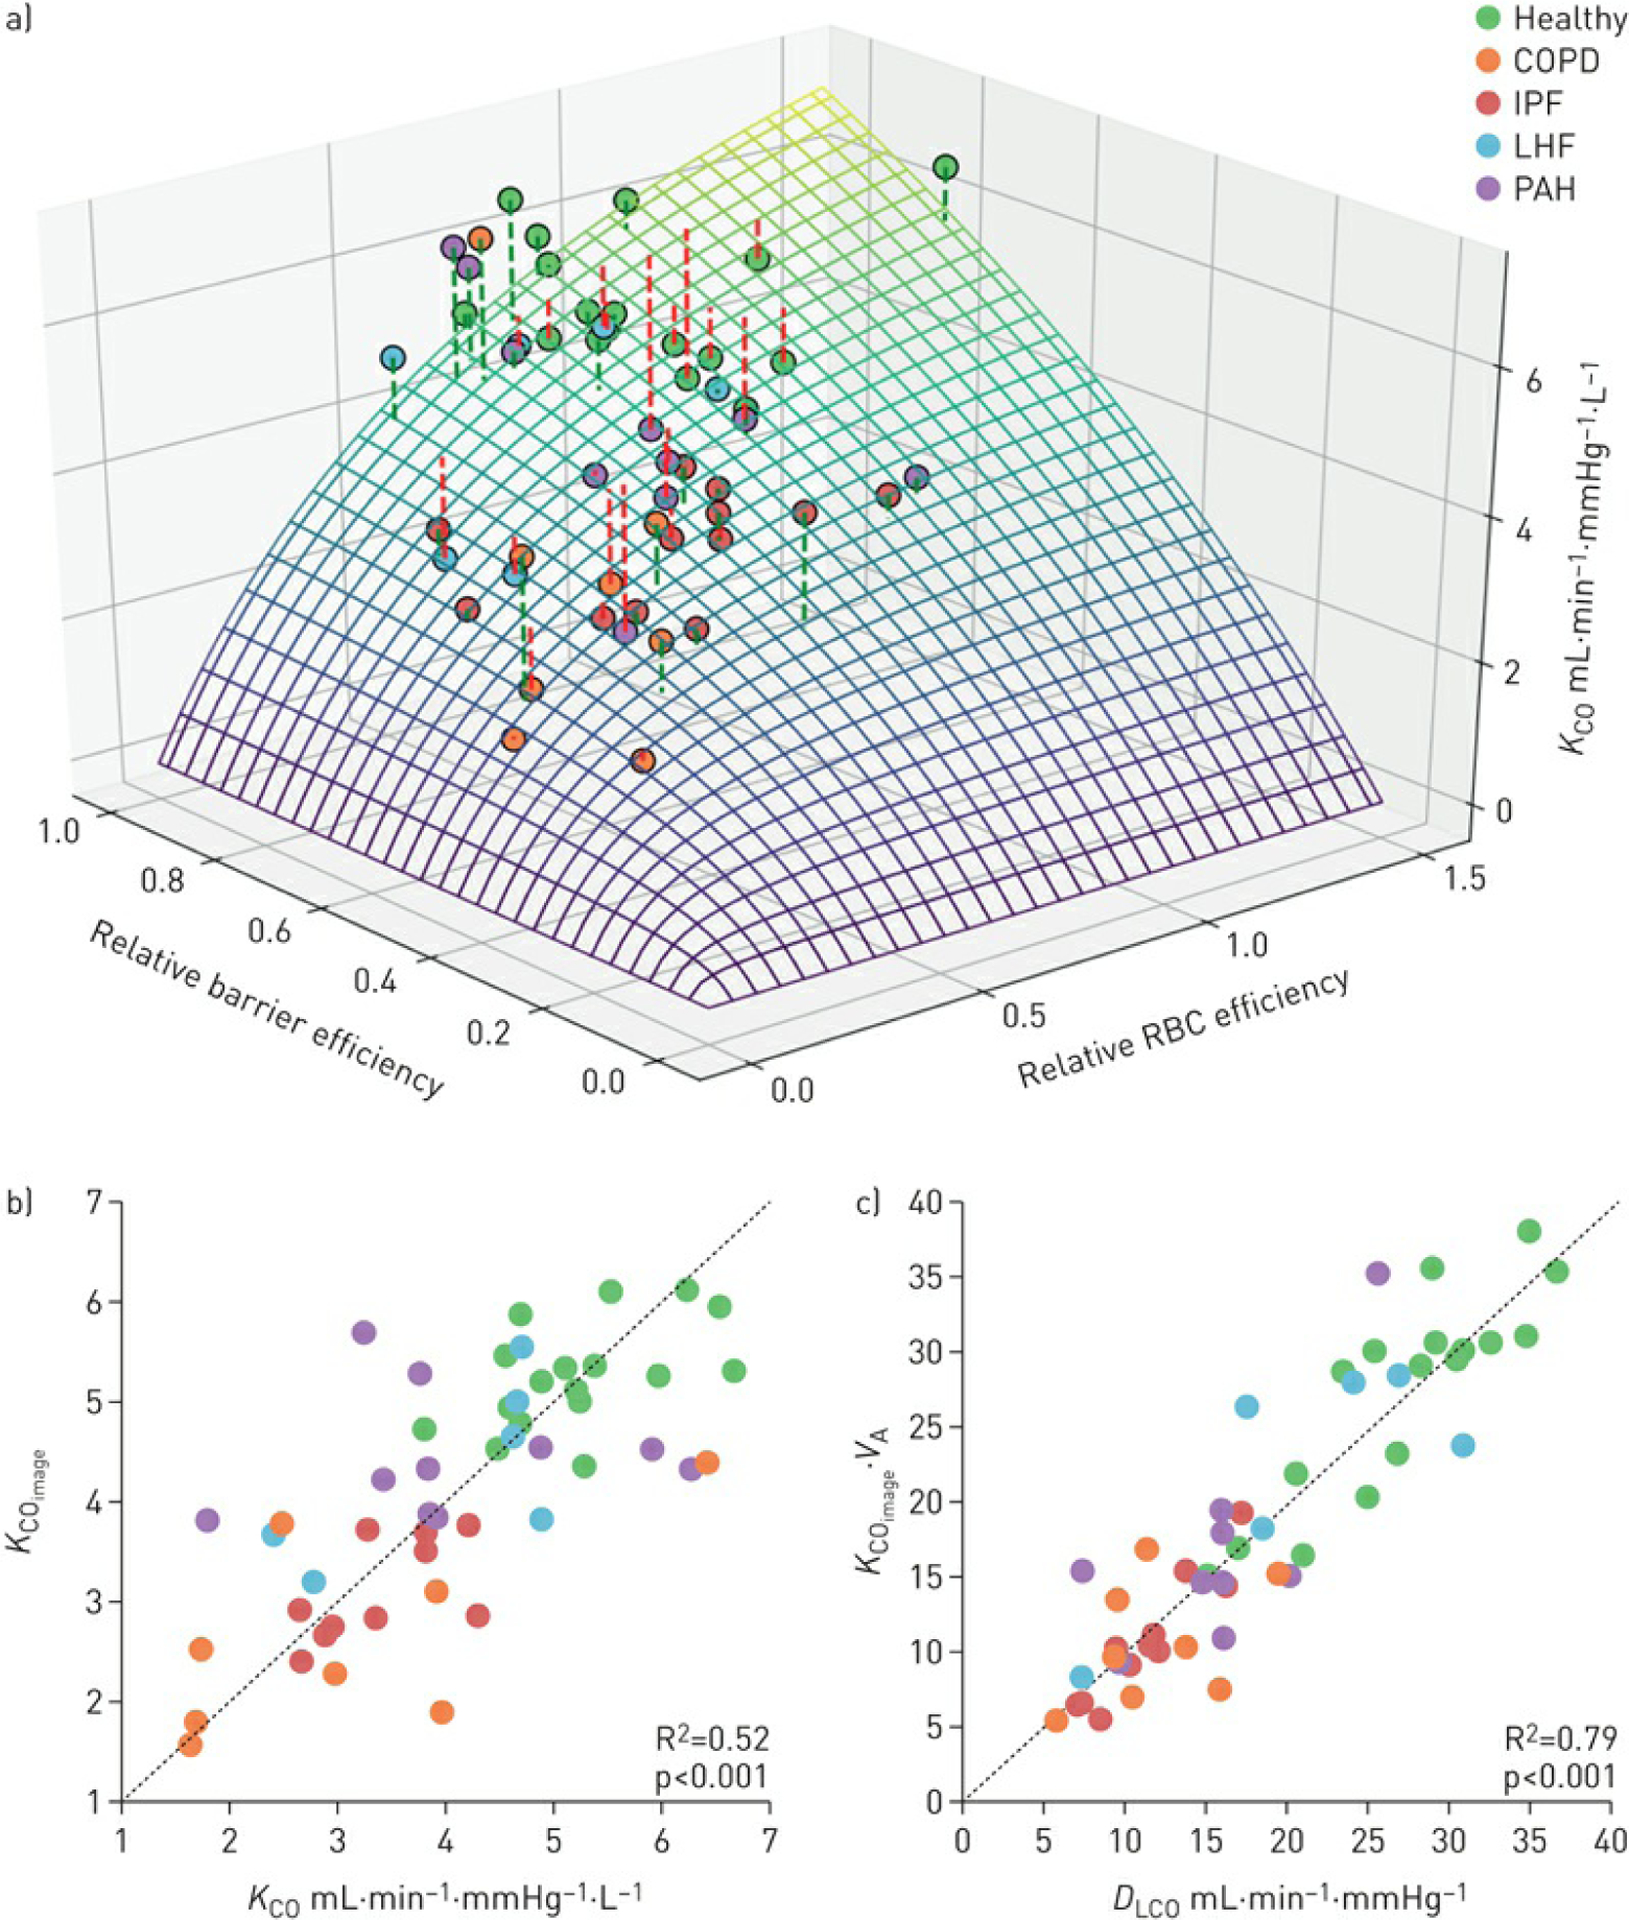
a) Three-dimensional surface plot reflects the relative contribution of barrier and red blood cells (RBCs) to the transfer coefficient of the lung for carbon monoxide (KCO). COPD: chronic obstructive pulmonary disease; IPF: idiopathic pulmonary fibrosis; LHF: left heart failure; PAH: pulmonary arterial hypertension. b) The image-estimated KCO shows strong correlation with the measured KCO. c) This estimated KCO, when combined with measured alveolar volume (VA), produces an estimated diffusing capacity of the lung for carbon monoxide (DCO) that shows an even stronger correlation with the measured DLCO values
Alveolar–capillary interface models depicting disease phenotypes
To aid in interpreting the patterns of 129Xe MRI and spectroscopic signatures of each disease in the context of gas transfer physiology, we propose the following conceptual alveolar–capillary interface architecture (figure 7). In a healthy subject, 129Xe atoms freely diffuse into the alveoli and into the alveolar–capillary interface, translating into images reflecting a normal range of ventilation, barrier uptake and RBC transfer. In COPD, chronic airway inflammation and small airway obstruction [31] create ventilation defects, while the loss of alveolar surface area associated with emphysema results in diminished uptake of 129Xe in the interstitial barrier tissues. This drives a concomitant decrease in RBC transfer, consistent with the low DLCO values observed in this cohort. However, we note that many patients exhibit disproportionately worse RBC transfer that may reflect an additional loss of vasculature [32]. By contrast, in IPF, interstitial fibrosis creates a larger reservoir for 129Xe uptake, thus enhancing the barrier signal [33], and in conjunction with regions of RBC transfer defects, reduces DLCO [15]. It is less clear what causes the defects in RBC transfer in LHF, but it is known that these patients can develop gas exchange abnormalities including a reduction in DLCO that is thought to be secondary to chronic damage resulting from pulmonary venous congestion [34, 35]. Finally, PAH is characterised by increased pre-capillary impedance, resulting from remodelling and obliteration of the pulmonary arterioles. This results in a loss of alveolar membrane diffusing capacity and pulmonary capillary blood volume as reflected in figure 7.
FIGURE 7.
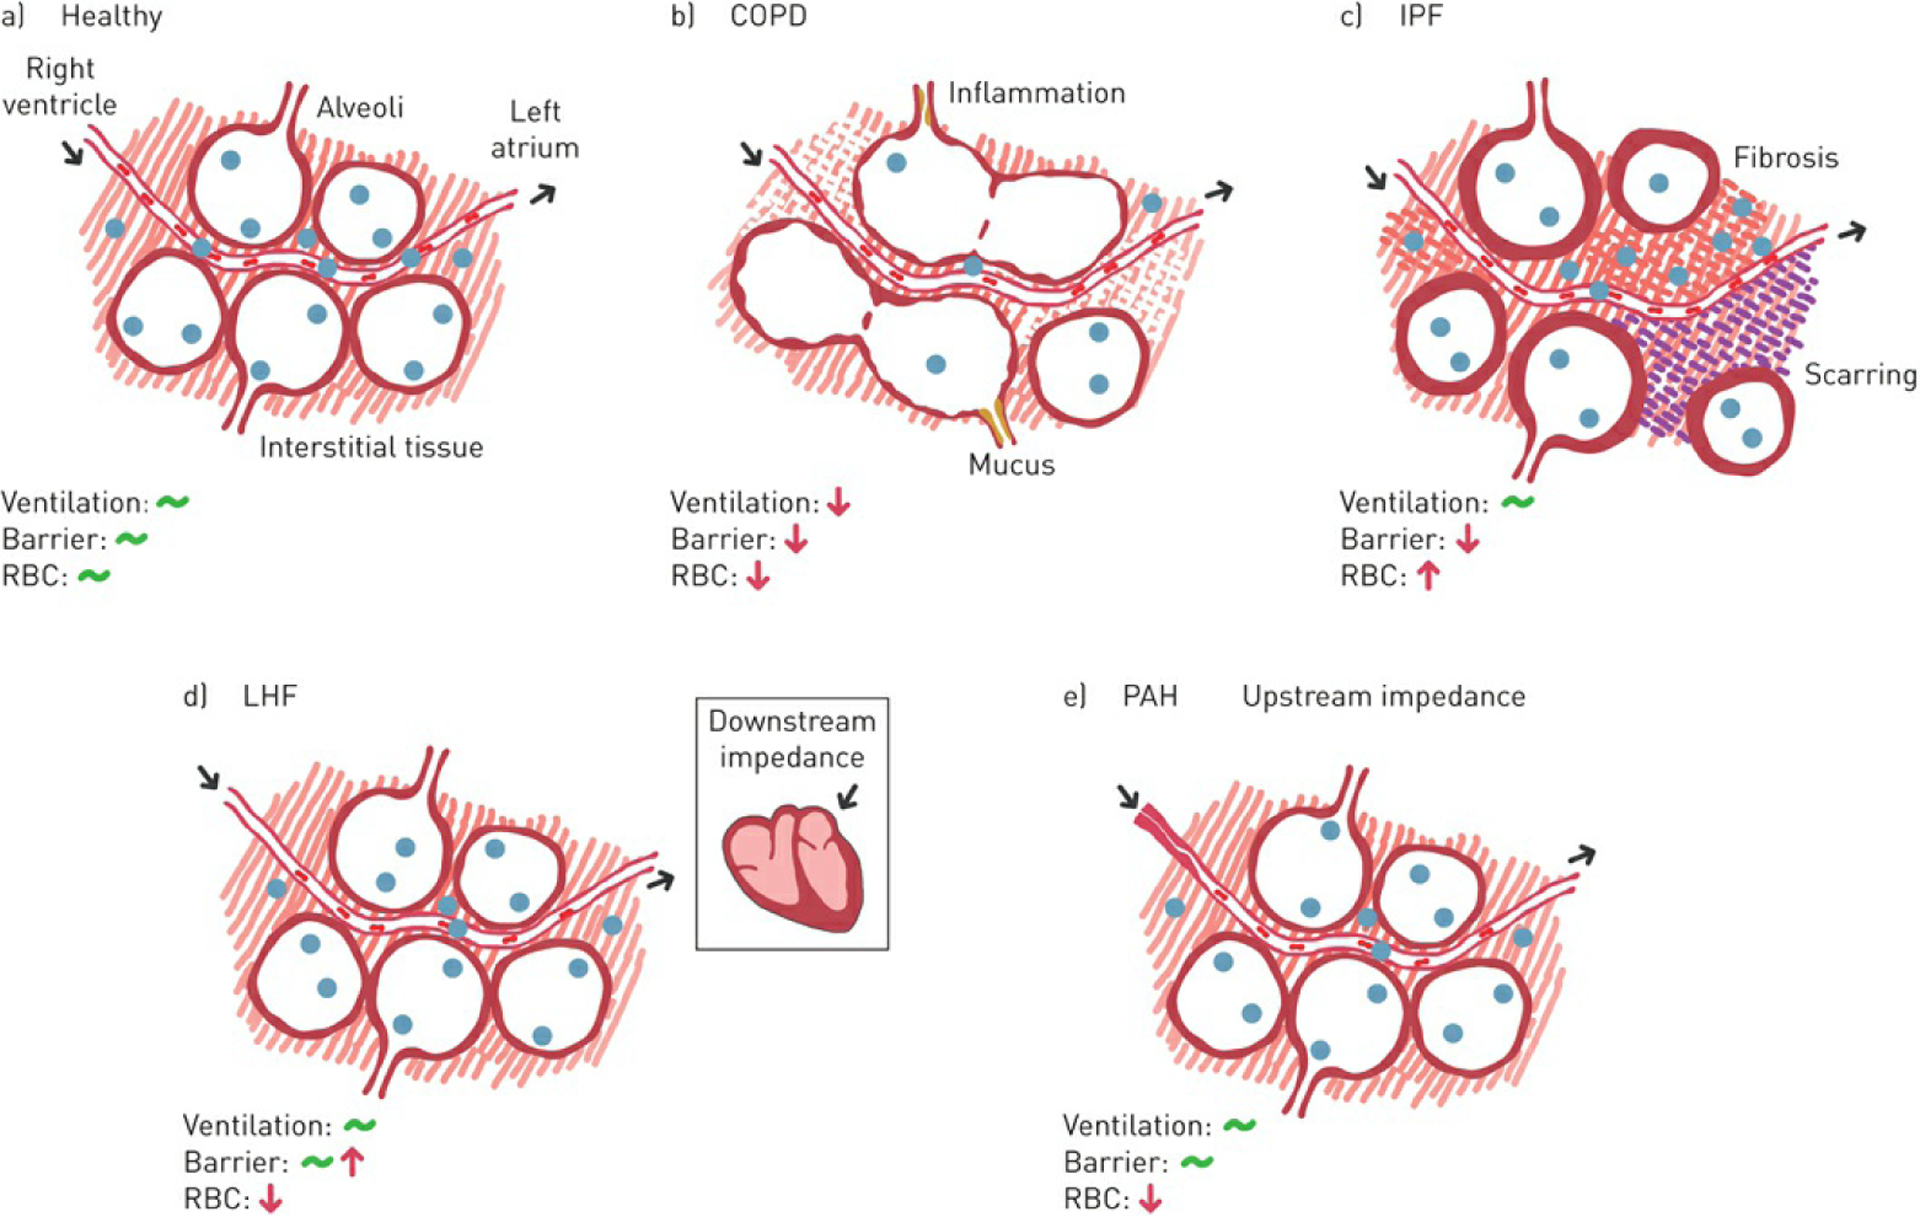
Conceptual architectures of the alveolar–capillary interface to aid in interpreting the 129Xe imaging and spectroscopic biomarkers across disease state: a) healthy volunteers, b) chronic obstructive pulmonary disease (COPD), c) idiopathic pulmonary fibrosis (IPF), d) left heart failure (LHF) and e) pulmonary arterial hypertension (PAH). RBC: red blood cell. The diagrams illustrate the alveoli, capillary blood vessel, interstitial barrier tissues, RBCs and 129Xe atoms (see figure 1). For each disease state the anticipated effect on the 129Xe biomarker is shown.
RBC amplitude oscillations reflect changes in 129Xe transfer driven by differences in capillary blood volume during the cardiac cycle. These, in turn, depend on the right ventricular stroke volume, driving flow though the pre- and post-capillary impedances. In IPF, for example, the stroke volume is delivered to a partially destroyed capillary bed [15]. If stroke volume is preserved, it will produce larger relative capillary blood volume oscillations between systole and diastole, thereby provoking larger RBC amplitude oscillations. Such enhancement is also seen in pulmonary venous hypertension caused by left-sided heart failure. In these patients, enhanced cardiogenic RBC oscillations are consistent with diastolic reserve limitation during the cardiac cycle [36], caused by a high post-capillary impedance. This results in a relative increase in pulmonary capillary blood volume, as right ventricular output transiently exceeds left ventricular output that leads to blood pooling in the pulmonary circulation [34]. In PAH, while capillary blood volume is also reduced [37], the larger impedance to flow in the arterioles causes RBC oscillations to be reduced. It is these amplitude oscillations that appear to be the feature that most strongly differentiates pre-capillary from post-capillary PH. It is possible that this could be even more clearly demonstrated by correcting the RBC oscillation amplitude for patient-specific stroke volume and capillary bed volume. Thus, future studies could benefit from the addition of cardiac MRI to determine stroke volume and allow for such refinement.
Unique to the IPF patients in this cohort is the observation that the RBC resonant frequency also exhibits cardiogenic oscillations. As the 129Xe RBC frequency is strongly dependent on blood oxygenation level [18], we hypothesise that this indicates variability in the blood oxygenation. In IPF subjects, diffusion impairment likely causes large excursions in blood oxygenation as the capillary blood volume is replaced over the course of the cardiac cycle. This likely explains why the RBC frequency shift oscillates cardiogenically in conditions where blood oxygenation is diffusively impaired [19]. Such oscillations are not observed in COPD where gas exchange impairment results from loss of membrane surface area rather than membrane conductance. We should note that all the aforementioned interpretations and proposed models will require confirmation in both in vitro systems and in vivo animal models where each condition can be carefully controlled.
Potential for differentiating cardiopulmonary diseases in the clinical setting
Taken together, this combination of noninvasive 129Xe MRI and spectroscopic parameters enables interrogation of gas transfer at the alveolar–capillary level that appears useful, not only to characterise disease burden, but also to identify signatures that may ultimately help differentiate cardiopulmonary disorders. A potential approach to such differentiation is seen in figure 8, which shows radar plots of the four key imaging features and two key spectroscopic features: ventilation defect, barrier defect, high barrier uptake, RBC defects, and RBC amplitude and shift oscillations. Integrating these features for each disease group provides an initial means of displaying these phenotypes in a visually distinct way. Generating such plots for individual patients could provide a powerful means to identify the primary phenotypes that should be considered.
FIGURE 8.
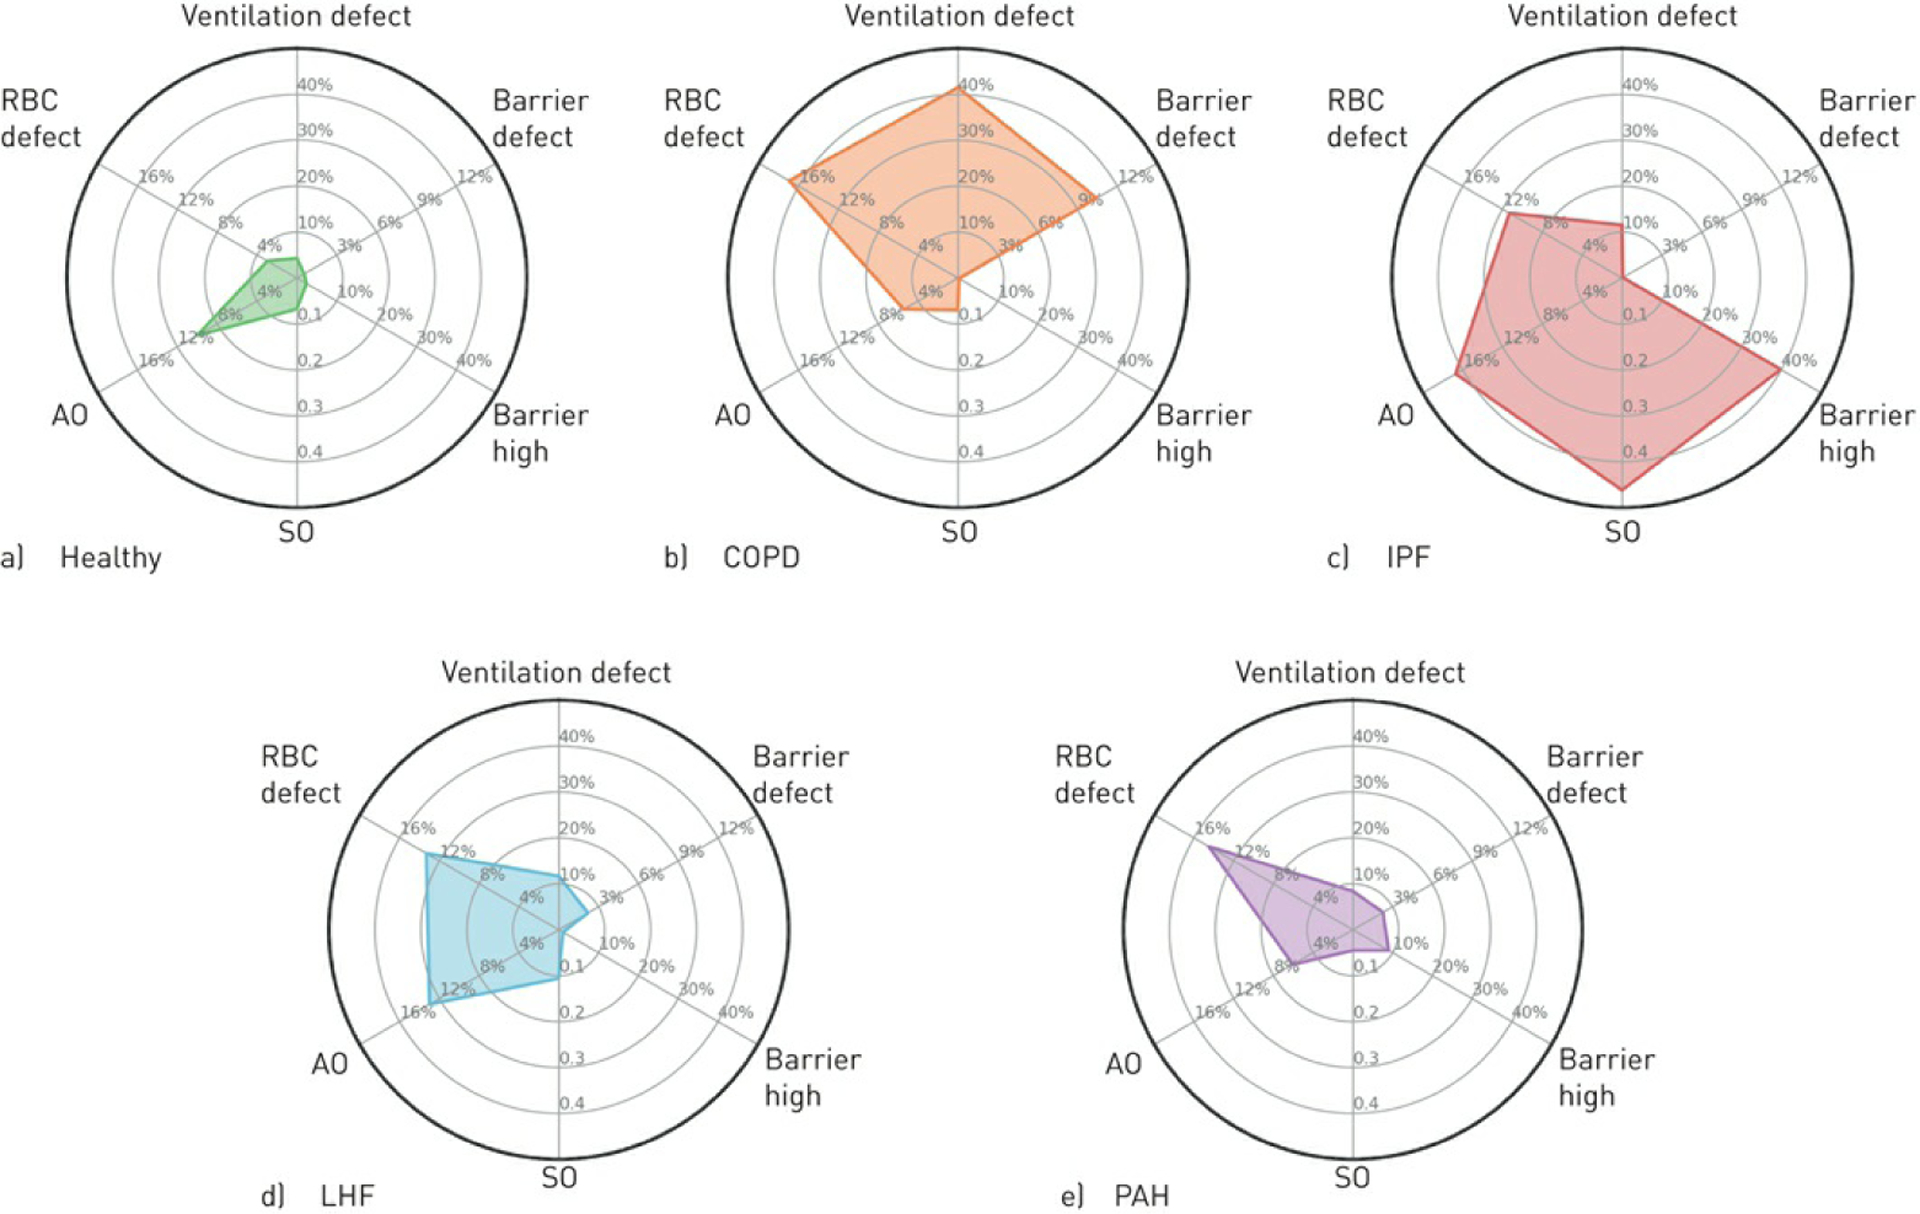
Radar plots to display the primary 129Xe magnetic resonance imaging and spectroscopic signatures associated with a) healthy volunteers, b) chronic obstructive pulmonary disease (COPD), c) idiopathic pulmonary fibrosis (IPF), d) left heart failure (LHF) and e) pulmonary arterial hypertension (PAH). RBC: red blood cell. Here the mean cohort values of the key markers are plotted on one of the six radials: ventilation defect, barrier defect, barrier high and RBC defect percentages derived from imaging, and RBC shift oscillation (SO) and amplitude oscillation (AO) from spectroscopy.
While our study benefited from using well-characterised patient cohorts, work in patients with mixed cardiopulmonary disease may demonstrate the utility of 129Xe MRI to determine the underlying cause of dyspnoea in patients with concomitant diseases. Furthermore, as early diagnosis is increasingly emphasised in disorders such as ILD [38] and PAH [39], 129Xe spectroscopic indices may provide a sensitive probe for this as well as allowing for noninvasive tracking of disease progression. Importantly, the RBC transfer signal depicts the ultimate disease burden for gas transfer function, and therefore might be used to evaluate disease progression and therapeutic response [40]. Given the limitations of current diagnostic testing, the information provided by 129Xe gas transfer imaging and dynamic spectroscopy has the potential to improve patient care.
Study limitations and future directions
We must acknowledge several limitations to this first study comparing 129Xe MRI and spectroscopic signatures across cardiopulmonary conditions. First, the heterogeneity and possible comorbidities of patients in each disease cohort may have limited our ability to identify patterns in 129Xe imaging and spectroscopy. For example, all PAH patients were undergoing clinically indicated, targeted treatment, which may have limited the severity of their PAH at the time of the 129Xe study. Because many did not have a recent right heart catheterisation available, the severity of their disease could not be assessed at the time of their study. Furthermore, while our study aimed to recruit patients with isolated LHF as a model for post-capillary impedance, several may have also had right heart failure given the common pathogenic evolution from left heart dysfunction to right heart dysfunction over time [41]. In fact, this phenotypic evolution may partly explain the large variation in RBC amplitude oscillation exhibited by our LHF cohort (maximum 21.5%, minimum 8.0%, SD 5.1%). Additionally, IPF and COPD subjects were not specifically evaluated to rule out pulmonary hypertension. Another limitation is that our subject scans were conducted on different platforms with two field strengths [13, 30]. Our quantification method, using a healthy reference group constructed under the same acquisition protocol, was designed to incorporate the potential factors such as T1 and T2* decay, which may affect the gas transfer measurements. However, these and other factors constrained the size and sex ratio of the healthy reference cohorts, which were also significantly younger than the typical patients in our cohorts and predominantly male. Since the aging lung is reported to undergo physiological changes that could impact gas transfer functions [42], future studies will benefit from constructing a larger and age-controlled healthy population.
Conclusions
In this study, we applied 129Xe gas transfer imaging and spectroscopy on healthy subjects and patients with COPD, IPF, LHF and PAH. As a noninvasive and nonionising tool, hyperpolarised 129Xe gas transfer MRI provides a fundamentally new approach to directly image regional function while also capturing haemodynamics at the alveolar–capillary level. We identified unique imaging and spectroscopic signatures for each of these diseases that may help overcome some of the diagnostic challenges faced by clinicians treating patients with cardiopulmonary disease. 129Xe gas transfer imaging and spectroscopy is a promising technology in characterising cardiopulmonary disease pathophysiology and, with further validation in larger studies, can contribute to a comprehensive understanding of the multifactorial pathogenesis of dyspnoea and developing personalised treatment approaches.
Acknowledgements
We gratefully acknowledge the selfless contributions of our patients, and the tireless commitment of our clinical research coordinators Karla Kennedy, Susana Almeida-Peters, Jennifer Korzekwinski and Samantha Womack.
Support statement: This study was funded by NIH/NHLBI R01 HL105643, NIH/NHLBI R01HL126771 and HHSN268201700001C. Sheng Luo’s research was supported in part by the National Institutes of Health (R01NS091307 and R56AG062302). Funding information for this article has been deposited with the Crossref Funder Registry.
Footnotes
Conflict of interest: Z. Wang has a provisional patent for a diagnostic algorithm based on the findings in this manuscript licensed.
Conflict of interest: E.A. Bier reports grants from the National Institutes of Health, during the conduct of the study; and has a provisional patent for a diagnostic algorithm based on the findings in this manuscript licensed.
Conflict of interest: A. Swaminathan has nothing to disclose.
Conflict of interest: K. Parikh has nothing to disclose.
Conflict of interest: J. Nouls has nothing to disclose.
Conflict of interest: M. He has nothing to disclose.
Conflict of interest: J.G. Mammarappallil has nothing to disclose.
Conflict of interest: S. Luo has nothing to disclose.
Conflict of interest: B. Driehuys reports grants from the National Institutes of Health, during the conduct of the study; personal fees from and is founder and chief technology officer for Polarean Imaging, a company which produces 129Xe hyperpolarisation equipment, outside the submitted work; and has a provisional patent for a diagnostic algorithm based on the findings in this manuscript licensed.
Conflict of interest: S. Rajagopal reports grants from National Institutes of Health, during the conduct of the study; and has a patent “Dynamic 129Xe Gas Exchange Spectroscopy” pending.
References
- 1.Dwyer-Lindgren L, Bertozzi-Villa A, Stubbs RW, et al. Trends and patterns of differences in chronic respiratory disease mortality among US counties, 1980–2014. JAMA 2017; 318: 1136–1149. doi: 10.1001/jama.2017.11747 [DOI] [PMC free article] [PubMed] [Google Scholar]
- 2.Divo M, Cote C, de Torres JP, et al. Comorbidities and risk of mortality in patients with chronic obstructive pulmonary disease. Am J Respir Crit Care Med 2012; 186: 155–161. doi: 10.1164/rccm.201201-0034OC [DOI] [PubMed] [Google Scholar]
- 3.Kreuter M, Ehlers-Tenenbaum S, Palmowski K, et al. Impact of comorbidities on mortality in patients with idiopathic pulmonary fibrosis. PLoS One 2016; 11: e0151425. doi: 10.1371/journal.pone.0151425 [DOI] [PMC free article] [PubMed] [Google Scholar]
- 4.Roversi S, Fabbri LM, Sin DD, et al. Chronic obstructive pulmonary disease and cardiac diseases. an urgent need for integrated care. Am J Respir Crit Care Med 2016; 194: 1319–1336. doi: 10.1164/rccm.201604-0690SO [DOI] [PubMed] [Google Scholar]
- 5.Minasian AG, van den Elshout FJ, Dekhuijzen PR, et al. Serial pulmonary function tests to diagnose COPD in chronic heart failure. Transl Respir Med 2014; 2: 12. doi: 10.1186/s40247-014-0012-5 [DOI] [PMC free article] [PubMed] [Google Scholar]
- 6.Hawkins NM, Virani S, Ceconi C. Heart failure and chronic obstructive pulmonary disease: the challenges facing physicians and health services. Eur Heart J 2013; 34: 2795–2803. doi: 10.1093/eurheartj/eht192 [DOI] [PubMed] [Google Scholar]
- 7.Storto ML, Kee ST, Golden JA, et al. Hydrostatic pulmonary edema: high-resolution CT findings. AJR Am J Roentgenol 1995; 165: 817–820. doi: 10.2214/ajr.165.4.7676973 [DOI] [PubMed] [Google Scholar]
- 8.Swift AJ, Wild JM, Nagle SK, et al. Quantitative magnetic resonance imaging of pulmonary hypertension a practical approach to the current state of the art. J Thorac Imaging 2014; 29: 68–79. doi: 10.1097/RTI.0000000000000079 [DOI] [PMC free article] [PubMed] [Google Scholar]
- 9.Johns CS, Kiely DG, Rajaram S, et al. Diagnosis of pulmonary hypertension with cardiac MRI: derivation and validation of regression models. Radiology 2019; 290: 61–68. doi: 10.1148/radiol.2018180603 [DOI] [PMC free article] [PubMed] [Google Scholar]
- 10.Johns CS, Swift AJ, Rajaram S, et al. Lung perfusion: MRI vs. SPECT for screening in suspected chronic thromboembolic pulmonary hypertension. J Magn Reson Imaging 2017; 46: 1693–1697. doi: 10.1002/jmri.25714 [DOI] [PMC free article] [PubMed] [Google Scholar]
- 11.Johns CS, Rajaram S, Capener DA, et al. Non-invasive methods for estimating mPAP in COPD using cardiovascular magnetic resonance imaging. Eur Radiol 2018; 28: 1438–1448. doi: 10.1007/s00330-017-5143-y [DOI] [PMC free article] [PubMed] [Google Scholar]
- 12.Kaushik SS, Robertson SH, Freeman MS, et al. Single-breath clinical imaging of hyperpolarized 129Xe in the airspaces, barrier, and red blood cells using an interleaved 3D radial 1-point Dixon acquisition. Magn Reson Med 2016; 75: 1434–1443. doi: 10.1002/mrm.25675 [DOI] [PMC free article] [PubMed] [Google Scholar]
- 13.Wang Z, Robertson SH, Wang J, et al. Quantitative analysis of hyperpolarized 129Xe gas transfer MRI. Med Phys 2017; 44:2415–2428. doi: 10.1002/mp.12264 [DOI] [PubMed] [Google Scholar]
- 14.Wang Z, He M, Bier E, et al. Hyperpolarized 129Xe gas transfer MRI: the transition from 1.5 T to 3 T. Magn Reson Med 2018; 80:2374–2383. doi: 10.1002/mrm.27377 [DOI] [PMC free article] [PubMed] [Google Scholar]
- 15.Wang JM, Robertson SH, Wang Z, et al. Using hyperpolarized 129Xe MRI to quantify regional gas transfer in idiopathic pulmonary fibrosis. Thorax 2018; 73: 21–28. doi: 10.1136/thoraxjnl-2017-210070 [DOI] [PMC free article] [PubMed] [Google Scholar]
- 16.Dahhan T, Kaushik SS, He M, et al. Abnormalities in hyperpolarized 129Xe magnetic resonance imaging and spectroscopy in two patients with pulmonary vascular disease. Pulm Circ 2016; 6: 126–131. doi: 10.1086/685110 [DOI] [PMC free article] [PubMed] [Google Scholar]
- 17.Weatherley ND, Stewart NJ, Chan HF, et al. Hyperpolarised xenon magnetic resonance spectroscopy for the longitudinal assessment of changes in gas diffusion in IPF. Thorax 2019; 74: 500–502. doi: 10.1136/thoraxjnl-2018-211851 [DOI] [PMC free article] [PubMed] [Google Scholar]
- 18.Norquay G, Leung G, Stewart NJ, et al. Xe-129 chemical shift in human blood and pulmonary blood oxygenation measurement in humans using hyperpolarized Xe-129 NMR. Magn Reson Med 2017; 77: 1399–1408. doi: 10.1002/mrm.26225 [DOI] [PMC free article] [PubMed] [Google Scholar]
- 19.Bier EA, Robertson SH, Schrank GM, et al. A protocol for quantifying cardiogenic oscillations in dynamic 129Xe gas exchange spectroscopy: the effects of idiopathic pulmonary fibrosis. NMR Biomed 2019; 32: e4029. doi: 10.1002/nbm.4029 [DOI] [PMC free article] [PubMed] [Google Scholar]
- 20.Celli BR, MacNee W, Agusti A, et al. Standards for the diagnosis and treatment of patients with COPD: a summary of the ATS/ERS position paper. Eur Respir J 2004; 23: 932–946. doi: 10.1183/09031936.04.00014304 [DOI] [PubMed] [Google Scholar]
- 21.Raghu G, Collard HR, Egan JJ, et al. An official ATS/ERS/JRS/ALAT statement: idiopathic pulmonary fibrosis: evidence-based guidelines for diagnosis and management. Am J Respir Crit Care Med 2011; 183: 788–824. doi: 10.1164/rccm.2009-040GL [DOI] [PMC free article] [PubMed] [Google Scholar]
- 22.Lang RM. Recommendations for cardiac chamber quantification by echocardiography in adults: an update from the American Society of Echocardiography and the European Association of Cardiovascular Imaging. J Am Soc Echocardiogr 2015; 28: 1–39. doi: 10.1016/j.echo.2014.10.003 [DOI] [PubMed] [Google Scholar]
- 23.Simonneau G, Robbins IM, Beghetti M, et al. Updated clinical classification of pulmonary hypertension. J Am Coll Cardiol 2009; 54: S43–S54. doi: 10.1016/j.jacc.2009.04.012 [DOI] [PubMed] [Google Scholar]
- 24.Roos JE, McAdams HP, Kaushik SS, et al. Hyperpolarized gas MR imaging: technique and applications. Magn Reson Imaging Clin N Am 2015; 23: 217–229. doi: 10.1016/j.mric.2015.01.003 [DOI] [PMC free article] [PubMed] [Google Scholar]
- 25.He M, Driehuys B, Que LG, et al. Using hyperpolarized 129Xe MRI to quantify the pulmonary ventilation distribution. Acad Radiol 2016; 23: 1521–1531. doi: 10.1016/j.acra.2016.07.014 [DOI] [PMC free article] [PubMed] [Google Scholar]
- 26.Pike D, Kirby M, Eddy RL, et al. Regional heterogeneity of chronic obstructive pulmonary disease phenotypes: pulmonary He-3 magnetic resonance imaging and computed tomography. COPD 2016; 13: 601–609. doi: 10.3109/15412555.2015.1123682 [DOI] [PubMed] [Google Scholar]
- 27.Qing K, Mugler JP, Altes TA, et al. Assessment of lung function in asthma and COPD using hyperpolarized 129Xe chemical shift saturation recovery spectroscopy and dissolved-phase MRI. NMR Biomed 2014; 27: 1490–1501. doi: 10.1002/nbm.3179 [DOI] [PMC free article] [PubMed] [Google Scholar]
- 28.Virgincar RS, Cleveland ZI, Kaushik SS, et al. Quantitative analysis of hyperpolarized 129Xe ventilation imaging in healthy volunteers and subjects with chronic obstructive pulmonary disease. NMR Biomed 2013; 26: 424–435. doi: 10.1002/nbm.2880 [DOI] [PMC free article] [PubMed] [Google Scholar]
- 29.Roughton FJ, Forster RE. Relative importance of diffusion and chemical reaction rates in determining rate of exchange of gases in the human lung, with special reference to true diffusing capacity of pulmonary membrane and volume of blood in the lung capillaries. J Appl Physiol 1957; 11: 290–302. doi: 10.1152/jappl.1957.11.2.290 [DOI] [PubMed] [Google Scholar]
- 30.Wang Z, He M, Virgincer R, et al. Quantifying hyperpolarized 129Xe gas exchange MRI across platforms, field strength, and acquisition parameters. Digital poster 4139. Presented at the International Society for Magnetic Resonance in Medicine Annual Meeting. Montreal, Canada. 2019. www.ismrm.org/19/program_files/DP18.htmDatelast accessed: October 13, 2019.
- 31.Barnes PJ, Celli BR. Systemic manifestations and comorbidities of COPD. Eur Respir J 2009; 33: 1165–1185. doi: 10.1183/09031936.00128008 [DOI] [PubMed] [Google Scholar]
- 32.Rahaghi FN, van Beek EJR, Washko GR. Cardiopulmonary coupling in chronic obstructive pulmonary disease. The role of imaging. J Thorac Imaging 2014; 29: 80–91. doi: 10.1097/RTI.0000000000000076 [DOI] [PMC free article] [PubMed] [Google Scholar]
- 33.Lederer DJ, Martinez FJ. Idiopathic pulmonary fibrosis. N Engl J Med 2018; 379: 797–798. [DOI] [PubMed] [Google Scholar]
- 34.Olson TP, Johnson BD, Borlaug BA. Impaired pulmonary diffusion in heart failure with preserved ejection fraction. JACC Heart Fail 2016; 4: 490–498. doi: 10.1016/j.jchf.2016.03.001 [DOI] [PMC free article] [PubMed] [Google Scholar]
- 35.Guazzi M Alveolar gas diffusion abnormalities in heart failure. J Card Fail 2008; 14: 695–702. doi: 10.1016/j.cardfail.2008.06.004 [DOI] [PubMed] [Google Scholar]
- 36.Borlaug BA, Jaber WA, Ommen SR, et al. Diastolic relaxation and compliance reserve during dynamic exercise in heart failure with preserved ejection fraction. Heart 2011; 97: 964–969. doi: 10.1136/hrt.2010.212787 [DOI] [PMC free article] [PubMed] [Google Scholar]
- 37.Farha S, Laskowski D, George D, et al. Loss of alveolar membrane diffusing capacity and pulmonary capillary blood volume in pulmonary arterial hypertension. Respir Res 2013; 14: 6. doi: 10.1186/1465-9921-14-6 [DOI] [PMC free article] [PubMed] [Google Scholar]
- 38.Cosgrove GP, Bianchi P, Danese S, et al. Barriers to timely diagnosis of interstitial lung disease in the real world: the INTENSITY survey. BMC Pulm Med 2018; 18: 9. doi: 10.1186/s12890-017-0560-x [DOI] [PMC free article] [PubMed] [Google Scholar]
- 39.Lau EM, Humbert M, Celermajer DS. Early detection of pulmonary arterial hypertension. Nat Rev Cardiol 2015; 12: 143–155. doi: 10.1038/nrcardio.2014.191 [DOI] [PubMed] [Google Scholar]
- 40.Mammarappallil JG, Rankine L, Wild JM, et al. New developments in imaging idiopathic pulmonary fibrosis with hyperpolarized xenon magnetic resonance imaging. J Thorac Imaging 2019; 34: 136–150. doi: 10.1097/RTI.0000000000000392 [DOI] [PMC free article] [PubMed] [Google Scholar]
- 41.Rosenkranz S, Gibbs JS, Wachter R, et al. Left ventricular heart failure and pulmonary hypertension. Eur Heart J 2016; 37: 942–954. doi: 10.1093/eurheartj/ehv512 [DOI] [PMC free article] [PubMed] [Google Scholar]
- 42.Janssens JP, Pache JC, Nicod LP. Physiological changes in respiratory function associated with ageing. Eur Respir J 1999; 13: 197–205. doi: 10.1183/09031936.99.14614549 [DOI] [PubMed] [Google Scholar]