

Abstract
To estimate the oxidative stability of the raw and roasted hazelnuts, accelerated shelf-life testing (ASLT) was used at elevated temperatures (55, 65 and 75 °C) at water activity (aw) of 0.43. Chemical parameters, including peroxide value (PV), para-anisidine value, and total oxidation value were measured to estimate the oxidative stability of the samples using Arrhenius model. In addition, the samples were maintained for 8 months in a real condition at 20–30 °C (long-term shelf-life testing) for validating the results obtained from short-term ASLT. The maximum activation energy (Ea, 78.76 kJ/mol °K) and Q10 (1.871) was obtained for PV in raw hazelnuts, while the minimum Ea (53.36 kJ/mol °K) and Q10 (1.552) were recorded for PV in roasted hazelnuts, indicating the negative effect of roasting process on the oxidative stability of the samples. In order to validate the estimations, the values predicted by short-term ASLT for each oxidation index were plotted versus their corresponding values in actual storage. The results showed good correlation coefficients (R2 = 0.91–0.98), confirming the fitness of the Arrhenius model to predict the oxidative indices of the samples during normal storage.
Keywords: Hazelnut, Roasting, Accelerated shelf-life testing, Para-anisidine value, Peroxide value, TOTOX value
Introduction
Hazelnut is a healthy nut rich in mono and polyunsaturated fatty acids, especially oleic and linoleic acid, as well as valuable micro-nutrients namely sterols, essentials minerals, free phenolic acids, phenolic compounds and organic acids (Shahidi and Miraliakbari 2005; Özcan et al. 2018). During roasting process, the color, texture, flavor, composition and oil quality in the nut are changed (Özcan et al. 2018; Mohammadi Moghaddam et al. 2016). Lipid oxidation is the main factor for degradation of oil and fat-containing foods like hazelnut, so determination of the shelf-life can be very useful in the foods with higher fat contents. The shelf-life of nuts is dependent mostly on the temperature and humidity of the storage condition (Hosseini et al. 2014; Ghorbani and Hosseini 2017; Martín-Polvillo et al. 2004). Acceptable quality of nuts can be maintained for around a year at room temperature up to more than 2 years at − 18 °C. The shelf-life may be estimated by accelerated stability testing method; however, the stability test of the product under normal conditions is necessary for confirming the data from accelerated condition (Anderson and Scott 1991). So, the data of stability test can be used to estimate the parameters of degradation and to evaluate the shelf-life (Martins et al. 2008). The most frequently used accelerated test model is Arrhenius equation (Anderson and Scott 1991; Sehwag et al. 2018). In accelerated shelf-life testing (ASLT), the effect of parameters (mainly temperature) on the degradation reaction rate can be evaluated by applying chemical kinetic models (Robertson 2000). As an example, by increasing the temperature and evaluation of Arrhenius kinetics, the degradation rate of samples under normal conditions can be predicted by data obtained from Arrhenius equation (Corradini and Peleg 2007).
Free fatty acids (FFA) content, peroxide value (PV), para-anisidine value (p-AnV), thiobarbituric acid (TBA) value, total oxidation (TOTOX) value, and conjugated diene and triene values are chemical tests frequently used for assessing the quality of edible oils (Ragnarsson and Labuza 1997). Shakerardekani et al. (2015) evaluated the oxidative stability of pistachios during storage under accelerated condition (60 °C). In all samples, the TOTOX value after 25 days of storage was higher than 10. Peroxide, p-An and FFA values in both spread and paste forms of pistachios increased with the time of storage under accelerated condition. Hosseini et al. (2014) evaluated the oxidation progress in walnuts using ASLT at high temperatures (62, 72 and 82 °C). Using an zero-order kinetic, they showed that the changes in oxidative indices were a temperature-dependent process, and the highest activation energy (62.24–75.67 kJ/mol °K) determined for formation of the primary oxidation products, while the minimum energy (35.65 kJ/mol °K) recorded for generating the secondary products of oxidation. In another study, Lopez-Duarte and Vidal-Quintanar (2009) successfully used Arrhenius model for estimating the oxidative indices of the corn flour stored at 25 °C by data collected from short-term storage at elevated temperatures (45–85 °C), and water activity (aw) of 0.45.
The aim of this study was to apply the kinetic model of Arrhenius to predict the shelf-life of raw and roasted hazelnuts by determining the rate of changes in PV, p-AnV and TOTOX index, followed by comparing the estimated results with the results obtained under normal condition.
Materials and methods
Materials
All chemicals were purchased from Merck (Germany). The raw hazelnut seeds were provided by the agriculture organization of Guilan provinc (Iran) in Summer, 2018.
Roasting the hazelnuts
After transferring the samples to laboratory, chemical composition of raw hazelnuts was determined, and then, the raw hazelnuts were broken into two halves using a hammer. One batch of half nuts were immersed in a solution containing lemon-juice (10%), salt (15%) and starch (10%), followed by roasting at 120 °C for 13 min.
Storage conditions
The Raw and roasted hazelnuts were packed in two-ply polyethylene packagings and kept in a cabinet at room temperature (24 ± 1.57 °C, relative humidity of 35–40%) for 8 months. The raw hazelnuts were evaluated for oxidation parameters after 120 days storage period, while the roasted ones were assessed every 30 days (Hosseini et al. 2014; Ghorbani and Hosseini 2017). For accelerated storage, the seeds were placed within a desiccator in which aw was adjusted to 0.42–0.43 by saturated solution of potassium carbonate, then, the desiccators were kept in an oven (Memmert, Germany) at temperatures of 55, 65 and 75 °C (Lopez-Duarte and Vidal-Quintanar 2009; Ghorbani and Hosseini 2017).
Extraction of hazelnut oil
To extract the oil, diethyl ether was used as solvent. At first, 40 g of hazelnut seeds were ground and mixed with 200 mL of diethyl ether. After 12 h, the mixture was filtered with No. 1 Whatman filter paper and concentrated using a rotary vacuum evaporator (Basic 05 RV, IKA, Germany) equipped with an electrical water bath (Basic 4 HB, IKA Germany) (Lopez-Duarte and Vidal-Quintanar 2009; Hosseini et al. 2014; Ghorbani and Hosseini 2017). The concentrated extracts were kept in a refrigerator until further tests.
Chemical analysis
The content of protein, moisture, fiber, oil, ash and carbohydrates in hazelnuts were determined according to the official standards (AOAC 2005). The amount of carbohydrates was calculated by subtraction of the sum of ash, moisture, fiber, protein and oil percentages from 100.
Fatty acid composition
Fatty acid methyl esters (FAMEs) were prepared based on Official Method of AOCS (Ch 1–91, 2003) as described by Hosseini et al. (2018, 2019). A gas chromatography instrument (TGF 2552, Iran) equipped with a capillary column (CP-Sil 88, 0.25 mm i.d., 100 m length, thickness of 0.25 μm) and flame ionization detector was used to analyze the FAMEs. The column temperature was maintained at 80 °C for 4 min, followed by raising the temperature (3 °C/min) up to 240 °C. The temperatures of detector and injection were 250 and 225 °C, respectively. Hydrogen was used as carrier gas in a rate of 1.20 mL/min. Identification and quantitation of FAs were accomplished using a standard solution (Supelco 37 FAME, Bellefonte, PA, USA) in accordance with the literature (Hosseini et al. 2018, 2019).
Oxidative analysis
Oxidative indices were measured for oil extracted from the samples stored at different conditions. Peroxide value in term of mEq oxygen per kilogram of hazelnut oil (mEq O2/kg) was determined by titration method according to standard method of AOCS (Cd 8–53, 2003). P-AnV was determined according to the standard of 2504 IUPAC using a spectrophotometer at 350 nm (IUPAC 1987). 0.5 g of oil was dissolved in 25 mL of isooctane and the absorption of the solution at 350 nm was measured with isooctane as control (solution 1). Then, 1 mL of p-An reagent (p-An in acetic acid, 2.5 gr/l) was added to 5 mL of solution 1 and then vigorously shaked (solution 2). After storage in dark for 10 min, the absorption at 350 nm was recorded with p-An reagent as control and the results were calculated as follows:
| 1 |
where A1 the absorbance of solution 1 (350 nm); A2, the absorbance of solution 2 (350 nm); m, the sample weight in grams. Therefore, p-AnV is 100 times the specific absorbance at 350 nm.
TOTOX value is a useful measure of initial degradation in the oil that provides good information on both primary and secondary products of oxidation. TOTOX value was calculated according to the Eq. (2) (Shahidi and Wanasundara 2002).
| 2 |
The estimation of oxidative stability of hazelnuts
The degradation of a food can generally be assumed as a kinetic reaction. The effect of temperature on most chemical reactions could be expressed by Arrhenius equation. The Eq. (3) shows the general kinetic of fat oxidation reaction:
| 3 |
where dc is referred to the concentration of oxidation products in the primary (c0) and a given time (ce) within the storage period, k is reaction rate constant, and n is reaction order. By integrating the Eq. (3), the shelf-life of the sample (t) is defined as follows:
| 4 |
However, k must be determined. The Arrhenius model is frequently used to explain the temperature dependence of the degradation rate as follows:
| 5 |
where k0 is exponential factor; Ea, activation energy (KJ/mol °K); T, the absolute temperature (°K) and R is gas universal constant (8.318 kJ/mol °K) (Maskan and Karatas 1999).
By plotting the natural logarithm of the reaction rate versus inverse absolute temperature for each index, several attributes describing the kinetics of indices, namely oxidation reaction rate and activation energy of the reaction could be simulated from Arrhenius equation (Eq. 5) (Corradini and Peleg 2007).
Finally, it can be useful to calculate Q10 from Eq. (6), representing the times of change in the rate of oxidation products formation with 10 °C change in temperature (Liu et al. 2019):
| 6 |
where b is slope of curve from drawing the Ln k versus temperature (°C) (Hosseini et al. 2014).
Statistical analysis
All tests were performed in duplicate (n = 2) with two independent variables (temperature and hazelnuts type) and three response variables (PV, p-AnV and TOTOX value). Average of repeats were compared by the least significant difference test using SAS statistical software, and the differences were significant when P < 0.05.
Results and discussion
Characteristics of raw and roasted hazelnuts
The chemical characteristics of raw and roasted hazelnuts were determined. The contents of moisture, lipid, protein, ash, carbohydrate, and fiber for raw hazelnuts were respectively 3.50 ± 0.19, 60.21 ± 0.69, 16.31 ± 0.12, 2.50 ± 0.21, 12.92 ± 0.10 and 4.56 ± 0.16%, while these levels for roasted hazelnuts were 1.65 ± 0.09, 68.40 ± 1.70, 14.10 ± 0.28, 2.28 ± 0.18, 10.15 ± 0.14, 3.42 ± 0.15%, respectively. Refractive index of the oil extracted from raw and roasted hazelnuts was 1.4600 ± 0.0010 and 1.4690 ± 0.0007, respectively. Table 1 represents the fatty acid composition of the hazelnut oil. Based on Table 1, oleic and linoleic acids were the predominant acids of hazelnut oil followed by palmitic and stearic acids. Fatty acid composition of raw hazelnut oil was within the range reported by other investigators, including 4–7%, 1–4%, 70–90%, and 7–16.60% for palmitic, stearic, oleic, and linoleic acids, respectively (Shahidi and Miraliakbari 2005; Seyhan et al. 2007; Benitez-Sánchez et al. 2003; Alasalvar et al. 2003). Moreover, Seyhan et al. (2007) reported different levels of saturated fatty acids (SFA, 7.49–8.89%), monounsaturated fatty acids (MUFA, 81.07–82.71%), and polyunsaturated fatty acids (PUFA, 8.40–10.86%) in different native hazelnut varieties from Turkey that is in a well agreement with values presented in Table 1.
Table 1.
Fatty acid composition of raw hazelnut oil
| Common name; abbreviated sign | Amount (%)a |
|---|---|
| Methyl laurate; C12:0 | 0.02 |
| Myristate; C14:0 | 0.03 ± 0.01 |
| Pentadecanoate; C15:0 | 0.17 ± 0.06 |
| Palmitate; C16:0 | 5.35 ± 0.01 |
| Heptadecanoate; C17:0 | 0.03 |
| Stearate; C18:0 | 1.37 ± 0.11 |
| Arachidate; C20:0 | 0.35 ± 0.06 |
| Tricosanoate; C24:0 | n.d.b |
| Palmitoleate (cis-9); C16:1 n-7 | 0.17 ± 0.01 |
| Heptadecenoate (cis-10); C17:1 | 0.09 ± 0.01 |
| Oleate (cis-9); C18:1 | 81.00 ± 0.03 |
| Eicosenoate (cis-11); C20:1 n-9 | n.d. |
| Nervonate (cis-15); C24:1 n-9 | n.d. |
| Linoleate (cis-9,12); C18:2 n-6 | 11.01 ± 0.04 |
| Linolenate (cis-9,12,15); C18:3 n-3 | 0.37 ± 0.16 |
| ∑SFA (saturated fatty acids) | 7.35 ± 0.23 |
| ∑MUFA (monounsaturated fatty acids) | 81.27 ± 0.04 |
| ∑PUFA (polyunsaturated fatty acids) | 11.38 ± 0.20 |
aValues are expressed as duplicate mean ± standard deviation (%, w/w)
bNot detected
Roasting was associated with significant changes in the structure of the nuts, promoting oxidative reactions, as the PV (0.29 ± 0.02 mEq O2/kg), p-AnV value (0.22 ± 0.02), and TOTOX value (0.80 ± 0.05) of the raw hazelnut oil were significantly increased by roasting process and reached to 0.97 ± 0.02 mEq O2/kg, 0.46 ± 0.01 and 2.37 ± 0.03, respectively. Generally, a PV ranging from 1 to 3 mEq O2/kg is accepted for nuts and other semi-dried water foods (Buransompob et al. 2003; Lopez-Duarte and Vidal-Quintanar 2009). It is claimed that the formation of chemical products with antioxidant properties upon roasting process leads to an increased oxidative stability, as Alamprese et al. (2009) reported that the Maillard reaction products generated during roasting can be associated with an increased oxidative stability. However, Ozdemir et al. (2001) showed that PV of roasted hazelnuts was significantly higher than those recorded for raw forms. Göncüoğlu Taş and Gökmen (2017) claimed that Maillard and caramelization reactions occurred during hazelnut roasting process showed a complicated temperature dependence, and the type of generated products influenced by various factors, resulting in dissimilar oxidative stability in the nuts roasted by different procedures.
Belviso et al. (2017) roasted two types of hazelnuts by two different systems (hot air and infrared) in different temperatures and times. Their results showed that roasting hazelnuts at 120 °C for 40 min using hot air system increased the oxidative stability, while they did not observe a similar trend for total phenolic content and antioxidant capacity. Moreover, some studies reported that the roasting process lead to a significant reduction in natural antioxidant present in the nuts which could negatively influence their oxidative stability (Chang et al. 2016; Özcan et al. 2018). Therefore, there is a significant balance between remained natural antioxidants, antioxidative Maillard reaction products, chemical composition, and oxidative stability of the nuts as roasting process influences their physicochemical characteristics.
Changes in temperature during normal storage condition
The room temperature was fluctuated between 21.76 and 24.94 °C during 8 months normal storage. The average room temperature during storage period was 24 ± 1.57 °C, and hence, the average temperature was applied to Arrhenius equations to extrapolate the rate of changes in the oxidative indices of the samples, for comparing with those to in practical conditions.
Oxidative stability of hazelnuts
The Arrhenius model shows the relationship between storage temperature and degradation rate. Since oil oxidation is the main factor negatively affecting the nut’s shelf-life, estimation of their oxidative stability can be preferably used for shelf-life estimation. In this research, the oxidation rate of the oil extracted from raw and roasted hazelnuts kept in accelerated storage was determined by plotting the PV, p-AnV and TOTOX indices of the samples versus storage time (days) as explained in detail below.
Changes in peroxide value of the samples
Since the hydroperoxides are the primary products of lipid oxidation, measuring the formation of these products is considered as a useful index for monitoring the oxidation reaction (Martín-Polvillo et al. 2004). The rate of formation of hydroperoxides in the earlier stages of oxidation is higher than decomposition rate, while it will be reversed as the oxidation process is developed (Chung et al. 2004; Xie et al. 2018).
As shown in Fig. 1, the PV of raw and roasted hazelnuts stored at 55, 65 and 75 °C were plotted versus time. These values were steadily increased during storage period. Throughout the storage time, the PV of oil extracted from roasted hazelnuts was higher than those determined for raw hazelnut oil. It could be probably due to changes in microstructural and lipid structure of the samples (Ghorbani and Hosseini 2017).
Fig. 1.

The changes in the peroxide (mEq O2/kg), para-Anisidine (100 times the specific absorbance at 350 nm) and TOTOX (2PV + p-AnV) indices of the oil extracted from hazelnuts stored at 55, 65 and 75 °C
According to Table 2, correlation equations describing the formation of hydrperoxides over induction period in raw and roasted hazelnuts stored at temperatures of 55, 65 and 75 °C were presented. The peroxide value was showed a significant increase at elevated temperatures; hence, kPV had a higher value as temperature was increased. The maximum kPV was observed for roasted hazelnuts at temperature of 75 °C and the lowest kPV was recorded for raw hazelnuts at temperature of 55 °C. The kPV had significant dependence on temperature and hazelnut form and their interactions. According to Gou et al. (2000), the roasted almond showed a greater PV than raw almond confirming that the roasting process enhanced the rate of degradation in the nuts.
Table 2.
Regression equations from variations in oxidative indices during accelerated storage of raw and roasted hazelnuts
| T (°C) | Hazelnut type | Regression equation | k (1/day) | Temperature effect on k | Effect of treatment on k | r2 |
|---|---|---|---|---|---|---|
| Peroxide value (mEq O2/kg) | ||||||
| 55 |
Raw Roasted |
Y = 0.1314x + 0.223 Y = 0.9358x − 4.3662 |
0.1314bc 0.9358b |
0.705b |
0.412b 1.643a |
0.99 0.91 |
| 65 |
Raw Roasted |
Y = 0.2477x + 0.4601 Y = 1.7948x − 2.7409 |
0.2477c 1.7948a |
1.021ab |
0.412b 1.643a |
0.98 0.97 |
| 75 |
Raw Roasted |
Y = 0.4606x + 0.7567 Y = 2.2604x + 1.0895 |
0.4606bc 2.2604a |
1.356a |
0.412b 1.643a |
0.94 0.95 |
| < 0.0001 | 0.0262 | 0.0001 | ||||
| Para-anisidine value (100 times the specific absorbance at 350 nm) | ||||||
| 55 |
Raw Roasted |
Y = 0.028x + 0.1877 Y = 0.8211x − 1.2213 |
0.028d 0.8211c |
0.174c |
0.051b 0.671a |
0.95 0.94 |
| 65 |
Raw Roasted |
Y = 0.0453x + 0.1204 Y = 0.6272x − 0.9173 |
0.0453d 0.6272b |
0.336b |
0.051b 0.671a |
0.98 0.98 |
| 75 |
Raw Roasted |
Y = 0.081x + 0.2043 Y = 1.0673x − 0.8937 |
0.081d 1.0673a |
0.574a |
0.051b 0.671a |
0.99 0.94 |
| < 0.0001 | < 0.0001 | < 0.0001 | ||||
| TOTOX value (2PV + p-AnV) | ||||||
| 55 |
Raw Roasted |
Y = 0.2516x + 1.0915 Y = 2.1928x − 9.9537 |
0.2516f 2.1928c |
1.175c |
0.598b 3.962a |
0.97 0.92 |
| 65 |
Raw Roasted |
Y = 0.5406x + 1.0405 Y = 4.2168x − 6.3992 |
0.5406e 4.2168b |
2.378b |
0.598b 3.962a |
0.98 0.98 |
| 75 |
Raw Roasted |
Y = 1.0023x + 1.7176 Y = 5.5965x + 1.2674 |
1.0023d 5.5965a |
3.286a |
0.598b 3.962a |
0.95 0.97 |
| < 0.0001 | < 0.0001 | < 0.0001 |
Values in vertical columns with different letters are significantly different (P < 0.05)
Para-anisidine value in raw and roasted hazelnuts
In fact, the PV alone is not a trusted index for controlling the oxidative quality of lipids since the hydroperoxide decomposition can be occurred, especially at elevated temperatures or prolonged storage times. Peroxide value increases in the primary stages of oxidation that followed by a decline due to decomposition of the hydroperoxides to aldehydes and ketones, leading to increase in the p-AnV (Ragnarsson and Labuza 1997; Xie et al. 2018). Therefore, to avoid false data, it is recommended to measure carbonyl compounds (as p-AnV) and conjugated dienoic fatty acids (Abreu et al. 2010; Ghorbani and Hosseini 2017).
As shown in Fig. 1, the p-AnVs of raw and roasted hazelnuts at 55, 65 and 75 °C were plotted versus storage time. This index was steadily increased during period of storage. Throughout the accelerated storage, the p-AnV of oil extracted from roasted hazelnuts was higher than that extracted from raw hazelnut due to the adverse influence of heating on the oxidative stability of roasted hazelnuts. In agreement with our results, Ghorbani and Hosseini (2017) observed similar trends for changes in p-AnV and TOTOX value in peanuts during storage in aw values ranging from 0.11 to 0.43 at 40 °C.
The correlation equations of the p-AnV during induction period of oxidation in the samples stored at 55, 65 and 75 °C were listed in Table 2. The index was significantly affected by temperature, form of hazelnut and their interactions. From Table 2, it can be seen that the rate constant for formation of secondary products significantly (P < 0.05) was increased as storage temperature was elevated due to enhancement in breakdown rate of oxidation primary products at high temperatures. Under the same storage conditions, the rate constant of the p-AnV (kp-AnV) for roasted hazelnuts was significantly (P < 0.05) higher than raw hazelnuts. Therefore, the highest kp-AnV, corresponding to the highest formation of oxidation secondary products, was recorded for the roasted hazelnuts at 75 °C and the lowest level of this parameter was obtained for raw hazelnuts kept at 55 °C. Riveros et al. (2010) measured chemical parameters (PV and p-AnV) and sensory properties of high oleic peanut paste stored at different conditions, including normal condition, 4 °C, 23 °C and 40 °C. In agreement with our results, they observed a significant increase in the oxidative parameters by increasing the temperature. Moreover, they reported a significant increase in both PV and p-AnV over storage at 23 and 40 °C.
Changes in TOTOX value of raw and roasted hazelnuts
Measuring a combination of both PV and p-AnV is considered as an overall assessment of oxidation process in lipids, known as TOTOX. Therefore, TOTOX value is used as a reliable indication of the overall oxidative stability, including both primary and secondary oxidation products (Abreu et al. 2010). In fact, each hydroperoxide is decomposed into two units of p-anisidine (Ragnarsson and Labuza 1997). In general, a TOTOX value lower than 10 is recommended for nuts (Shakerardekani et al. 2015).
According to Fig. 1, the amounts of TOTOX for raw and roasted hazelnuts at three temperatures of 55, 65 and 75 °C was plotted versus storage time. These values were steadily increased during storage. Throughout the storage period, the amount of TOTOX value for oil extracted from roasted hazelnuts were higher than that recorded for raw hazelnut oil.
In Table 2, the correlation equations related to the TOTOX value of raw and roasted hazelnuts (Fig. 1) stored at accelerated condition were presented. The results were similar to the other oxidative parameters considering the effect of temperature, hazelnut type and their interactions on the rate of changes in TOTOX values. In the following sections, the above-mentioned oxidative parameters were used to estimate the reaction rate constant (kPV, kp-AnV, and kTOTOX) and shelf-life of the nuts during normal storage (24 °C) using Arrhenius equation [Eq. (5) and (4)], respectively.
The estimation of shelf-life of raw and roasted hazelnuts in normal condition
The shelf-life in normal storage conditions can be calculated either by Arrhenius equation or Q10 factor (Ragnarsson and Labuza 1997). According to Fig. 2, in order to extrapolate the oxidative indices of the samples stored in the normal conditions, the natural logarithm of the rate constant (Lnk) for changes in the levels of indices were drawn versus the inverse of absolute temperature (1/T °K). The highest correlation coefficient (r2 = 0.99) was recorded for p-AnV in raw and roasted hazelnuts, and the lowest r2 (0.86) was obtained for the PV of the roasted hazelnuts (Fig. 2).
Fig. 2.
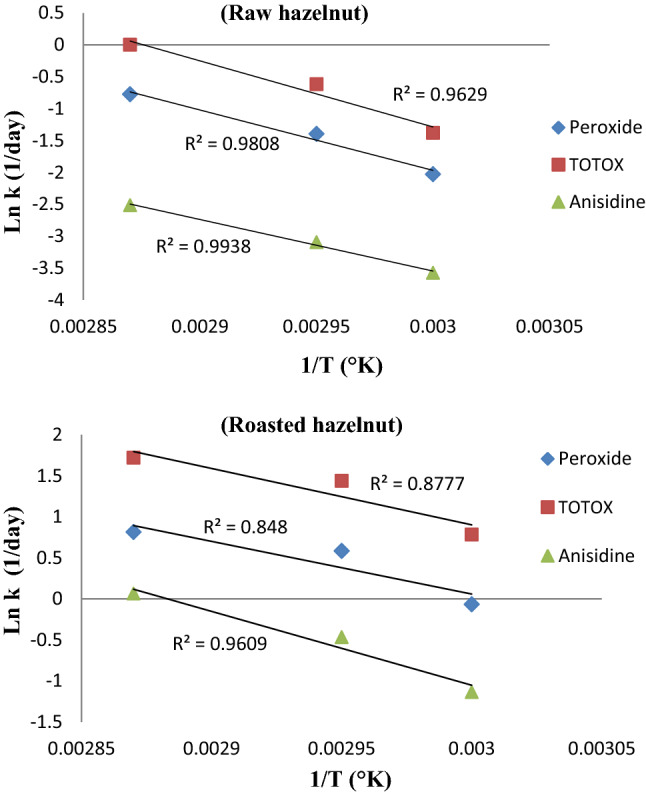
Arrhenius graph from plotting the natural logarithm of rate constant of the indices (Ln kPV, Ln kAnV, and Ln kTOTOX) for raw and roasted hazelnuts stored at 55, 65 and 75 °C against reverse absolute temperature (1/°K)
The specifications of Arrhenius charts (Fig. 2), including the Arrhenius shelf-life equations and activation energy, as well as Q10 factor for each quality indicator (PV, p-AnV and TOTOX value) related to the raw and roasted hazelnuts stored at 55, 65 and 75 °C were listed in Table 3. Activation energy for TOTOX value of the raw hazelnuts was higher than that determined for roasted hazelnuts, indicating its higher oxidative stability in comparison to the roasted samples. However, the Q10 factor in the raw samples was higher than roasted ones, revealing two different mechanisms of oxidation reaction for each treatment as a function of temperature; because, the raw sample could be considered as a food matrix and the roasted sample could be considered as both food matrix and free oil released due to roasting process. In line with our results, Hosseini et al. (2014) reported that the oxidation reaction in walnut kernels followed a zero-order kinetic, and generation of hydroperoxides in the nuts introduced as a temperature-dependent chemical pathway with a Q10 factor of 2.1. Martins et al. (2008) evaluated the effects of different storage temperatures (15, 25, 35 and 40 °C) and relative humidity (11, 33, 37 and 87%) on PV and the shelf-life of pistachio powder during a given storage period. In agreement with our results, they showed that oxidation reaction progress followed a zero-order reaction kinetic. They observed that the highest activation energy (50 kJ/mol °K) required for hydroperoxides formation at a relative humidity of 33%.
Table 3.
The Arrhenius equations and their characteristics, namely Q10, activation energy (Ea, KJ/mol °K), and the rate constant (k) estimated for oxidative indices of the samples during normal storage (24 °C) along with coefficients of correlation between estimated and actual values (validation r2)
| Chemical index | Arrhenius equations | Ea (KJ/mol °K) | Q10 | k (1/day) at 24 °C | Validation r2a |
|---|---|---|---|---|---|
| Raw hazelnut | |||||
| Peroxide value | Y = − 9469.8x + 26.441 | 78.76 | 1.871 | 0.0081 | 0.97 |
| P-anisidine value | Y = − 8076.7x + 20.685 | 67.18 | 1.698 | 0.0025 | 0.91 |
| TOTOX value | Y = − 10354x + 29.777 | 86.12 | 1.995 | 0.012 | 0.97 |
| Roasted hazelnut | |||||
| Peroxide value | Y = − 6415.1x + 19.305 | 53.36 | 1.552 | 0.155 | 0.96 |
| P-anisidine value | Y = − 8996.5x + 25.937 | 74.83 | 1.823 | 0.00234 | 0.98 |
| TOTOX value | Y = − 6866.3x + 21.502 | 57.11 | 1.598 | 0.314 | 0.95 |
aThe coefficients of correlation from plotting the actual indices values at given times versus predicted levels at corresponding times (Fig. 3)
Manzocco et al. (2012) measured the PV of sunflower and soybean oils in exposure to the light with different intensities ranged from 0 to 8000 at three temperatures 10, 20 and 30 °C. They successfully used the Arrhenius equation to develop a predictive model of shelf-life for the specified samples. Using this model, they were able to calculate the activation energy required to generate the hydroperoxides as it was almost 50 kJ/mol °K. The levels ranging between 74.01 and 79.57 kJ/mol °K reported by Hosseini et al. (2014) for energy needed to generate the primary oxidation products during accelerated storage of walnut kernels at 62, 72 and 82 °C. In a similar procedure, Lopez-Duarte and Vidal-Quintanar (2009) reported the activation energy (40.2–104.6 kJ/mol °K) and Q10 factor (1.5–2) for accelerated oxidation of lipid existed in corn masa flour and dry cereals. In a study, hexanal index was used as an indicator of oxidation progress in peanuts treated with different coating materials during accelerated shelf-life testing, it was reported that the formation of hexanal in the coated peanuts was a temperature-dependent reaction with Q10 = 1.4–1.68 (Lee and Krochta 2002). Maskan and Karatas (1999) evaluated the oxidative stability of pistachio stored under modified atmosphere (2% air, 98% carbon dioxide) and air at temperatures ranging between 10 and 30 °C (monolayer moisture), and room conditions (27–92% RH, 20–30 °C). They reported that the activation energy of oxidation reaction under air and carbon dioxide were 8.33 and 13.39 kcal/mol °K respectively, indicating that the oxidation reaction in the presence of CO2 was slower than air. They also recorded the value of 0.00847/day for kPV in pistachios stored at ambient conditions (RH: 27–97%; 20–30 °C) that was close to the corresponding data presented in Table 3. Gómez-Alonso et al. (2004) investigated the oxidation reaction kinetics in triacylglycerol of olive oil stored in dark at different temperatures (25–75 °C) in the absence of peroxidant and antioxidant compounds. Based on Arrhenius equation, the activation energy required for generating the hydroperoxides was 32.10 kJ/mol. They claimed that an increase in the oxidative indices was highly dependent on temperature.
The correlation between the estimated and actual indices
To validate the estimations presented in Table 3, the samples were also stored under normal conditions (room temperature 24 °C, and relative humidity 35–40%) for a period of 8 months. Using Arrhenius shelf-life equations (Fig. 2), the rate constants of the indices at normal temperature were extrapolated, and then, the indices levels at a given time, corresponding to the sampling periods at normal storage, were estimated from Eq. (4). Finally, the actual oxidation indices were plotted against the predicted ones to validate the procedure executed (Fig. 3). For example, the PV, p-AnV and TOTOX value of raw hazelnuts after 120 days of storage at normal condition were 1.10 mEq O2/kg, 0.41 and 2.38, respectively, while the values predicted from Eq. (4) were 1.26 mEq O2/kg, 0.52 and 2.42, respectively. Considering the high correlation coefficients (validation r2 = 0.91–0.98) obtained for validation procedure (Table 3), Arrhenius shelf-life equations could well describe the oxidation reactions kinetic in both raw and roasted hazelnuts.
Fig. 3.

The correlation between the actual and predicted values of the peroxide, p-anisidine and TOTOX values for the nuts during 240 days of storage at 24 °C
Conclusion
The development of oxidation reaction in both raw and roasted hazelnuts was monitored by measuring the PV, p-AnV and TOTOX value during short-term (ASLT) and long-term (ordinary conditions) storages. The oxidative parameters were significantly changed over storage as they well simulated by Arrhenius equation. All parameters were dependent on temperature variations. The highest (1.995) and the lowest (1.552) Q10 factors were recorded for the TOTOX value of the raw hazelnuts and the PV of the roasted samples, respectively. Based on activation energy of TOTOX value, the energy required for progression of oxidation reactions in raw hazelnuts were higher than the roasted samples, indicating the negative effect of roasting process on the shelf-life of hazelnuts. Finally, the results of this study can provide useful information on kinetics of oxidation reactions in both raw and roasted hazelnuts during storage at different temperatures which can be applied to the nut processing industries.
Compliance with ethical standards
Conflict of interest
All authors have no conflicts to disclose.
Footnotes
Publisher's Note
Springer Nature remains neutral with regard to jurisdictional claims in published maps and institutional affiliations.
References
- Abreu DAP, Losada PP, Maroto J, Cruz JM. Evaluation of the effectiveness of a new active packaging film containing natural antioxidants (from barley husks) that retard lipid damage in frozen Atlantic salmon (Salmo salar L.) Food Res Int. 2010;43:1277–1282. [Google Scholar]
- Alamprese C, Ratti S, Rossi M. Effect of roasting conditions on hazelnut characteristics in a two-step process. J Food Eng. 2009;95:272–279. [Google Scholar]
- Alasalvar C, Shahidi F, Liyanapathirana CM, Ohshima T. Turkish Tombul Hazelnut (Corylus avellana L.). 1. Compositional characteristics. J Agric Food Chem. 2003;51(13):3790–3796. doi: 10.1021/jf0212385. [DOI] [PubMed] [Google Scholar]
- American Oil Chemists’ Society (2003) Official methods and recommended practices of the American oil chemists’ society. Champaign, IL, USA
- Anderson G, Scott M. Determination of product shelf life and activation energy for five drugs of abuse. Clin Chem. 1991;37(3):398–402. [PubMed] [Google Scholar]
- AOAC . Official methods of analysis. Maryland: Association of Official Analytical Chemists International; 2005. [Google Scholar]
- Belviso S, Bello BD, Giacosa S, Bertolino M, Ghirardello D, Giordano M, Rolle L, Gerbi V, Zeppa G. Chemical, mechanical and sensory monitoring of hot air and infrared-roasted hazelnuts (Corylus avellana L.) During nine months of storage. Food Chem. 2017;217:398–408. doi: 10.1016/j.foodchem.2016.08.103. [DOI] [PubMed] [Google Scholar]
- Benitez-Sánchez PL, León-Camacho M, Aparicio R. A comprehensive study of hazelnut oil composition with comparisons to other vegetable oils, particularly olive oil. Eur Food Res Technol. 2003;218(1):13–19. [Google Scholar]
- Buransompob A, Tang J, Mao R, Swanson BG. Rancidity of walnuts and almonds affected by short time heat treatments for insect control. J Food Process Preserv. 2003;27:445–464. [Google Scholar]
- Chang SK, Alasalvar C, Bolling BW, Shahidi F. Nuts and their co-products: the impact of processing (roasting) on phenolics, bioavailability, and health benefits–A comprehensive review. J Funct Foods. 2016;26:88–122. [Google Scholar]
- Chung HJ, Colakoglu AS, Min DB. Relationships among headspace oxygen, peroxide value, and conjugated diene content of soybean oil oxidation. J Food Sci. 2004;69(2):83–88. [Google Scholar]
- Corradini MG, Peleg M. Shelf-life estimation from accelerated storage data. Trends Food Sci Technol. 2007;18(1):37–47. [Google Scholar]
- Ghorbani M, Hosseini H. Determination of water activity corresponding to the proper quality of peanut kernels. J Food Process Preserv. 2017;41:e13260. [Google Scholar]
- Gómez-Alonso S, Mancebo-Campos V, Salvador D, Fregapane G. Oxidation kinetics in olive oil triacylglycerols under accelerated shelf-life testing (25–75 °C) Eur J Lipid Sci Technol. 2004;106:369–375. [Google Scholar]
- Göncüoğlu Taş N, Gökmen V. Maillard reaction and caramelization during hazelnut roasting: a multiresponse kinetic study. Food Chem. 2017;221:1911–1922. doi: 10.1016/j.foodchem.2016.11.159. [DOI] [PubMed] [Google Scholar]
- Gou P, Diaz I, Guerrero L, Valero A, Arnau J. Physico-chemical and sensory property changes in almonds of Desmayo largueta variety during roasting. Food Sci Technol Int. 2000;6(1):1–7. [Google Scholar]
- Hosseini H, Ghorbani M, Sadeghi Mahoonak A, Maghsoudlou Y. Monitoring hydroperoxides formation as a measure of predicting walnut oxidative stability. Acta Aliment Hung. 2014;43(3):412–418. [Google Scholar]
- Hosseini H, Ghorbani M, Jafari SM, Sadeghi Mahoonak A. Investigating the effect of lipase from Candida rugosa on the production of EPA and DHA concentrates from Kilka fish (Clupeonella cultiventris caspia) LWT-Food Sci Technol. 2018;93:534–541. [Google Scholar]
- Hosseini H, Ghorbani M, Jafari SM, Sadeghi Mahoonak A. Encapsulation of EPA and DHA concentrate from Kilka fish oil by milk proteins and evaluation of its oxidative stability. J Food Sci Technol. 2019;56(1):59–70. doi: 10.1007/s13197-018-3455-9. [DOI] [PMC free article] [PubMed] [Google Scholar]
- International Union of Pure and Applied Chemistry (IUPAC . Evidence of purity and deterioration from ultraviolet spectrophotometry. In: Paquot C, Hautfenne A, editors. Standard methods for the analysis of oils, fats and derivatives. Oxford: Blackwell Scientific; 1987. pp. 212–213. [Google Scholar]
- Lee SY, Krochta JM. Accelerated shelf-life testing of whey-protein-coated peanuts analysed by static headspace gas chromatography. J Agric Food Chem. 2002;50:2022–2028. doi: 10.1021/jf010501j. [DOI] [PubMed] [Google Scholar]
- Liu N, Zhu Q, Zeng X, Yang B, et al. Influences of pulsed light-UV treatment on the storage period of dry-cured meat and shelf life prediction by ASLT method. J Food Sci Technol. 2019;56(4):1744–1756. doi: 10.1007/s13197-019-03603-1. [DOI] [PMC free article] [PubMed] [Google Scholar]
- Lopez-Duarte AL, Vidal-Quintanar RL. Oxidation of linoleic acid as a marker for shelf life of corn flour. Food Chem. 2009;114(2):478–483. [Google Scholar]
- Manzocco L, Panozzo A, Calligaris S. Accelerated shelf life testing (ASLT) of oils by light and temperature exploitation. J Am Oil Chem Soc. 2012;89:577–583. [Google Scholar]
- Martín-Polvillo M, Márquez-Ruiz G, Dobarganes MC. Oxidative stability of sunflower oils differing in unsaturation degree during long- term storage at room temperature. J Am Oil Chem Soc. 2004;81(6):577–583. [Google Scholar]
- Martins RC, Lopes VV, Vicente AA, Teixeira JA. Computational shelf-life dating: complex systems approaches to food quality and safety. Food Bioprocess Technol. 2008;1:207–222. [Google Scholar]
- Maskan M, Karatas S. Storage stability of whole-split pistachio nuts (Pistachia vera L.) at various conditions. Food Chem. 1999;66:227–233. [Google Scholar]
- Mohammadi Moghaddam T, Razavi SM, Taghizadeh M, Sazgarnia A. Sensory and instrumental texture assessment of roasted pistachio nut/kernel by partial least square (PLS) regression analysis: effect of roasting conditions. J Food Sci Technol. 2016;53(1):370–380. doi: 10.1007/s13197-015-2054-2. [DOI] [PMC free article] [PubMed] [Google Scholar]
- Özcan MM, Juhaimi FA, Uslu N. The effect of heat treatment on phenolic compounds and fatty acid composition of Brazilian nut and hazelnut. J Food Sci Technol. 2018;55(1):376–380. doi: 10.1007/s13197-017-2947-3. [DOI] [PMC free article] [PubMed] [Google Scholar]
- Ozdemir M, Ackurt F, Yildiz M, Birinren G, Gurcan T, Loker M. Effect of roasting on some nutrients of hazelnuts (Corylus Avellena L.) Food Chem. 2001;73:185–190. [Google Scholar]
- Ragnarsson JO, Labuza TP. Accelerated shelf life testing for oxidative rancidity in foods—a Review. Food Chem. 1997;2:291–308. [Google Scholar]
- Riveros CG, Mestrallet MG, Gayol MF, Quiroga PR, Nepote V, Grosso NR. Effect of storage on chemical and sensory profiles of peanut pastes prepared with high-oleic and normal peanuts. J Sci Food Agric. 2010;90(15):2694–2699. doi: 10.1002/jsfa.4142. [DOI] [PubMed] [Google Scholar]
- Robertson GL. Shelf-life of packaged foods, its measurement and prediction. In: Robertson GL, editor. Food packages: principles and practices. New York: CRC Press Inc.; 2000. [Google Scholar]
- Sehwag S, Upadhyay R, Das M. Optimization and multivariate accelerated shelf life testing (MASLT) of a low glycemic whole jamun (Syzygium cumini L.) confection with tailored quality and functional attributes. J Food Sci Technol. 2018;55(12):4887–4900. doi: 10.1007/s13197-018-3423-4. [DOI] [PMC free article] [PubMed] [Google Scholar]
- Seyhan F, Ozay G, Saklar S, Ertaş E, Satır G, Alasalvar C. Chemical changes of three native Turkish hazelnut varieties (Corylus avellana L.) during fruit development. Food Chem. 2007;105(2):590–596. [Google Scholar]
- Shahidi F, Miraliakbari H. Tree Nut Oils. In: Shahidi F, editor. Bailey’s industrial oil and fat products. Hoboken: Wiley; 2005. [Google Scholar]
- Shahidi F, Wanasundara UN. Methods for measuring oxidative rancidity in fats and oils. In: Akoh C, Min D, editors. Food lipids. New York: Marcel Dekker; 2002. pp. 483–501. [Google Scholar]
- Shakerardekani A, Karim R, Ghazali HM, Chin NL. Oxidative stability of pistachio (Pistacia vera L.) paste and spreads. J Am Oil Chem Soc. 2015;92:1015–1021. [Google Scholar]
- Xie C, Ma ZF, Li F, Zhang H, Kong L, Yang Z, Xie W. Storage quality of walnut oil containing lycopene during accelerated oxidation. J Food Sci Technol. 2018;55(4):1387–1395. doi: 10.1007/s13197-018-3053-x. [DOI] [PMC free article] [PubMed] [Google Scholar]