Abstract
Graphitic carbon nitride (g-CN) has emerged as a promising metal-free photocatalyst, while the catalytic mechanism for the photoinduced redox processes is still under investigation. Interestingly, this heptazine-based polymer optically behaves as a “quasi-monomer”. In this work, we explore upstream from melem (the heptazine monomer) to the triazine-based melamine and melam and present several lines of theoretical/experimental evidence where the catalytic activity of g-CN originates from the electronic structure evolution of the C–N heterocyclic cores. Periodic density functional theory calculations reveal the strikingly different electronic structures of melem from its triazine-based counterparts. Fourier transform infrared spectroscopy and X-ray photoelectron spectroscopy also provide consistent results in the structural and chemical bonding variations of these three relevant compounds. Both melam and melem were found to show stable photocatalytic activities, while the photocatalytic activity of melem is about 5.4 times higher than that of melam during the degradation of dyes under UV–visible light irradiation. In contrast to melamine and melam, the frontier electronic orbitals of the heptazine unit in melem are uniformly distributed and well complementary to each other, which further determine the terminal amines as primary reduction sites. These appealing electronic features in both the heterocyclic skeleton and the terminated functional groups can be inherited by the polymeric but quasi-monomeric g-CN, leading to its pronounced photocatalytic activity.
1. Introduction
As a two-dimensional (2D) conjugated polymer, graphitic carbon nitride (g-CN) has attracted tremendous attention because of its unique properties, metal-free nature, and facile synthesis from inexpensive nitrogen-rich organic precursors.1−3 Polymeric g-CN is composed of heptazine-based melon chains that are elegantly assembled in a zigzag fashion and tightly linked by hydrogen bonds to form a 2D planar array.4,5 The sp2 hybridization of carbon and nitrogen induces a specific π-conjugated system and determines a moderate band gap of around 2.7 eV with suitable band-edge positions, whereby the photoinduced electrons and holes are thermodynamically active for various catalytic reactions.6 During the past decade, polymeric g-CN has been extensively investigated as a multipurpose photocatalyst for a wide range of applications, including hydrogen evolution,7−9 CO2 reduction,10,11 water treatment and environmental remediation,12,13 and artificial photosynthesis.14,15
Owing to its polymeric nature, the photocatalytic activity of g-CN is highly sensitive to the synthetic conditions.16−18 Although this makes the structural and electronic properties of g-CN easily tunable,19−21 by which its photocatalytic activity has a great space for further enhancement, the resulted structural complexity, accompanied with comprehensive photophysical/chemical factors, indeed impedes an in-depth mechanistic understanding of the predominant aspects underlying the photoinitiated redox processes.22,23 It has been reported that the appealing electronic structures of g-CN are governed by the partially delocalized π-conjugated system within the heptazine units, making this material a unique “quasi-monomer”.24,25 This could be the reason that many theoretical works presented acceptable explanations on the photophysical properties of g-CN, even some of them improperly employed the ideal hydrogen-free g-C3N4 structure model.26−29 However, the effect of the uncondensed amine groups, serving as the terminal sites to the heptazine cores, on its catalytic activity has been consequently overlooked. Recently, Chu et al.30 reported the notable photocatalytic activity of melem (the heptazine monomer) under a full arc light irradiation, and its frontier electronic orbitals indeed show quite similar features to the heptazine-based g-C3N4 structure. Lau et al.31 investigated the visible light activities of melem oligomers, revealing an improved hydrogen evolution performance compared to the conventional polymeric g-CN. They further suggested that the terminal amines could act as primary reduction sites to substantially improve the photocatalytic activity. Carbon nitride polymers have also been synthesized by thermal condensation of various supramolecular assemblies at relatively low temperatures to conduct a controlled polymerization.32,33 The resulting materials show higher photooxidation potential and the involved functional groups can also be preserved acting as catalytically reactive sites; thereby, significant photocatalytic activities have been achieved.
Triazine features a direct relevance to heptazine with respect to their molecular structures and the unique aromaticity.34 Both of them are electron-deficient systems and prefer a nucleophilic substitution; however, the π-conjugated system in heptazine is more sufficiently extended than that in triazine, and thus, their electronic structures are remarkably different.35−39 On the other hand, although the amine group shows an electron-donating characteristic, the lone-pair electrons in nitrogen indeed make the charge-transfer process tricky, which is expected to be affected by the specific distributions of the electrostatic potentials within the heterocyclic cores.40 As a result, the electronic properties of the amine-terminated triazine and heptazine compounds could also be different. In order to provide a better understanding on the catalytic mechanism of the polymeric but quasi-monomeric g-CN, it is of fundamental significance to compare the photocatalytic activities between the melem monomer and its triazine-based counterparts, as well as to clearly elucidate the differences of their electronic structures in both the heterocyclic skeletons and the terminal amine groups.
Herein, we explore upstream the evolution of photocatalytic performance from melem to triazine-based melam and melamine and report that both melem and melam are potential candidates for solar-driven photocatalysis. Periodic density functional theory (DFT) calculations reveal that, in spite of their structural similarity, the electronic features in these π-conjugated systems intrinsically exhibit a trend of delocalization from triazine to heptazine; which not only narrows the band gap to utilize longer-wavelength lights more efficiently but also determines the distinct frontier electronic orbitals in the terminal amine groups. This work highlights the importance of the combinatorial effect between the heptazine skeleton and the terminated functional groups on the photoinduced redox processes and thus presents an insight into the catalytic mechanism of polymeric g-CN.
2. Results and Discussion
The condensation process from melamine to polymeric g-CN is schematically shown in Scheme 1, during which the two important intermediates of melam and melem can be formed around 350 and 400 °C, respectively.41,42 When the temperature goes higher than 500 °C, melem will gradually polymerize into g-CN. In these three molecules, carbon atoms are of a similar coordination of 2N–C=N (C3N), while the bonding states of nitrogen atoms are distinct: the C–N=C state in the heterocyclic units (N2C), the C–NH2 state in the terminal amine groups (NA), the bridging 2C–NH coordination (NB) in melam, and the three-coordinated nitrogen (N3C) in melem, respectively. These specifically bonded nitrogen atoms have been denoted in Scheme 1 by different colors.
Scheme 1. Thermal Condensation Process from Melamine to Melam, Melem, and Finally Polymeric g-CN.
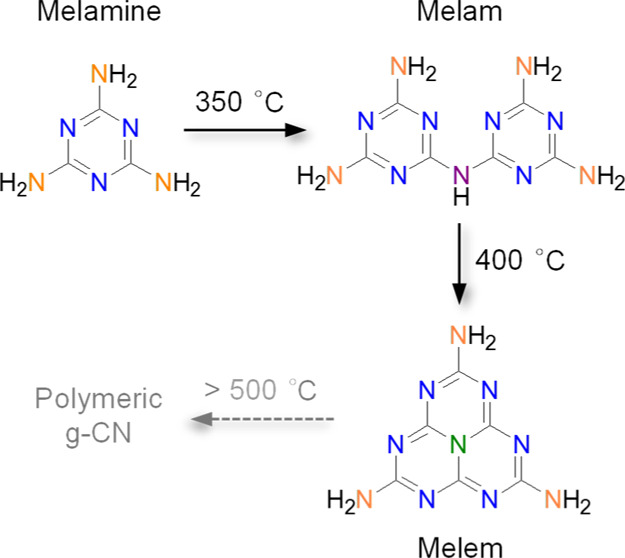
The two-coordinated nitrogen (N2C) and the terminal amine nitrogen (NA) in the three molecules, the bridging nitrogen with the 2C–NH coordination (NB) in melam, and the three-coordinated nitrogen (N3C) in melem are specifically denoted by blue, orange, purple, and olive colors, respectively.
The crystal structures of melamine, melam, and melem have already been characterized,41−45 and their crystallographic data are summarized in Table S1. Geometric optimization based on the Perdew–Burke–Ernzerhof (PBE) functional with a dispersion correction proposed by Tkatchenko and Scheffler (TS)46 predicts satisfied equilibrium lattice parameters (Table S2),47 which slightly underestimates the unit cell volume of melamine with a relative error of −3.45% with respect to the experimental data, while those of melam and melem are found to be less than +0.8%. Figure 1 shows the unit cells and the calculated electronic properties of these three compounds, indicating their indirect band gaps (see details in Figure S1). As revealed by the partial density of states (PDOS) of C and N atoms, the valence band maximum (VBM) of melamine is almost equally contributed from the N2C and NA atoms (Figures 1b and S1a), and its conduction band minimum (CBM) is composed of all the C and N atoms with nearly equal N2C and NA components. The band-edge components of melam are quite similar to those of melamine, while the NA contribution is less pronounced for both the VBM and CBM (Figures 1d and S1b). However, the VBM of melem solely comes from the N2C atoms, and the NA component is negligible (Figures 1f and S1c); by contrast, its CBM mainly originates from the C atoms, accompanied by a rather small contribution from the N3C and NA atoms. The calculated band gap (Eg) based on the PBE–TS functional is 4.21 eV for melamine and gradually decreases to 3.39 eV for melam and 3.29 eV for melem. Furthermore, the Heyd–Scuseria–Ernzerhof (HSE06) hybrid functional48 predicts Eg values of 5.53 eV for melamine and 4.38 eV for melem, respectively, which are comparable with the previous theoretical results.49,50
Figure 1.
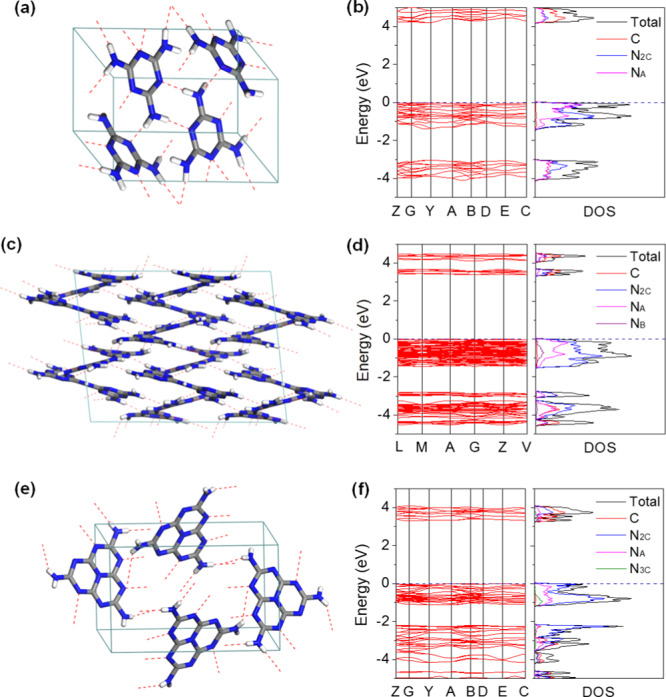
Crystal structures and corresponding electronic properties of (a,b) melamine, (c,d) melam, and (e,f) melem. The C, N, and H atoms are denoted by gray, blue, and white colors, respectively, and the formed hydrogen bonds are represented by the red dashed lines.
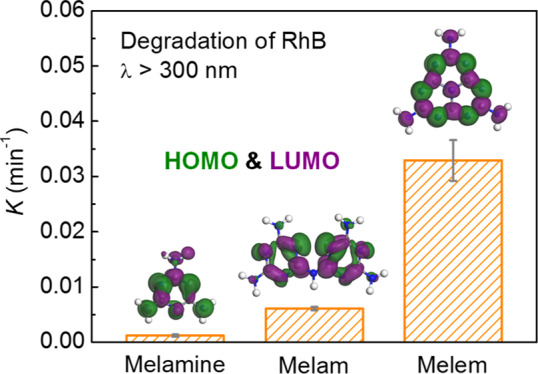
The calculated highest occupied molecular orbitals (HOMOs) and lowest unoccupied molecular orbitals (LUMOs) of these three molecules are shown in Figure 2, which were directly extracted from their unit cells and thus well consistent with the PDOS results. Because of the confinement effects of crystal packing and the formed hydrogen bonding networks, the molecular symmetries have been partially broken with respect to their gas phases, leading to an asymmetric distribution of the HOMO/LUMO orbitals in the triazine-based melamine and melam (Figure 2a–d). The HOMO of melamine mainly localizes on the N2C atoms and two of the three NA atoms (Figure 2a), while the LUMO mainly consists of the C atoms, N2C atoms, and one of the NA atoms (Figure 2b). Melam exhibits HOMO/LUMO distributions in the triazine rings similar to those of melamine, while the NA atoms show much less contributions (Figure 2c,d). In addition, the NB atom does not contribute to both the HOMO and LUMO but definitely affects the LUMO distribution localized on the neighboring C atoms. The calculated results clearly reveal the localized frontier electronic orbitals of melamine and melam; however, those of the heptazine-based melem exhibit distinct features.30,31,51,52 As shown in Figure 2e,f, the presented HOMO is exclusively localized on the N2C atoms, while the LUMO is rather delocalized across the C and N2C atoms, as well as localized on the central N3C and the three NA atoms. Both of them are uniformly distributed, indicating that this heptazine-based molecule is electronically more rigid against the crystal packing. In general, the HOMO is associated with the oxidation sites for the photoinduced holes, while the LUMO is typically for the photoelectron reduction sites, and its delocalized feature could promote the charge carrier dissociation process.31 Moreover, the LUMOs that occurred on the NA atoms would indeed make the terminal amine groups active for primary reduction reactions.
Figure 2.
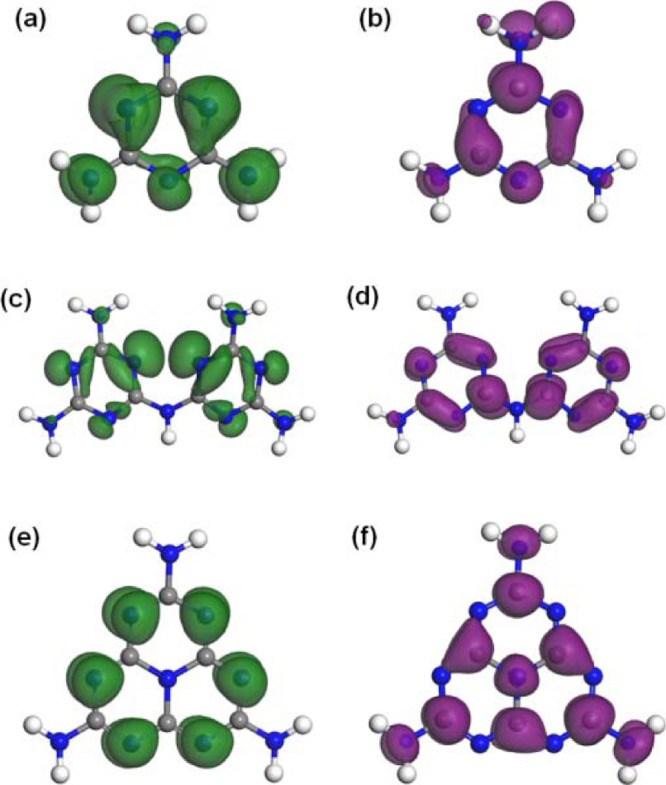
Calculated HOMOs and LUMOs of (a,b) melamine, (c,d) melam, and (e,f) melem, respectively.
In this study, melam and melem were synthesized by an improved multistep thermal condensation of melamine. The condensation from melamine to melam, melem, and finally polymeric g-CN is a typical molecular crystal-based topochemical reaction,53 which could be both directed and confined by the rearrangement of the hydrogen bonding networks. Therefore, the synthesized melam and melem are commonly of a structural complexity with some adduct phases.41,42,44 The thermogravimetric analysis (TGA) curves of the three compounds are shown in Figure S2. Melamine exhibits a severe weight loss from 280 to 375 °C, corresponding to its thermal sublimation process, during which it also condenses into the intermediate phases, and thus, ∼17 wt % of the sample has been maintained at 400 °C for further condensation. The TGA curves of melam and melem clearly reveal their improved thermal stabilities. Under higher temperatures, these three compounds will polymerize into g-CN and completely lose their weights in the range between 745 and 765 °C, corresponding to the decomposition of polymeric g-CN. The compositions of melamine and the synthesized samples were determined by elemental analyses (see Table S4 for the raw data). The corresponding atomic ratios derived from the measured results are found to be in good agreement with the theoretical ones (Table 1). Note that the determined composition of melam gives larger deviations. This is reasonable because melam can only be formed in a very narrow temperature range (340–360 °C) and has a much more complicated structure,41 and a small amount of adduct could be difficult to be excluded completely, thus lowering the uniformity of the sample to some extent.
Table 1. Molecular Formula, Theoretical Atomic Ratio, and Experimental Atomic Ratio Derived from the EA Dataa for Melamine, Melam, and Melem, Respectively.
| theoretical
atomic ratio |
experimental atomic
ratiob |
||||
|---|---|---|---|---|---|
| compound | formula | C/N | C/H | C/N | C/H |
| melamine | C3N6H6 | 0.50 | 0.50 | 0.50 (0.001) | 0.51 (0.009) |
| melam | C6N11H9 | 0.55 | 0.67 | 0.55 (0.008) | 0.72 (0.053) |
| melem | C6N10H6 | 0.60 | 1.00 | 0.60 (0.005) | 1.09 (0.032) |
See the raw EA data in Table S4.
The average value (standard deviation) for each listed item was obtained from three independent EA measurements.
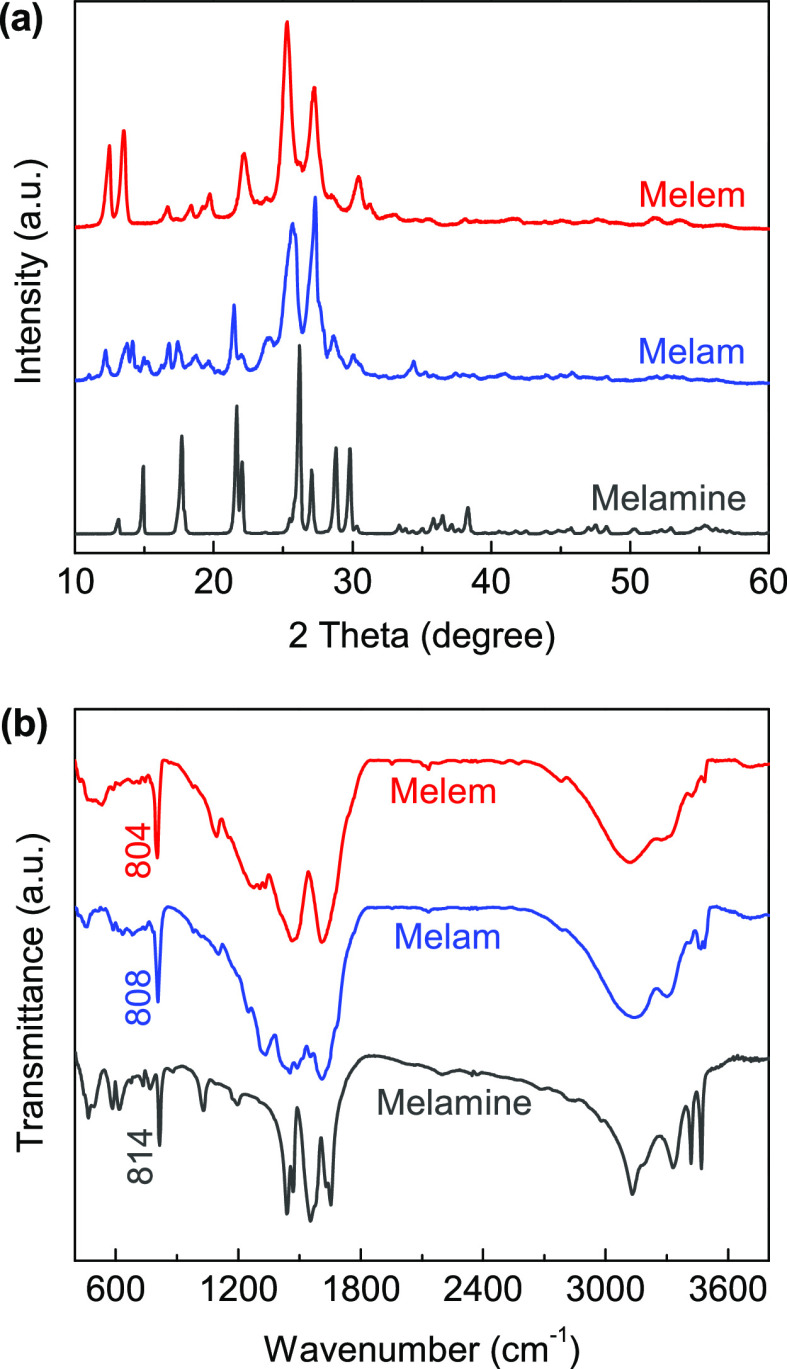
Figure 3a shows the X-ray diffraction (XRD) patterns of the samples, which are well consistent with those reported in the previous works.30,42,49,54 Compared to the precursory melamine, the diffraction peaks of melam and melem are obviously broader, indicating their low crystallinity induced by the solid-state thermal condensation. We further compare the recorded patterns with the theoretical diffraction data generated from the proposed crystal structures (Figure 1 and Table S1). The measured XRD patterns have been indexed in Figure S3, which match the corresponding theoretical ones quite well, indicating the successful syntheses of melam and melem by the improved multistep thermal condensation route used in this study.
Figure 3.
(a) XRD patterns and (b) FTIR spectra of melamine, melam, and melem.
The chemical structures of the samples were characterized by Fourier transform infrared (FTIR) spectroscopy (Figure 3b). In general, the recorded spectra are comparable with each other because of the structural similarity of these three compounds. The characteristic peak at 814 cm–1 in the melamine spectrum can be assigned to the bending vibration mode of the triazine ring,42,43 which is shifted to 808 cm–1 for melam and then to 804 cm–1 for melem, clearly demonstrating the structural evolution from triazine (monomer and dimer) to heptazine units. The main absorption band appears in the range of 1100–1650 cm–1, corresponding to the characteristic C–N and C=N stretching vibrations of the heterocyclic skeletons. Thanks to its structural rigidity, the heptazine ring in melem does not induce more featured absorption peaks compared to melamine; however, the existence of the NB atom in melam makes its bonding environments more complicated, and thus, the IR absorption in this region becomes obviously fruitful. In addition, the broad absorption band ranging from 3000 to 3500 cm–1 is related to the stretching vibrations of the terminal NH2 groups and the bridging NH group in melam (see Scheme 1). As for melam and melem, the absorption peaks become very obscure, indicating the disordered hydrogen bonding networks in these two synthesized samples, in line with their low crystallinity, as shown in Figure 3a.
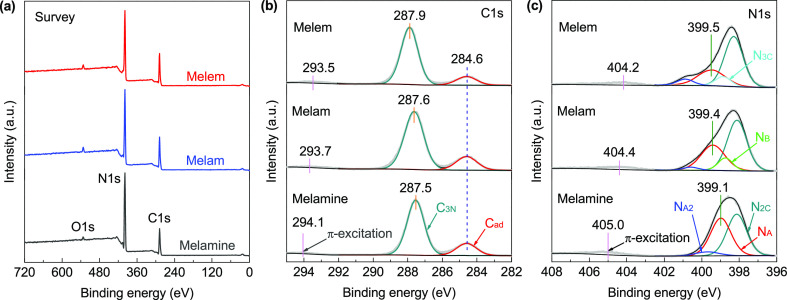
The chemical composition and bonding states of the samples were further investigated by XPS measurements. As shown in Figure 4a, only C, N, and O elements were detected in the survey spectra, in which the trace amounts of O could come from the adsorbed water and oxygen. The measured C 1s and N 1s high-resolution spectra are shown in Figure 4b,c, respectively, and those for melamine are well consistent with the previous results.55,56 The C 1s spectrum of melamine can be deconvoluted into two peaks at 284.6 eV for the adventitious graphitic carbon (Cad) and 287.5 eV corresponding to the three-coordinated carbon (C3N) in the triazine unit, respectively. Interestingly, the fitted C3N peak for melem (at 287.9 eV) shows a notable chemical shift of +0.4 eV, corresponding to the promoted π-electron delocalization in the heptazine system (Figure 2f). This is also supported by the variation of the detected π-excitation peaks, which is located at 294.1 eV for melamine and shifted to 293.7 eV for melam and then to 293.5 eV for melem. The N 1s spectrum of melamine can be fitted by three peaks at 398.1 eV for the C–N=C bonding state (N2C), 399.1 eV for the normal bonding state of the terminal amine groups (NA), and 399.7 eV possibly arising from the alternative resonance form of the amines (NA2),55 respectively. As for melam and melem, an additional peak can be fitted at 398.7 and 398.9 eV in each N 1s spectrum, which could be attributed to the bridging 2C–NH group (NB) and the three-coordinated nitrogen in the heptazine unit (N3C), respectively. Because the HOMO electrons in these three compounds are specifically localized at the N2C atoms (Figure 2), the corresponding N2C peak in the melem spectrum (at 398.3 eV) only shows a small chemical shift of +0.2 eV with respect to those of melamine and melam. By contrast, as shown in Figure 4c, the observed chemical shifts for the NA (NA2) bonding state are more pronounced, which is well correlated to those for the C3N peaks, indicating that the π-electron delocalization surrounding the C3N atoms has a notable effect on the chemical bonding states of the terminal amine groups. Meanwhile, the π-excitation satellite peak is found to be centered at 405.0 eV for melamine and shifted to 404.2 eV for melem; this negative chemical shift is also in line with that observed in the C 1s spectra (Figure 4b). To sum up, the observed XPS chemical shifts for various bonding states are excellently consistent with the DFT calculation results presented above. Finally, the determined compositions and atomic C/N ratios, as well as the integrated component ratios between the different bonding states in the deconvoluted N 1s spectra, have been summarized in Table 2, and the detailed fitting results have also been listed in Table S5.
Figure 4.
(a) XPS survey spectra and deconvoluted (b) C 1s and (c) N 1s high-resolution XPS spectra of melamine, melam, and melem, respectively.
Table 2. Compositions and Atomic C/N Ratios of the Samples Determined by XPS Measurements and Component Ratios between the Deconvoluted Bonding States in the High-Resolution N 1s XPS Spectra.
| composition |
component
ratio in N 1s spectraa |
||||||
|---|---|---|---|---|---|---|---|
| compound | C (at %) | N (at %) | O (at %) | C/Nb | (NA + NA2)/N2C | NB/N2C | N3C/N2C |
| melamine | 37.02 | 61.15 | 1.83 | 0.48 (0.50)c | 1.07 (1.00) | ||
| melam | 41.51 | 55.72 | 2.77 | 0.59 (0.55) | 0.66 (0.67) | 0.19 (0.17) | |
| melem | 41.84 | 55.97 | 2.19 | 0.63 (0.60) | 0.57 (0.50) | 0.16 (0.17) | |
See Table S5 for the fitting details of the high-resolution XPS spectra.
The component of the adventitious graphitic carbon (Cad) in the corresponding C 1s spectrum has been excluded to determine the atomic C/N ratio.
The item presented in each bracket is the corresponding theoretical value derived from the molecular formula.
The morphologies and microstructures of the samples were characterized by scanning electron microscopy (SEM). As shown in Figure 5a–c, the particle sizes of the samples show a wide distribution from several to 10 μm. Most of the melamine particles are regularly shaped with a smooth surface, corresponding to its good crystallinity. After thermal condensation, however, the arbitrary aggregation makes the powders of melam and melem disorderly stacked, resulting in their rough surfaces. The melam sample even exhibits a porous feature because of its complex molecular structure (see Scheme 1). Accordingly, the measured N2 adsorption–desorption isotherms of the samples (Figure 5d) are well related to their microstructures. The calculated Brunauer–Emmett–Teller surface area (SBET) of melamine is 0.86 m2 g–1 with a nearly zero pore volume, while the SBET and pore volume of melam are found to be 7.98 m2 g–1 and 0.05 cm3 g–1, higher than those of melem (5.63 m2 g–1 and 0.02 cm3 g–1).
Figure 5.
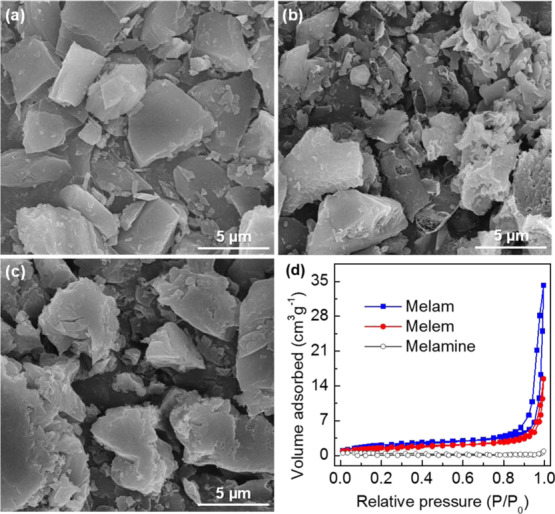
SEM images of (a) melamine, (b) melam, and (c) melem powders, respectively. (d) Nitrogen adsorption–desorption isotherms of the samples.
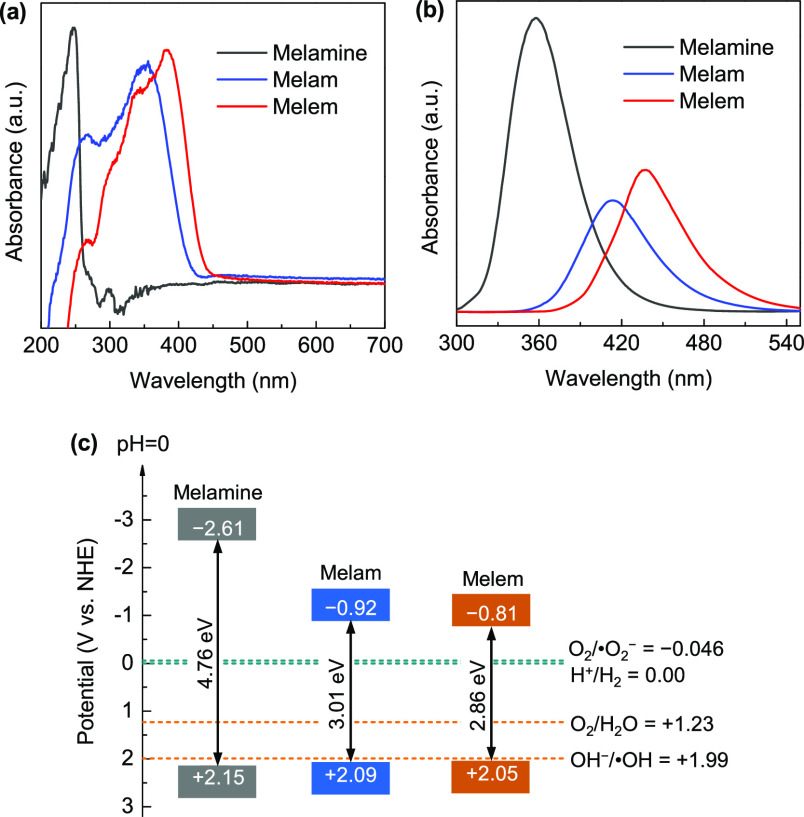
Figure 6a shows the UV–vis diffuse reflection spectra of the samples. The recorded negative absorption in the UV range comes from the stronger adsorption of the BaSiO4 reference. Compared with that of melamine, the absorption edges of melam and melem show remarkable red shifts. The band gaps derived from the Kubelka–Munk plots (Figure S4a) are 4.76 eV for melamine, 3.01 eV for melam, and 2.86 eV for melem, respectively. The trend of band-gap narrowing is in agreement with the theoretical results (Table S3), but the experimentally determined values are notably smaller, probably because of their structural disorders and the large binding energies of the photoinduced excitons.57 The VB edges of the samples were estimated from the high-resolution XPS VB spectra (Figure S4b), which shows a small shift from 2.15 eV for melamine to 2.05 eV for melem. This is reasonable because the VB edges of these compounds predominately originate from the N2C atoms, where the HOMOs show a localized feature (see Figure 2); this can also be revealed by the slight chemical shift of the N2C bonding state in the N 1s XPS spectra (Figure 4c). The photoluminescence (PL) spectra of the samples are shown in Figure 6b. The characteristic π–π* transition PL emission is centered at 357 nm for melamine, exhibiting a red shift to 414 nm for melam and 437 nm for melem, consistent with the narrowing tendency of their band gaps. Meanwhile, the PL emissions of melam and melem are notably suppressed in comparison to that of melamine, revealing the promoted separation rate of the photoinduced charge carriers. The determined band structure alignments of the samples are schematically shown in Figure 6c, and their band gaps cover the required redox overpotentials for both O2/•O2– (−0.046 V vs NHE) and OH/•OH (+1.99 V vs NHE),58 which suggest that under proper light irradiation, the induced charge carriers could simultaneously generate •O2– and •OH radicals to drive potential photocatalytic reactions.
Figure 6.
(a) UV–vis diffuse reflectance spectra, (b) PL spectra with an excitation of 280 nm, and (c) schematic illustration of the band structure alignments of melamine, melam, and melem, respectively.
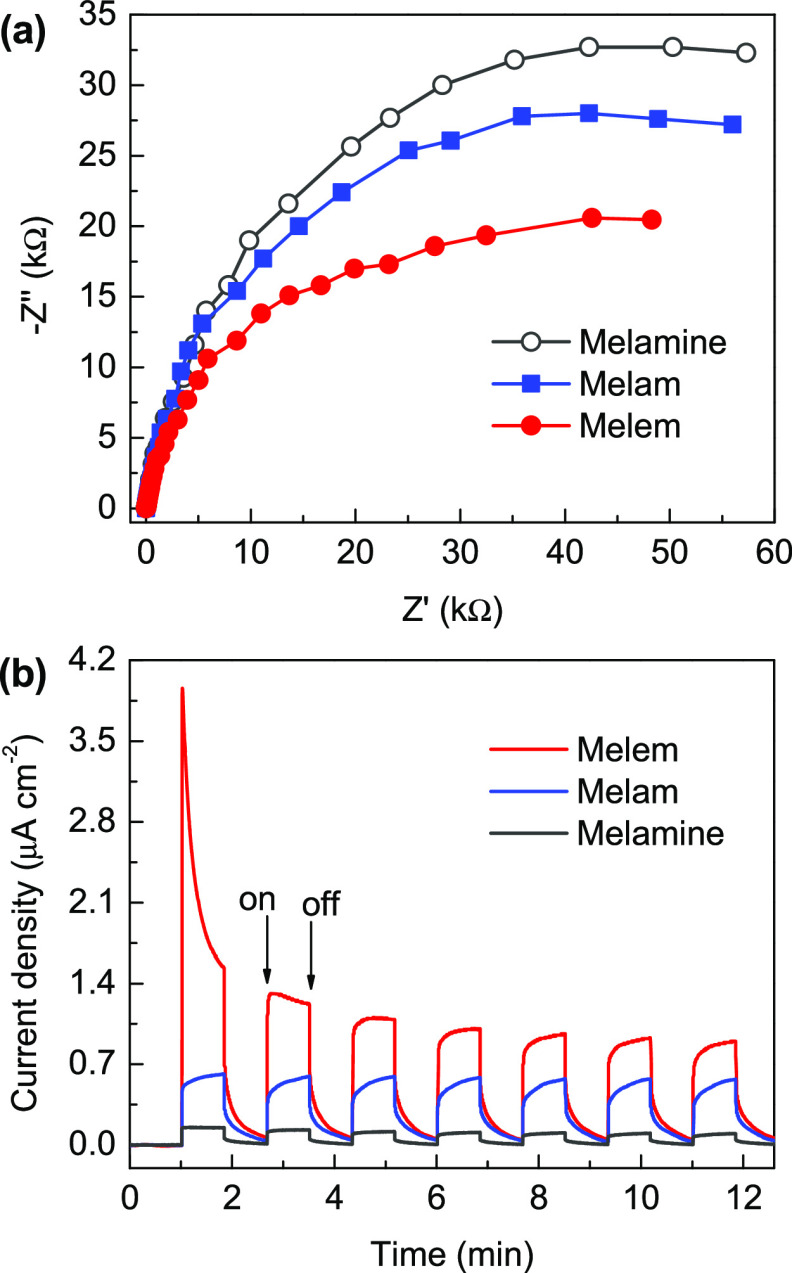
Figure 7a shows the measured electrochemical impedance spectroscopy (EIS) spectra of the samples. As expected, the recorded arc radius for the Nyquist plot of melem is notably smaller than those of melamine and melam, indicating that this heptazine-based system has intrinsically lower resistance for charge-carrier transport than those based on the triazine unit. The heptazine core can not only modulate the light absorption toward longer wavelengths but also suppress the radiative charge recombination (Figure 6); therefore, the photocurrent response of melem is remarkably enhanced (Figure 7b), indicating the promoted dissociation and transport process of the photoinduced charge carriers. According to the measured photoelectrochemical results, both melam and melem are expected to show notable photocatalytic activities.
Figure 7.
(a) Nyquist plots of EIS of melamine, melam, and melem. (b) Transient photocurrent responses measured at a bias potential of +0.5 V vs Ag/AgCl reference under the illumination of a chopped UV–visible light (λ > 300 nm).
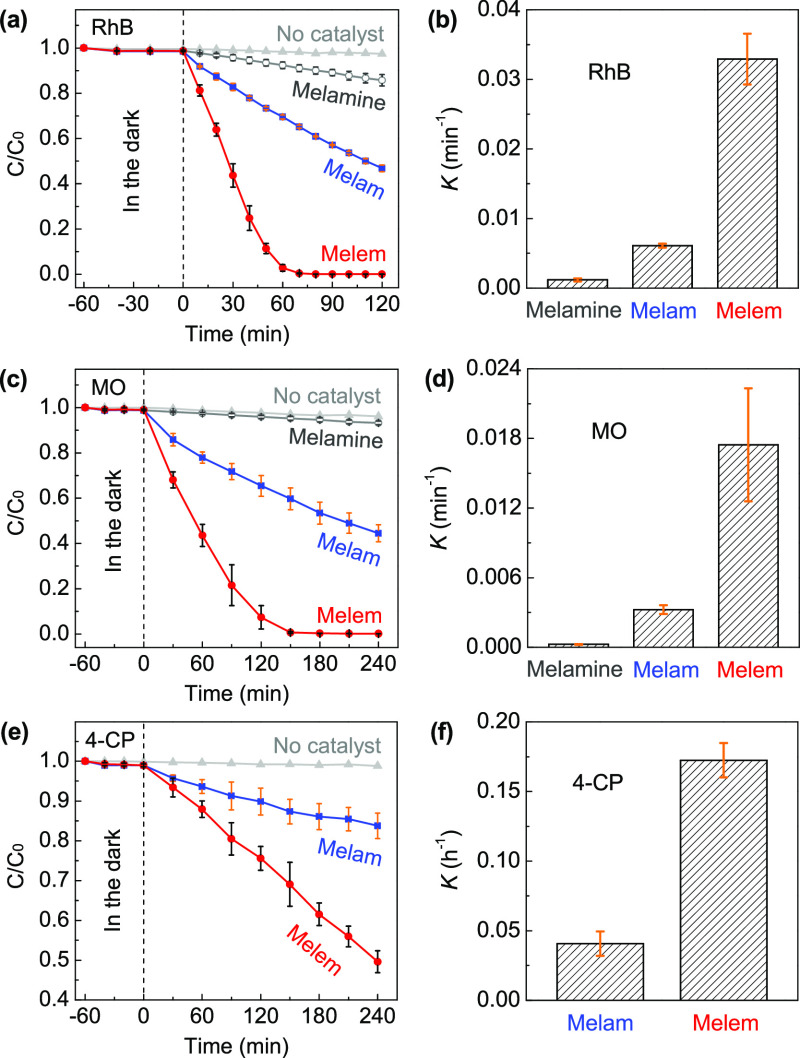
Note that the hydrogen evolution process commonly involves sacrificial agents and cocatalysts (such as Pt), making the reactions much more complicated to be understood.23,59 Therefore, in this study, the photocatalytic performance was extensively evaluated by the direct degradation of different model molecules including rhodamine B (RhB), methyl orange (MO), and 4-chlorophenol (4-CP). We first measured the degradation process of RhB under visible light illumination (λ > 420 nm). As shown in Figure S5, compared to the well-polymerized g-CN, even melem shows a very low efficiency; after being irradiated for 2 h, only ∼11% of RhB has been degraded. When the UV–visible light was employed (λ > 300 nm), RhB can be completely degraded within 80 min catalyzed by melem (Figure 8a), whereas for melam, there is still around 60% RhB left in the aqueous solution. It should be noted that melamine exhibits an extremely slow degradation because its absorption edge is inherently shorter than 300 nm (Figure 6a); herein, we suggest that the observed concentration decrease of RhB came from the self-sensitization-induced degradation.60 This is also supported by its nearly negligible degradation efficiency for the more robust MO (Figure 8c). The first-order degradation constant (K) of RhB is estimated to be 0.0329 min–1 for melem (Figure 8b), which is 5.40 times higher than that of melam (0.0061 min–1). Compared to RhB, both MO and 4-CP are much harder to be degraded (Figure 8c,e), whereas the degradation processes further confirm the remarkably improved activity of melem. The derived K constants of MO are 0.0033 min–1 for melam and 0.0175 min–1 for melem (Figure 8d) and those of 4-CP are 0.0407 and 0.1725 h–1 (Figure 8f), respectively. No convinced results have been obtained for 4-CP degradation by melamine because their spectral absorption ranges are severely overlapped, and the better dispersibility of melamine makes it very difficult to be completely removed from the suspension. The raw degradation data and typical time-dependent evolution of the UV–vis absorption spectra have been shown in Figures S6 and S7, respectively.
Figure 8.
Photodegradation process and the corresponding first-order degradation constant (K) of (a,b) RhB, (c,d) MO, and (e,f) 4-CP under UV–visible light irradiation (λ > 300 nm). The presented average values and standard deviations were determined from three data points for each condition. The raw data have been shown in Figure S6.
To test the catalytic stability of melam and melem, recycling degradation of RhB has been carried out for five continual runs, and no obvious performance deactivation was observed during the whole process (Figure S8). Subsequently, the used catalyst powders were carefully collected and recharacterized, and the results did not show notable differences on the structural and chemical bonding characteristics (Figure S9), which confirm their good reproducibility and stability, indicating that both melam and melem can be used as effective solar-responsive photocatalysts.
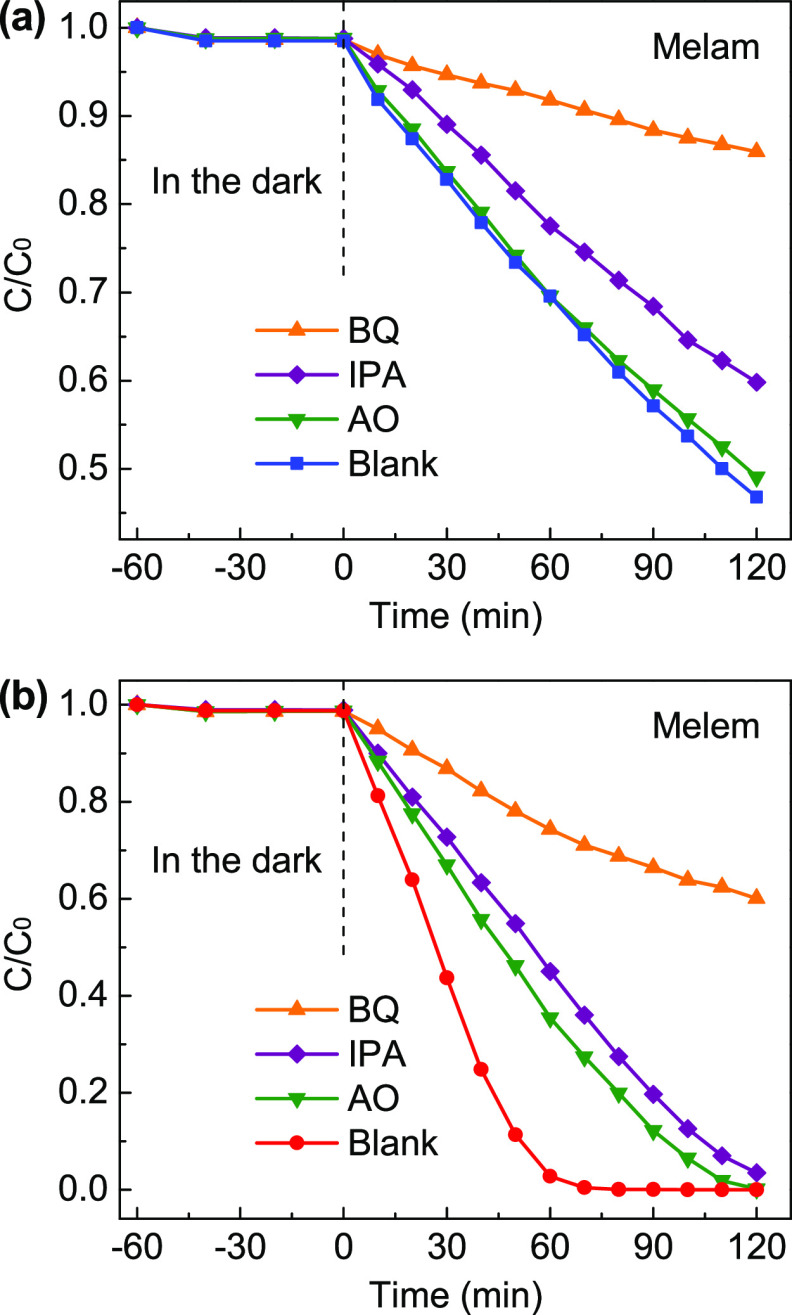
It is known that the photocatalytic oxidation of dyes undergoes irreversible transformation through a variety of different mechanisms, during which the photoinduced h+, as well as the subsequently produced •O2– and •OH radicals, may play the predominant roles.58,61 In order to determine the major reactive species responsible for the photocatalytic activities of melam and melem, trapping experiments for the degradation of RhB were further carried out by adding different scavengers: ammonium oxalate (AO) was used as the scavenger for h+, p-benzoquinone (BQ) for •O2–, and isopropyl alcohol (IPA) for •OH radicals, respectively. As shown in Figure 9, the degradation rates of both melam and melem have been dramatically suppressed by adding 1 mM BQ, revealing the predominant degradation effect of the generated •O2– radicals. Interestingly, both h+ and •OH radicals are found to be the supplementary active species for the degradation process catalyzed by melem; however, for melam, the contribution of •OH is pronounced, while that of h+ is negligible. As shown in Figure 6c, the VB edge of melem is located at +2.05 eV, which slightly surpasses the standard redox potential of OH–/•OH (+1.99 V vs NHE); therefore, the photoinduced h+ can partially oxidize OH– to produce •OH radicals, which makes both of them effective for the degradation process. Nevertheless, the more positive VB edge of melam (+2.09 eV) will strengthen the oxidation activity of the photoinduced h+ and thus facilitate the rapid generation of •OH radicals, which in turn suppresses the oxidation reaction directly driven by h+. The photocatalytic mechanisms of melam and melem at the VB side are quite different from that of the polymeric g-CN,53,61 which possesses a VB edge around +1.8 eV that is energetically unsatisfied for the production of •OH. As a result, the major reactive species were usually found to be •O2– and h+ for the degradation reactions catalyzed by g-CN, whereas for melam and melem, the produced •OH radicals play an important role in their photocatalytic activities.
Figure 9.
Control experiments for the degradation of RhB under UV–visible light irradiation (λ > 300 nm) without (blank) or with different scavengers catalyzed by (a) melam and (b) melem, respectively.
A detailed comparison on the variations of HOMOs/LUMOs of these three compounds can provide a better understanding of the related catalytic mechanism. As shown in Figure 2, the more the C atoms involved in the HOMOs of the heterocyclic cores, the more the HOMOs localized at the bonded NA atoms of the terminal amines; correspondingly, the more the LUMOs preferentially centered at the C atoms, the more the linked NA atoms converting to a LUMO state. The frontier electronic orbitals in the triazine unit of melamine are of a highly nonuniform distribution; thereby, the terminal amines contribute to both HOMOs and LUMOs. The localized and partially overlapped orbitals in the whole molecule could increase the binding energy of the photoinduced excitons and thus facilitate their recombination. As far as melam is concerned, the frontier orbitals in the two triazine units are quite similar to that of melamine. Nevertheless, although the NB atom is found to be nearly bare for both HOMO and LUMO, it indeed affects the specific LUMO distribution at the two neighboring C atoms to show a localized feature, which in turn triggers the domino-like arrangement of the LUMOs in the two triazine rings (see Figure 2d). As a result, all other C atoms exhibit relatively delocalized LUMOs across one of their adjacent N2C atoms, to which the bonded NA atoms only have very small contributions to both the HOMOs and LUMOs. This unique arrangement of the frontier orbitals in melam, especially the localized LUMOs of the C bonded to NB, could play important roles in its photocatalytic activity. On the contrary, the extended heptazine skeleton in melem results in uniformly distributed and well complementary HOMOs and LUMOs (Figure 2e,f), which would promote the dissociation of the photoinduced charge carriers and thus suppress their recombination (Figure 6b). Note that the centered N3C atom shows a notable contribution to the LUMO state because of its pronounced sp2 hybridization feature,51,52 which could facilitate the charge-trapping process. Meanwhile, the terminal amine groups are defined to contribute LUMOs solely, which are favorable to produce electrons and thus serve as primary reduction sites for the possible photocatalytic reactions.31 These two combinatorial effects intrinsically boost the activity of monomeric melem (Figure 8), which could also be the most fundamental mechanism responsible for the attractive photocatalytic performance of the quasi-monomeric g-CN from the point of view of the basic electronic structures. In addition, the bridging NB sites in the polymeric chains could show similar features to that in melam and will induce more localized LUMOs at the neighboring C atoms for charge trapping, which could be another aspect to improve the photocatalytic activity of g-CN as being revealed very recently.62
3. Conclusions
In summary, we have presented a clear understanding on the catalytic mechanism of the polymeric but quasi-monomeric g-CN through a corroborative comparison between the intrinsic electronic properties and the photocatalytic performance of monomeric melem and its triazine-based counterparts. The frontier electronic orbitals of the triazines in melamine and melam are asymmetrically localized and partially overlapped, while the heptazine unit in melem presents an extended π-conjugated system with HOMOs and LUMOs uniformly distributed and well complementary to each other, orchestrating the electronic features in both the heterocyclic core and the terminal amines beneficial for the photoinduced redox processes. Both melam and melem exhibit solar-responsive photocatalytic activities with good stability, while the photocatalytic activity of melem has been confirmed to be substantially enhanced. The appealing electronic features in the monomeric melem will be inherited by polymeric g-CN, giving rise to its good photocatalytic activity that could be further improved by the bridging 2C-NH groups, as revealed by the unique electronic variations between melamine and dimeric melam. Our findings shed light on the mechanistic origin of g-CN as a promising photocatalyst and highlight the specific advantage of the heptazine skeleton from the point of view of its intrinsic electronic structure.
4. Experimental Section
4.1. Materials and Synthesis
Melamine (2,4,6-triamino-s-triazine, C3N6H6, 99%) was purchased from Sigma-Aldrich and used directly. Melam (the dimer of melamine, C6N11H9) and melem (2,5,8-triamino-tri-s-triazine, C6N10H6) were synthesized by heating 10 g of melamine in a tube furnace under a flowing nitrogen atmosphere at 350 and 400 °C, respectively.42 In order to ensure the condensation process as complete as possible, melamine was first heated at the target temperatures for 1 h, the yielded aggregations were milled into powders, and then two identical heating runs were further carried out. Finally, the obtained condensates were heated for a prolonged holding time of 6 h. The heating rate was 10 °C min–1 throughout all the thermal condensation. After naturally cooling down, the synthesized melam and melem samples were carefully milled into powders for further use.
4.2. Characterization
Elemental analyses (EAs) of the samples were performed on a Vario MACRO cube EL C/H/N analyzer. TGA was carried out in the N2 atmosphere with a ramp rate of 10 °C min–1 on a Netzsch STA 449 C TGA/DSC thermal analyzer. XRD patterns were recorded on a Rigaku D/max-2500/PC X-ray diffractometer (Cu Kα1 irradiation, λ = 1.5406 Å). FTIR spectra were recorded on a Bruker Equinox 55 FTIR spectrometer using the standard KBr tablet technique. The morphologies of the samples were investigated using a Hitachi S-4800 scanning electron microscope. The BET surface area was calculated from the nitrogen adsorption–desorption isotherms measured at 77 K by a Quantachrome Autosorb-IQ-2-XR analyzer. UV–vis diffuse reflectance spectroscopy (DRS) spectra of the samples were recorded on a Shimadzu UV-2550 spectrophotometer using BaSO4 as the reference. X-ray photoelectron spectroscopy (XPS) measurements were carried out using a Thermo Scientific ESCALAB 250Xi spectrometer, and the binding energies were calibrated by the C 1s peak of surface adventitious carbon at 284.6 eV. PL spectra were recorded on a Hitachi F-7000 fluorescence spectrophotometer with an excitation of 280 nm.
4.3. Photoelectrochemical Measurements
The sample powders (200 mg) were dispersed in 1 mL of ethanol with 20 mg of ethyl cellulose ethoce and 20 mg of terpineol by sonication for 3 h. The obtained slurry was uniformly spread onto a cleaned indium tin oxide (ITO) glass substrate with an effective area of 1 × 1 cm2. A conventional three-electrode electrochemical cell was used, with a platinum plate as the counter electrode and a standard Ag/AgCl electrode as the reference. The electrolyte was a 0.5 M Na2SO4 aqueous solution. EIS spectra were measured on a Solartron 1280C workstation over a frequency range from 105 to 0.1 Hz with an amplitude of 5 mV. The photocurrent responses were measured on a CHI 660E workstation at a bias potential of 0.5 V, and the light source is a 300 W Xe lamp (CEL-HXF300, Ceaulight, China) equipped with a full spectral aluminum reflector (λ > 300 nm).
4.4. Photocatalytic Activity Evaluation
The photocatalytic activities of the samples were extensively evaluated by the photodegradation of RhB, MO, and 4-CP. The catalyst powder (25 mg) was dispersed in 50 mL of aqueous solutions of RhB (2 × 10⁻⁵ M), MO (2 × 10⁻⁵ M), and 4-CP (1.2 × 10⁻⁴ M), respectively. The suspension was stirred in the dark for 60 min before light irradiation. The light source was the same system used for the photocurrent measurements, with or without a long-pass cutoff filter (λ > 420 nm) for visible or UV–visible light irradiation, respectively. The reactor was continuously cooled by a circulating water system to eliminate the temperature effect. The suspension was withdrawn regularly at a specific time interval to measure the UV–vis absorption spectra by using a Shimadzu UV-2600 spectrophotometer. The degradation efficiencies of different model pollution were evaluated by monitoring the intensity evolution of the corresponding maximum absorption peaks. Reactive oxidative species during the photodegradation were further determined by controlled trapping experiments. Different scavengers were separately added into each of the RhB aqueous solutions: AO was used as the scavenger for the photogenerated holes (h+), BQ for the superoxide radicals (•O2–), and IPA for the hydroxyl radicals (•OH), respectively. The concentration was 1 mM for all the employed scavengers.
4.5. Computational Details
Periodic DFT calculations were performed using the Cambridge Sequential Total Energy Package (CASTEP) code.63 The exchange–correlation (XC) potential was considered by the generalized gradient approximation functional of PBE,64 and the interactions of the valence electrons were described by the ultrasoft pseudopotential.65 The intermolecular weak interactions were considered by the long-range dispersion correction proposed by TS.46 After a series of convergence tests, the plane-wave cutoff energy was set to 520 eV, and the first Brillouin zone was sampled using the Monkhorst–Pack grid with a k-spacing of 2π × 0.04 Å–1 for all the structures. The atomic positions and lattice parameters were fully relaxed by using the BFGS algorithm,66 during which the convergence threshold was set to 5 × 10⁻⁶ eV/atom for energy, 0.02 eV/Å for maximum residual force, and 5 × 10⁻⁴ Å for maximum displacement. The optimized structures were then employed to calculate the electronic properties based on the PBE-TS functional. The band gaps of melamine and melem were further calculated by the Heyd–Scuseria–Ernzerhof (HSE06) hybrid functional48 for comparison, except that of melam due to its large unit cell.41
Acknowledgments
This work was financially supported by the National Natural Science Foundation of China (grant nos. 51772261 and 51572235).
Supporting Information Available
The Supporting Information is available free of charge at https://pubs.acs.org/doi/10.1021/acsomega.0c01607.
Crystallographic data of the three compounds; calculated lattice parameters and total energies; calculated band gaps; details near the VBM and CBM of the band structures and DOS; TGA curves of the samples; raw EA data; comparison of the experimental and theoretical XRD patterns; details of the XPS fitting data; Kubelka–Munk plots of DRS; XPS VB spectra; visible light degradation of RhB; raw data for the UV–visible light photocatalytic activity measurements; typical time-dependent UV–vis absorption spectra for the photodegradation and the corresponding first-order kinetic plots; stability of the photocatalytic activities for RhB degradation; and characterization of the catalysts after recycled degradation (PDF)
Author Contributions
The manuscript was written through contributions of all authors. All authors have given approval to the final version of the manuscript.
The authors declare no competing financial interest.
Supplementary Material
References
- Thomas A.; Fischer A.; Goettmann F.; Antonietti M.; Müller J.-O.; Schlögl R.; Carlsson J. M. Graphitic Carbon Nitride Materials: Variation of Structure and Morphology and Their Use as Metal-Free Catalysts. J. Mater. Chem. 2008, 18, 4893–4908. 10.1039/b800274f. [DOI] [Google Scholar]
- Cao S.; Low J.; Yu J.; Jaroniec M. Polymeric Photocatalysts Based on Graphitic Carbon Nitride. Adv. Mater. 2015, 27, 2150–2176. 10.1002/adma.201500033. [DOI] [PubMed] [Google Scholar]
- Kessler F. K.; Zheng Y.; Schwarz D.; Merschjann C.; Schnick W.; Wang X.; Bojdys M. J. Functional Carbon Nitride Materials — Design Strategies for Electrochemical Devices. Nat. Rev. Mater. 2017, 2, 17030. 10.1038/natrevmats.2017.30. [DOI] [Google Scholar]
- Lotsch B. V.; Döblinger M.; Sehnert J.; Seyfarth L.; Senker J.; Oeckler O.; Schnick W. Unmasking Melon by a Complementary Approach Employing Electron Diffraction, Solid-State NMR Spectroscopy, and Theoretical Calculations—Structural Characterization of a Carbon Nitride Polymer. Chem.—Eur. J. 2007, 13, 4969–4980. 10.1002/chem.200601759. [DOI] [PubMed] [Google Scholar]
- Fina F.; Callear S. K.; Carins G. M.; Irvine J. T. S. Structural Investigation of Graphitic Carbon Nitride via XRD and Neutron Diffraction. Chem. Mater. 2015, 27, 2612–2618. 10.1021/acs.chemmater.5b00411. [DOI] [Google Scholar]
- Wang Y.; Wang X.; Antonietti M. Polymeric Graphitic Carbon Nitride as a Heterogeneous Organocatalyst: From Photochemistry to Multipurpose Catalysis to Sustainable Chemistry. Angew. Chem., Int. Ed. 2012, 51, 68–89. 10.1002/anie.201101182. [DOI] [PubMed] [Google Scholar]
- Wang X.; Maeda K.; Thomas A.; Takanabe K.; Xin G.; Carlsson J. M.; Domen K.; Antonietti M. A Metal-Free Polymeric Photocatalyst for Hydrogen Production from Water under Visible-Light. Nat. Mater. 2009, 8, 76–80. 10.1038/nmat2317. [DOI] [PubMed] [Google Scholar]
- Liu J.; Liu Y.; Liu N.; Han Y.; Zhang X.; Huang H.; Lifshitz Y.; Lee S.-T.; Zhong J.; Kang Z. Metal-Free Efficient Photocatalyst for Stable Visible Water Splitting via a Two-Electron Pathway. Science 2015, 347, 970–974. 10.1126/science.aaa3145. [DOI] [PubMed] [Google Scholar]
- Liao G.; Gong Y.; Zhang L.; Gao H.; Yang G.-J.; Fang B. Semiconductor Polymeric Graphitic Carbon Nitride Photocatalysts: the ‘‘Holy Grail’’ for the Photocatalytic Hydrogen Evolution Reaction under Visible Light. Energy Environ. Sci. 2019, 12, 2080–2147. 10.1039/c9ee00717b. [DOI] [Google Scholar]
- Gao G.; Jiao Y.; Waclawik E. R.; Du A. Single Atom (Pd/Pt) Supported on Graphitic Carbon Nitride as an Efficient Photocatalyst for Visible-Light Reduction of Carbon Dioxide. J. Am. Chem. Soc. 2016, 138, 6292–6297. 10.1021/jacs.6b02692. [DOI] [PubMed] [Google Scholar]
- Barrio J.; Mateo D.; Albero J.; García H.; Shalom M. A Heterogeneous Carbon Nitride–Nickel Photocatalyst for Efficient Low–Temperature CO2 Methanation. Adv. Energy Mater. 2019, 9, 1902738. 10.1002/aenm.201902738. [DOI] [Google Scholar]
- Ong W.-J.; Tan L.-L.; Ng Y. H.; Yong S.-T.; Chai S.-P. Graphitic Carbon Nitride (g-C3N4)-Based Photocatalysts for Artificial Photosynthesis and Environmental Remediation: Are We a Step Closer To Achieving Sustainability?. Chem. Rev. 2016, 116, 7159–7329. 10.1021/acs.chemrev.6b00075. [DOI] [PubMed] [Google Scholar]
- Zeng Y.; Liu X.; Liu C.; Wang L.; Xia Y.; Zhang S.; Luo S.; Pei Y. Scalable One-Step Production of Porous Oxygen-Doped g-C3N4 Nanorods with Effective Electron Separation for Excellent Visible-Light Photocatalytic Activity. Appl. Catal., B 2018, 224, 1–9. 10.1016/j.apcatb.2017.10.042. [DOI] [Google Scholar]
- Su F.; Mathew S. C.; Lipner G.; Fu X.; Antonietti M.; Blechert S.; Wang X. mpg-C3N4-Catalyzed Selective Oxidation of Alcohols Using O2 and Visible Light. J. Am. Chem. Soc. 2010, 132, 16299–16301. 10.1021/ja102866p. [DOI] [PubMed] [Google Scholar]
- Dai Y.; Li C.; Shen Y.; Lim T.; Xu J.; Li Y.; Niemantsverdriet H.; Besenbacher F.; Lock N.; Su R. Light-Tuned Selective Photosynthesis of Azo- and Azoxy-Aromatics using Graphitic C3N4. Nat. Commun. 2018, 9, 60. 10.1038/s41467-017-02527-8. [DOI] [PMC free article] [PubMed] [Google Scholar]
- Martin D. J.; Qiu K.; Shevlin S. A.; Handoko A. D.; Chen X.; Guo Z.; Tang J. Highly Efficient Photocatalytic H2 Evolution from Water Using Visible Light and Structure-Controlled Graphitic Carbon Nitrider. Angew. Chem., Int. Ed. 2014, 53, 9240–9245. 10.1002/anie.201403375. [DOI] [PMC free article] [PubMed] [Google Scholar]
- Zhang H.; Yu A. Photophysics and Photocatalysis of Carbon Nitride Synthesized at Different Temperatures. J. Phys. Chem. C 2014, 118, 11628–11635. 10.1021/jp503477x. [DOI] [Google Scholar]
- Tay Q.; Kanhere P.; Ng C. F.; Chen S.; Chakraborty S.; Huan A. C. H.; Sum T. C.; Ahuja R.; Chen Z. Defect Engineered g-C3N4 for Efficient Visible Light Photocatalytic Hydrogen Production. Chem. Mater. 2015, 27, 4930–4933. 10.1021/acs.chemmater.5b02344. [DOI] [Google Scholar]
- Ji X.; Yuan X.; Wu J.; Yu L.; Guo H.; Wang H.; Zhang H.; Yu D.; Zhao Y. Tuning the Photocatalytic Activity of Graphitic Carbon Nitride by Plasma-Based Surface Modification. ACS Appl. Mater. Interfaces 2017, 9, 24616–24624. 10.1021/acsami.7b06637. [DOI] [PubMed] [Google Scholar]
- Zhou Z.; Zhang Y.; Shen Y.; Liu S.; Zhang Y. Molecular Engineering of Polymeric Carbon Nitride: Advancing Applications from Photocatalysis to Biosensing and More. Chem. Soc. Rev. 2018, 47, 2298–2321. 10.1039/c7cs00840f. [DOI] [PubMed] [Google Scholar]
- Dolai S.; Barrio J.; Peng G.; Grafmüller A.; Shalom M. Tailoring Carbon Nitride Properties and Photoactivity by Interfacial Engineering of Hydrogen-Bonded Frameworks. Nanoscale 2019, 11, 5564–5570. 10.1039/c9nr00711c. [DOI] [PubMed] [Google Scholar]
- Wu H.-Z.; Liu L.-M.; Zhao S.-J. The Effect of Water on the Structural, Electronic and Photocatalytic Properties of Graphitic Carbon Nitride. Phys. Chem. Chem. Phys. 2014, 16, 3299–3304. 10.1039/c3cp54333a. [DOI] [PubMed] [Google Scholar]
- Wang Y.; Vogel A.; Sachs M.; Sprick R. S.; Wilbraham L.; Moniz S. J. A.; Godin R.; Zwijnenburg M. A.; Durrant J. R.; Cooper A. I.; Tang J. Current Understanding and Challenges of Solar-Driven Hydrogen Generation Using Polymeric Photocatalysts. Nat. Energy 2019, 4, 746–760. 10.1038/s41560-019-0456-5. [DOI] [Google Scholar]
- Merschjann C.; Tyborski T.; Orthmann S.; Yang F.; Schwarzburg K.; Lublow M.; Lux-Steiner M.-C.; Schedel-Niedrig T. Photophysics of Polymeric Carbon Nitride: An Optical Quasimonomer. Phys. Rev. B 2013, 87, 205204. 10.1103/physrevb.87.205204. [DOI] [Google Scholar]
- Zambon A.; Mouesca J.-M.; Gheorghiu C.; Bayle P. A.; Pécaut J.; Claeys-Bruno M.; Gambarelli S.; Dubois L. s-Heptazine Oligomers: Promising Structural Models for Graphitic Carbon Nitride. Chem. Sci. 2016, 7, 945–950. 10.1039/c5sc02992a. [DOI] [PMC free article] [PubMed] [Google Scholar]
- Ma X.; Lv Y.; Xu J.; Liu Y.; Zhang R.; Zhu Y. A Strategy of Enhancing the Photoactivity of g-C3N4 via Doping of Nonmetal Elements: A First-Principles Study. J. Phys. Chem. C 2012, 116, 23485–23493. 10.1021/jp308334x. [DOI] [Google Scholar]
- Huang Z.-F.; Song J.; Pan L.; Wang Z.; Zhang X.; Zou J.-J.; Mi W.; Zhang X.; Wang L. Carbon Nitride with Simultaneous Porous Network and O-Doping for Efficient Solar-Energy-Driven Hydrogen Evolution. Nano Energy 2015, 12, 646–656. 10.1016/j.nanoen.2015.01.043. [DOI] [Google Scholar]
- Tu W.; Xu Y.; Wang J.; Zhang B.; Zhou T.; Yin S.; Wu S.; Li C.; Huang Y.; Zhou Y.; Zou Z.; Robertson J.; Kraft M.; Xu R. Investigating the Role of Tunable Nitrogen Vacancies in Graphitic Carbon Nitride Nanosheets for Efficient Visible-Light-Driven H2 Evolution and CO2 Reduction. ACS Sustainable Chem. Eng. 2017, 5, 7260–7268. 10.1021/acssuschemeng.7b01477. [DOI] [Google Scholar]
- Zhu B.; Zhang L.; Cheng B.; Yu J. First-Principle Calculation Study of Tri-s-triazine-Based g-C3N4: A Review. Appl. Catal., B 2018, 224, 983–999. 10.1016/j.apcatb.2017.11.025. [DOI] [Google Scholar]
- Chu S.; Wang C.; Feng J.; Wang Y.; Zou Z. Melem: A Metal-Free Unit for Photocatalytic Hydrogen Evolution. Int. J. Hydrogen Energy 2014, 39, 13519–13526. 10.1016/j.ijhydene.2014.02.052. [DOI] [Google Scholar]
- Lau V. W.-h.; Mesch M. B.; Duppel V.; Blum V.; Senker J.; Lotsch B. V. Low-Molecular-Weight Carbon Nitrides for Solar Hydrogen Evolution. J. Am. Chem. Soc. 2015, 137, 1064–1072. 10.1021/ja511802c. [DOI] [PubMed] [Google Scholar]
- Li L.; Shalom M.; Zhao Y.; Barrio J.; Antonietti M. Surface Polycondensation as an Effective Tool to Activate Organic Crystals: from “Boxed” Semiconductors for Water Oxidation to 1d Carbon Nanotubes. J. Mater. Chem. A 2017, 5, 18502–18508. 10.1039/c7ta04050d. [DOI] [Google Scholar]
- Barrio J.; Karjule N.; Qin J.; Shalom M. Condensation of Supramolecular Assemblies at Low Temperatures as a Tool for the Preparation of Photoactive C3N3O Materials. ChemCatChem 2019, 11, 6295–6300. 10.1002/cctc.201901485. [DOI] [Google Scholar]
- Schwarzer A.; Saplinova T.; Kroke E. Tri-s-triazines (s-Heptazines)—From a “Mystery Molecule” to Industrially Relevant Carbon Nitride Materials. Coord. Chem. Rev. 2013, 257, 2032–2062. 10.1016/j.ccr.2012.12.006. [DOI] [Google Scholar]
- Kroke E.; Schwarz M.; Horath-Bordon E.; Kroll P.; Noll B.; Norman A. D. Tri-s-triazine derivatives. Part I. From trichloro-tri-s-triazine to graphitic C3N4 structures. New J. Chem. 2002, 26, 508–512. 10.1039/b111062b. [DOI] [Google Scholar]
- Zheng W.; Wong N.-B.; Liang X.; Long X.; Tian A. Theoretical Prediction of Properties of Triazidotri-s-triazine and Its Azido-Tetrazole Isomerism. J. Phys. Chem. A 2004, 108, 840–847. 10.1021/jp037078x. [DOI] [Google Scholar]
- Deifallah M.; McMillan P. F.; Corà F. Electronic and Structural Properties of Two-Dimensional Carbon Nitride Graphenes. J. Phys. Chem. C 2008, 112, 5447–5453. 10.1021/jp711483t. [DOI] [Google Scholar]
- Jiang X.; Wang P.; Zhao J. 2D Covalent Triazine Framework: A New Class of Organic Photocatalyst for Water Splitting. J. Mater. Chem. A 2015, 3, 7750–7758. 10.1039/c4ta03438d. [DOI] [Google Scholar]
- Liu B.; Xu B.; Li S.; Du J.; Liu Z.; Zhong W. Heptazine-Based Porous Graphitic Carbon Nitride: A Visible-Light Driven Photocatalyst for Water Splitting. J. Mater. Chem. A 2019, 7, 20799–20805. 10.1039/c9ta03646f. [DOI] [Google Scholar]
- Zheng W.; Wong N.-B.; Wang W.; Zhou G.; Tian A. Theoretical Study of 1,3,4,6,7,9,9b-Heptaazaphenalene and Its Ten Derivatives. J. Phys. Chem. A 2004, 108, 97–106. 10.1021/jp035558i. [DOI] [Google Scholar]
- Lotsch B. V.; Schnick W. New Light on an Old Story: Formation of Melam during Thermal Condensation of Melamine. Chem.—Eur. J. 2007, 13, 4956–4968. 10.1002/chem.200601291. [DOI] [PubMed] [Google Scholar]
- Yuan X.; Luo K.; Liu N.; Ji X.; Liu C.; He J.; Tian G.; Zhao Y.; Yu D. Cluster-Model DFT Simulations of the Infrared Spectra of Triazine-Based Molecular Crystals. Phys. Chem. Chem. Phys. 2018, 20, 20779–20784. 10.1039/c8cp01550c. [DOI] [PubMed] [Google Scholar]
- Yuan X.; Luo K.; Zhang K.; He J.; Zhao Y.; Yu D. Combinatorial Vibration-Mode Assignment for the FTIR Spectrum of Crystalline Melamine: A Strategic Approach toward Theoretical IR Vibrational Calculations of Triazine-Based Compounds. J. Phys. Chem. A 2016, 120, 7427–7433. 10.1021/acs.jpca.6b06015. [DOI] [PubMed] [Google Scholar]
- Wirnhier E.; Mesch M. B.; Senker J.; Schnick W. Formation and Characterization of Melam, Melam Hydrate, and a Melam–Melem Adduct. Chem.—Eur. J. 2013, 19, 2041–2049. 10.1002/chem.201203340. [DOI] [PubMed] [Google Scholar]
- Jürgens B.; Irran E.; Senker J.; Kroll P.; Müller H.; Schnick W. Melem (2,5,8-Triamino-tri-s-triazine), an Important Intermediate during Condensation of Melamine Rings to Graphitic Carbon Nitride: Synthesis, Structure Determination by X-ray Powder Diffractometry, Solid-State NMR, and Theoretical Studies. J. Am. Chem. Soc. 2003, 125, 10288–10300. 10.1021/ja0357689. [DOI] [PubMed] [Google Scholar]
- Tkatchenko A.; Scheffler M. Accurate Molecular van der Waals Interactions from Ground-State electron Density and Free-Atom Reference Data. Phys. Rev. Lett. 2009, 102, 073005. 10.1103/physrevlett.102.073005. [DOI] [PubMed] [Google Scholar]
- Liu N.; Luo X.; Yuan X.; Luo K.; He J.; Yu D.; Zhao Y. Effect of the Bond Polarity on Interlayer Interactions in B–C–N Layered Materials: A Dispersion-Corrected Density Functional Study. Mater. Today Commun. 2020, 22, 100781. 10.1016/j.mtcomm.2019.100781. [DOI] [Google Scholar]
- Heyd J.; Scuseria G. E.; Ernzerhof M. Hybrid Functionals Based on a Screened Coulomb Potential. J. Chem. Phys. 2003, 118, 8207–8215. 10.1063/1.1564060. [DOI] [Google Scholar]
- Zheng H. B.; Chen W.; Gao H.; Wang Y. Y.; Guo H. Y.; Guo S. Q.; Tang Z. L.; Zhang J. Y. Melem: An Efficient Metal-Free Luminescent. J. Mater. Chem. C 2017, 5, 10746–10753. 10.1039/c7tc02966g. [DOI] [Google Scholar]
- Li X.; Melissen S. T. A. G.; Le Bahers T.; Sautet P.; Masters A. F.; Steinmann S. N.; Maschmeyer T. Shining Light on Carbon Nitrides: Leveraging Temperature to Understand Optical Gap Variations. Chem. Mater. 2018, 30, 4253–4262. 10.1021/acs.chemmater.8b00740. [DOI] [Google Scholar]
- Akaike K.; Aoyama K.; Dekubo S.; Onishi A.; Kanai K. Characterizing Electronic Structure near the Energy Gap of Graphitic Carbon Nitride Based on Rational Interpretation of Chemical Analysis. Chem. Mater. 2018, 30, 2341–2352. 10.1021/acs.chemmater.7b05316. [DOI] [Google Scholar]
- Ullah N.; Chen S.; Zhang R. Mechanism of Charge Separation and Frontier Orbital Structure in Graphitic Carbon Nitride and Graphene Quantum Dots. ChemPhysChem 2018, 19, 2534–2539. 10.1002/cphc.201800451. [DOI] [PubMed] [Google Scholar]
- Wu J.; Ji X.; Yuan X.; Zhao Z.; Li Y.; Wen B.; Zhang H.; Yu D.; Zhao Y.; Tian Y. Regulating Polymerization in Graphitic Carbon Nitride To Improve Photocatalytic Activity. Chem. Mater. 2019, 31, 9188–9199. 10.1021/acs.chemmater.9b03987. [DOI] [Google Scholar]
- Wen J.; Li R.; Lu R.; Yu A. Photophysics and Photocatalysis of Melem: A Spectroscopic Reinvestigation. Chem.—Asian J. 2018, 13, 1060–1066. 10.1002/asia.201800186. [DOI] [PubMed] [Google Scholar]
- Dementjev A. P.; de Graaf A.; van de Sanden M. C. M.; Maslakov K. I.; Naumkin A. V.; Serov A. A. X-Ray Photoelectron Spectroscopy Reference Data for Identification of the C3N4 Phase in Carbon Nitrogen Films. Diamond Relat. Mater. 2000, 9, 1904–1907. 10.1016/s0925-9635(00)00345-9. [DOI] [Google Scholar]
- Tan K. L.; Tan B. T. G.; Kang E. T.; Neoh K. G. X-rRay Photoelectron Spectroscopy of the Chemical Structure of Polyaniline. Phys. Rev. B 1989, 39, 8070–8073. 10.1103/physrevb.39.8070. [DOI] [PubMed] [Google Scholar]
- Steinmann S. N.; Melissen S. T. A. G.; Le Bahers T.; Sautet P. Challenges in Calculating the Bandgap of Triazine-Based Carbon Nitride Structures. J. Mater. Chem. A 2017, 5, 5115–5122. 10.1039/c6ta08939a. [DOI] [Google Scholar]
- Yang Y.; Guo Y.; Liu F.; Yuan X.; Guo Y.; Zhang S.; Guo W.; Huo M. Preparation and Enhanced Visible-Light Photocatalytic Activity of Silver Deposited Graphitic Carbon Nitride Plasmonic Photocatalyst. Appl. Catal., B 2013, 142–143, 828–837. 10.1016/j.apcatb.2013.06.026. [DOI] [Google Scholar]
- Lau V. W.-h.; Moudrakovski I.; Botari T.; Weinberger S.; Mesch M. B.; Duppel V.; Senker J.; Blum V.; Lotsch B. V. Rational Design of Carbon Nitride Photocatalysts by Identification of Cyanamide Defects as Catalytically Relevant Sites. Nat. Commun. 2016, 7, 12165. 10.1038/ncomms12165. [DOI] [PMC free article] [PubMed] [Google Scholar]
- Jun Y.-S.; Lee E. Z.; Wang X.; Hong W. H.; Stucky G. D.; Thomas A. From Melamine-Cyanuric Acid Supramolecular Aggregates to Carbon Nitride Hollow Spheres. Adv. Funct. Mater. 2013, 23, 3661–3667. 10.1002/adfm.201203732. [DOI] [Google Scholar]
- Song X.; Yang Q.; Jiang X.; Yin M.; Zhou L. Porous Graphitic Carbon Nitride Nanosheets Prepared under Self-Producing Atmosphere for Highly Improved Photocatalytic Activity. Appl. Catal., B 2017, 217, 322–330. 10.1016/j.apcatb.2017.05.084. [DOI] [Google Scholar]
- Nimbalkar D. B.; Stas M.; Hou S.-S.; Ke S.-C.; Wu J.-J. Microscopic Revelation of Charge-Trapping Sites in Polymeric Carbon Nitrides for Enhanced Photocatalytic Activity by Correlating with Chemical and Electronic Structures. ACS Appl. Mater. Interfaces 2019, 11, 19087–19095. 10.1021/acsami.9b02494. [DOI] [PubMed] [Google Scholar]
- Segall M. D.; Lindan P. J. D.; Probert M. J.; Pickard C. J.; Hasnip P. J.; Clark S. J.; Payne M. C. First-Principles Simulation: Ideas, Illustrations and the CASTEP Code. J. Phys.: Condens. Matter 2002, 14, 2717–2744. 10.1088/0953-8984/14/11/301. [DOI] [Google Scholar]
- Perdew J. P.; Burke K.; Ernzerhof M. Generalized Gradient Approximation Made Simple. Phys. Rev. Lett. 1996, 77, 3865–3868. 10.1103/physrevlett.77.3865. [DOI] [PubMed] [Google Scholar]
- Vanderbilt D. Soft Self-Consistent Pseudopotentials in a Generalized Eigenvalue Formalism. Phys. Rev. B 1990, 41, R7892–R7895. 10.1103/physrevb.41.7892. [DOI] [PubMed] [Google Scholar]
- Pfrommer B. G.; Côté M.; Louie S. G.; Cohen M. L. Relaxation of Crystals with the Quasi-Newton Method. J. Comput. Phys. 1997, 131, 233–240. 10.1006/jcph.1996.5612. [DOI] [Google Scholar]
Associated Data
This section collects any data citations, data availability statements, or supplementary materials included in this article.


