Abstract
The Plant Single Cell RNA-Sequencing Browser, with its comprehensive visualization tools, provides a resource to explore expression information in scRNA-Seq data.
Dear Editor,
High-throughput single cell RNA sequencing (scRNA-Seq) provides unprecedented power for understanding gene expression within complex tissues. The development of droplet-based technologies (Klein et al., 2015; Macosko et al., 2015; Zheng et al., 2017), and the incomparable depth of data it affords, means that scRNA-Seq has become a fundamental method for transcriptomic analysis in metazoan studies. With the first works applying this technology to plant tissues recently published (Denyer et al., 2019; Jean-Baptiste et al., 2019; Ryu et al., 2019; Shulse et al., 2019; Zhang et al., 2019), this is also, rapidly, becoming the case in plants. In anticipation of the proliferation of plant cell data sets, a central browser with tailored visualization and analysis tools is required for biologists to easily investigate scRNA-Seq data at the exceptional resolution it offers. The few current available browsers present scRNA-Seq data in formats that describe expression in broad terms of cell identity and cursory developmental stage but fail to fully embrace the unique and complex spatiotemporal expression information inherent (Supplemental Table S1).
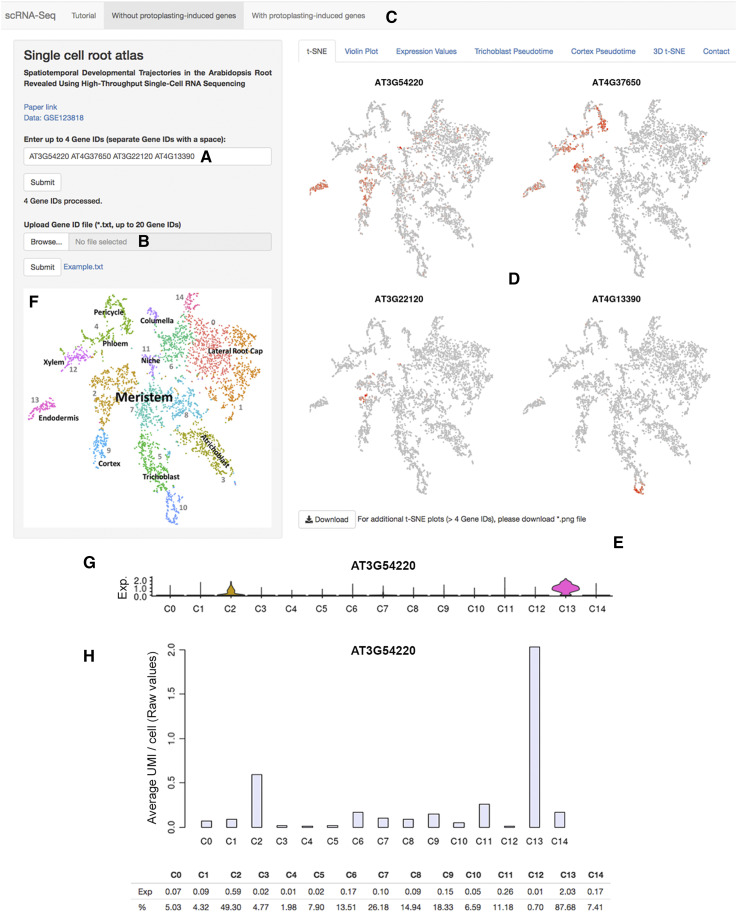
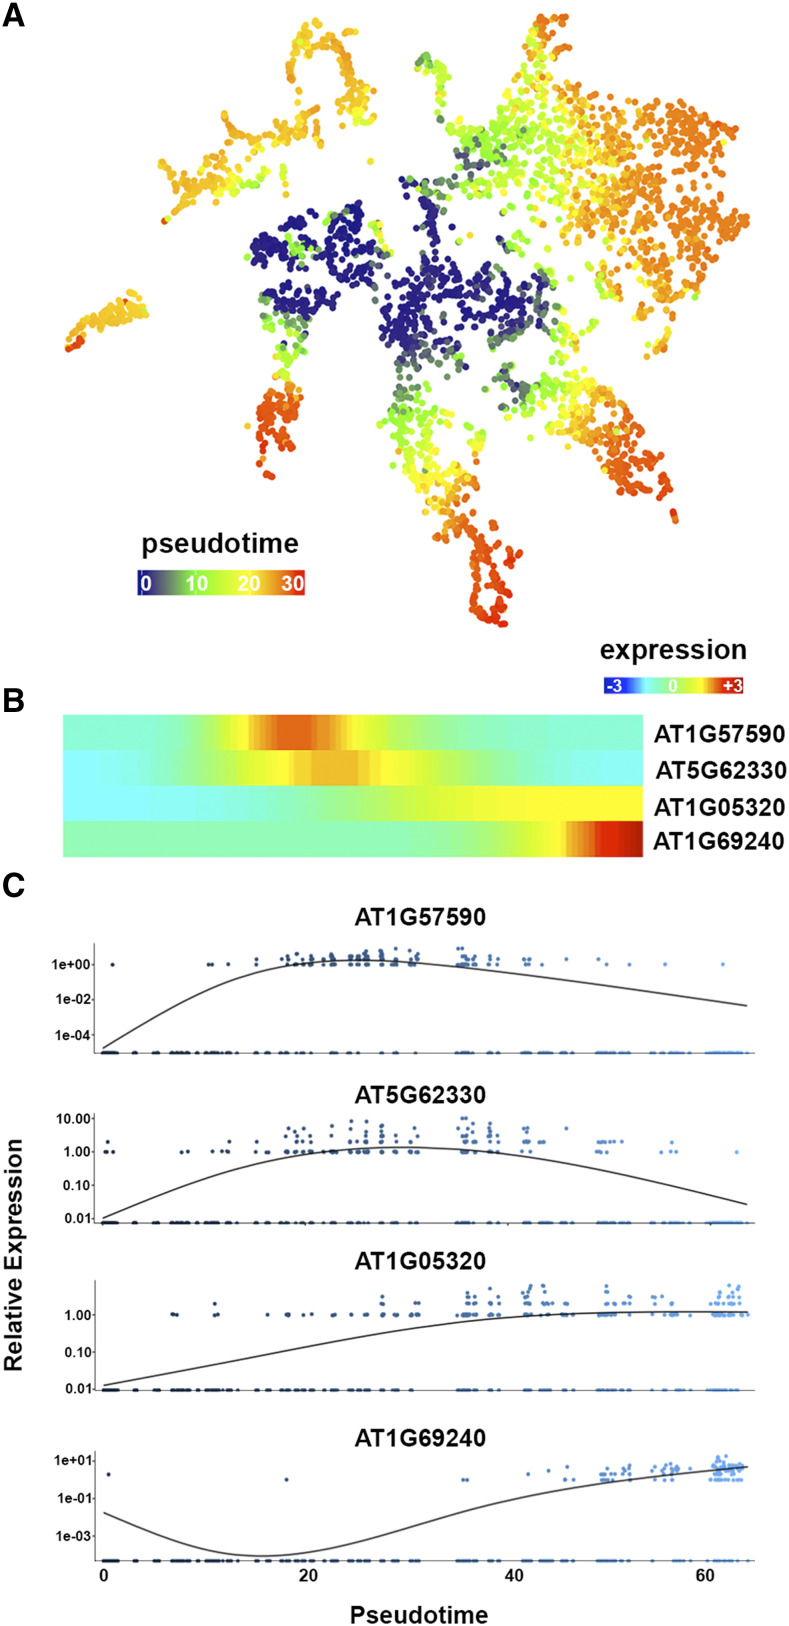
To address this need, we here present a web-based graphical user interface for easy but comprehensive interrogation of plant scRNA-Seq data (https://www.zmbp-resources.uni-tuebingen.de/timmermans/plant-single-cell-browser). The Plant sc-RNA-Seq Browser (PscB) was built using the shiny framework (Chang et al., 2018), which translates user-driven events, such as gene entries and button clicks, into R reactive objects to explore scRNA-Seq data using the Seurat and Monocle packages (Trapnell et al., 2014; Satija et al., 2015) and displays results as dynamic web content. Detailed expression data for individual genes or gene lists can be visualized and downloaded as (1) t-SNE plots, showing expression profiles across the cluster cloud (Fig. 1, A–F), (2) violin plots describing the distribution of expression values of cells within a given cluster (Fig. 1G), and (3) tables summarizing quantitative information on gene expression across clusters (Fig. 1H). In addition, the highly resolved patterns of gene expression across pseudotime-derived developmental trajectories can be visualized as scatterplot graphs and heat maps (Fig. 2). The Browser also provides links to archival databases and relevant publications and includes a detailed customized tutorial to aid data interpretation beyond the cluster level.
Figure 1.
The scRNA-Seq Browser interface. A, Individual genes (up to four genes) can be queried. B, Alternately, a gene list (up to 20 genes) can be uploaded. C, Data sets that include or exclude genes induced by the protoplasting procedure can be queried. D, For genes detected in a data set, t-SNE plots are displayed showing expression across the clusters of cells. This can be localized to a defined subset of cells within a cluster. E, t-SNE plots are downloadable as a .png file. F, Basic cluster maps aid with quick initial interpretation. G, Gene expression values across clusters can be visualized as violin plots depicting the distribution of cells with a given expression value in each cluster. The y axis shows the gene expression level, and the x axis represents the proportion of cells showing a given expression value. H, In addition, histograms showing mean expression per cell for a given gene across clusters, either as raw UMI (unique molecular identifier) counts or as Seurat-normalized data (not shown here), and percentages of cells expressing, are displayed. Violin plots are downloadable as .png files and expression data as comma-separated files. C, Cluster; corresponding cluster identities are shown in F.
Figure 2.
The scRNA-Seq Browser resolves gene expression connected to developmental time. A, Temporal reference map derived from pseudotime analysis of all cells aids in linking expression to stages of differentiation. B and C, Gene expression along individual developmental trajectories provides additional information on temporal expression dynamics associated with differentiation. B, An expression heat map of selected genes dynamically expressed across a pseudotime trajectory is produced. The heat map is oriented with expression in meristematic cells to the left and in mature cells to the right. C, Scatterplots depicting expression dynamics for genes at individual cell resolution along pseudotime are simultaneously produced. Heat maps and scatterplot graphs are downloadable as .png files.
With our recent scRNA-Seq data set as a starting point (Denyer et al., 2019), the Browser facilitates the intuitive assessment of gene expression across all cell types and developmental stages of the Arabidopsis (Arabidopsis thaliana) root. The nearly 5,000 cells profiled manifest in a cluster arrangement that captures the developmental dynamic of the root both with respect to developmental time and the spatial relationships between cell and tissue types. The cluster map shows that cells of the niche and meristem form a central core from which cells of different identities radiate in contrasting directions (Fig. 1F; Denyer et al., 2019). This map provides an immediate detailed view of a gene’s pattern of expression displayed in t-SNE and violin plots (Fig. 1, D and G). Furthermore, downloadable tables summarize mean expression per cell both as raw and Seurat-normalized expression values (Satija et al., 2015), as well as the percentage of cells expressing a given gene in each cluster, offering quantitative information for gene expression comparisons between clusters (Fig. 1H).
The scRNA-Seq data, however, capture spatiotemporal expression information at a resolution far beyond the clusters. Accordingly, many genes show expression in just a subset of cells within a cluster, often reflecting a more intricate distinction in the fate, state, or differentiation of cells (Fig. 1D). For instance, genes expressed in meristematic cells of a given tissue type mark a specific region in the meristem clusters positioned adjacent to their mature counterpart (Fig. 1D; AT3G22120). Likewise, cells at a given phase of the cell cycle colocalize to define subdomains within the meristem clusters. Accompanying the Browser’s visualization tools is a comprehensive tutorial that provides guidance in understanding the intricate distinctions of expression profiles localized to subdomains within cell clusters.
The scRNA-Seq data are particularly powerful in resolving progressions in gene expression connected to developmental time. Pseudotime analysis on our root data set, using the Monocle2 software (Trapnell et al., 2014), reveals cells of progressive maturity spanning out from the central niche and meristem core. A temporal reference map aids in discerning differences in expression connected to differentiation (Figs. 1D and 2A; AT4G13390). Moreover, the Browser provides a searchable format to interrogate gene expression across individual developmental trajectories. For example, the stem cell-to-mature trichoblast, atrichoblast, or cortex cell trajectories reveal waves of gene expression guiding the development of these cell types that, based on evidence from reporter lines, are highly predictive of relative expression along the developing cell files (Denyer et al., 2019). Upon a query, heat maps will display the expression dynamics of relevant genes along a trajectory (Fig. 2B). These are accompanied by a heat map displaying all genes dynamically expressed across pseudotime, for simple comparison. Alongside these heat maps, scatterplot graphs are produced depicting expression dynamics for genes of interest along pseudotime at individual-cell resolution (Fig. 2C). Together, this information can be used to assess the precise temporal gene expression changes that cells undergo during the transition from stem cell through differentiation.
Several challenges, such as cell size and osmotic pressure sensitivities, are concerns for scRNA-Seq applications to plant tissues. However, perhaps the most prominent concern for plant biologists approaching scRNA-Seq is the process of producing viable protoplasts and the downstream transcriptional effects of this protoplasting procedure. The scRNA-Seq Browser uniquely presents the data in two formats: one where genes induced during the protoplasting procedure are removed, and one where they are not. While the inclusion of genes induced by the procedure appears to have little effect on clustering, applications such as marker selection, pseudotime analysis, and gene network development from developmental trajectories appear heavily influenced.
In summary, to address the obvious need for data accessibility tools that can navigate the numerous, complex scRNA-Seq data sets ahead, we developed a curated Plant Single Cell RNA-Sequencing Browser that allows biologists to quickly and easily explore gene expression at a variety of desired depths. Besides the immediate view of a gene’s pattern of expression obtained from t-SNE and violin plots, the Browser offers the unique opportunity to (1) gain quantitative information on gene expression across clusters, (2) visualize highly resolved patterns of expression along pseudotime-derived trajectories, and (3) discern the intricacies of spatiotemporal gene expression information captured within clusters. Additional distinguishing features of this Browser are listed in Supplemental Table S1.
To best serve the community, we invite colleagues to utilize this platform to make their scRNA-Seq data publicly available in this highly interpretable format. To do so, please contact the corresponding author. As each scRNA-Seq atlas, particularly those from tissues other than the root, will contain new intricacies in their cluster arrangement, customized detailed tutorials, such as the one accompanying the current root data set, are a necessity for comprehensive appreciation of the full data inherent. The Browser can be modified and updated to incorporate future analysis and visualization tools. The Plant Single Cell RNA-Sequencing Browser will thus provide an up-to-date and rich centralized resource for plant research, with the interpretative guidance required for properly deciphering this rich data format.
Supplemental Data
The following supplemental materials are available.
Supplemental Table S1. Plant single cell RNA-Seq browsers.
Acknowledgments
We thank Dieter Steinmetz and Andreas Keck for installation and maintenance of the server and Shreyas Meda, Simon Klesen, and Effie Symeonidi for constructive feedback on browser design.
Footnotes
This work was supported by the Alexander von Humboldt-Stiftung (Humboldt Foundation; to M.T).
Articles can be viewed without a subscription.
References
- Chang W, Cheng J, Allaire J, Xie Y, McPherson J (2018) Shiny: Web application framework for R. R package version 1.2.0, https://CRAN.R-project.org/package=shiny
- Denyer T, Ma X, Klesen S, Scacchi E, Nieselt K, Timmermans MCP(2019) Spatiotemporal developmental trajectories in the Arabidopsis root revealed using high-throughput single-cell RNA sequencing. Dev Cell 48: 840–852.e5 [DOI] [PubMed] [Google Scholar]
- Jean-Baptiste K, McFaline-Figueroa JL, Alexandre CM, Dorrity MW, Saunders L, Bubb KL, Trapnell C, Fields S, Queitsch C, Cuperus JT(2019) Dynamics of gene expression in single root cells of Arabidopsis thaliana. Plant Cell 31: 993–1011 [DOI] [PMC free article] [PubMed] [Google Scholar]
- Klein AM, Mazutis L, Akartuna I, Tallapragada N, Veres A, Li V, Peshkin L, Weitz DA, Kirschner MW(2015) Droplet barcoding for single-cell transcriptomics applied to embryonic stem cells. Cell 161: 1187–1201 [DOI] [PMC free article] [PubMed] [Google Scholar]
- Macosko EZ, Basu A, Satija R, Nemesh J, Shekhar K, Goldman M, Tirosh I, Bialas AR, Kamitaki N, Martersteck EM, et al. (2015) Highly parallel genome-wide expression profiling of individual cells using nanoliter droplets. Cell 161: 1202–1214 [DOI] [PMC free article] [PubMed] [Google Scholar]
- Ryu KH, Huang L, Kang HM, Schiefelbein J(2019) Single-cell RNA sequencing resolves molecular relationships among individual plant cells. Plant Physiol 179: 1444–1456 [DOI] [PMC free article] [PubMed] [Google Scholar]
- Satija R, Farrell JA, Gennert D, Schier AF, Regev A(2015) Spatial reconstruction of single-cell gene expression data. Nat Biotechnol 33: 495–502 [DOI] [PMC free article] [PubMed] [Google Scholar]
- Shulse CN, Cole BJ, Ciobanu D, Lin J, Yoshinaga Y, Gouran M, Turco GM, Zhu Y, O’Malley RC, Brady SM, et al. (2019) High-throughput single-cell transcriptome profiling of plant cell types. Cell Rep 27: 2241–2247.e4 [DOI] [PMC free article] [PubMed] [Google Scholar]
- Trapnell C, Cacchiarelli D, Grimsby J, Pokharel P, Li S, Morse M, Lennon NJ, Livak KJ, Mikkelsen TS, Rinn JL(2014) The dynamics and regulators of cell fate decisions are revealed by pseudotemporal ordering of single cells. Nat Biotechnol 32: 381–386 [DOI] [PMC free article] [PubMed] [Google Scholar]
- Zhang TQ, Xu ZG, Shang GD, Wang JW(2019) A single-cell RNA sequencing profiles the developmental landscape of Arabidopsis root. Mol Plant 12: 648–660 [DOI] [PubMed] [Google Scholar]
- Zheng GXY, Terry JM, Belgrader P, Ryvkin P, Bent ZW, Wilson R, Ziraldo SB, Wheeler TD, McDermott GP, Zhu J, et al. (2017) Massively parallel digital transcriptional profiling of single cells. Nat Commun 8: 14049. [DOI] [PMC free article] [PubMed] [Google Scholar]


