

Chlorophyll a fluorescence rapid light response curves improve mechanistic models of drought limitations to photosynthetic electron transport.
Abstract
Crop improvement is crucial to ensuring global food security under climate change, and hence there is a pressing need for phenotypic observations that are both high throughput and improve mechanistic understanding of plant responses to environmental cues and limitations. In this study, chlorophyll a fluorescence light response curves and gas-exchange observations are combined to test the photosynthetic response to moderate drought in four genotypes of Brassica rapa. The quantum yield of PSII (ϕPSII) is here analyzed as an exponential decline under changing light intensity and soil moisture. Both the maximum ϕPSII and the rate of ϕPSII decline across a large range of light intensities (0–1,000 μmol photons m−2 s−1; βPSII) are negatively affected by drought. We introduce an alternative photosynthesis model (βPSII model) incorporating parameters from rapid fluorescence response curves. Specifically, the model uses βPSII as an input for estimating the photosynthetic electron transport rate, which agrees well with two existing photosynthesis models (Farquhar-von Caemmerer-Berry and Yin). The βPSII model represents a major improvement in photosynthesis modeling through the integration of high-throughput fluorescence phenotyping data, resulting in gained parameters of high mechanistic value.
Increasing global populations and environmental change require greater mechanistic understanding of plant responses to fluctuating environmental factors along with meaningful phenotyping for tolerance to stress such as drought (Sheffield and Wood, 2008; Jin et al., 2018). Improved phenotyping technologies can also advance our ability to link physiological mechanisms to rapidly improving genetic information. Among the challenges toward this goal is the genetic complexity behind drought tolerance traits of interest to breeders (Holland, 2007; Shi et al., 2009). Hence, model-assisted phenotyping has been advocated to separate complex traits such as quantum yield of photosynthesis, stomatal conductance, and water use efficiency into manageable mechanistic components (Tardieu, 2003). Mechanistic modeling formalizes plant physiology using interconnected mathematical equations, which describe primary biochemical and first-principles biophysical processes. Improving predictive understanding of crop responses to changing environments will require that mechanistic models directly use phenotypic and environmental data to simulate outcomes sensitive enough to capture possible variation in the expressed traits among unknown genotypes. When these requirements are met, mechanistic models can assist in unraveling the genetic architecture underlying the complex quantitative traits of drought physiology (Reymond et al., 2003; Hammer et al., 2006; Chenu et al., 2009).
Although mechanistic models have evolved to capture the expression of complex plant traits in a changing environment, no current model can dependably capture the impact of drought on photosynthesis (Drake et al., 2017). Photosynthesis models focus on those environmental factors considered critical to net assimilation rates (An; de Witt, 1966; Farquhar et al., 1980; Patrick et al., 2009; Yin et al., 2009). Observations of An and available CO2 (A/Ci) are combined in mechanistic models, such as the Farquhar, von Caemmerer, and Berry (FvCB) model (Farquhar et al., 1980), to reveal biochemical mechanisms underpinning photosynthesis. FvCB estimates An as limited by two primary factors. First, Rubisco-limited An (Ac) is dominated by the response of the maximum rate of carboxylation (Vcmax). Second, light-limited An (AJ) is constrained by the electron transport rate (ETR) across PSII and PSI, which ultimately produces ATP and NADPH needed for the Calvin carboxylation cycle (Farquhar et al., 1980; Von Caemmerer, 2000). Although the FvCB model captures the phenomenological link between ETR and An, it omits mechanistic details of the photosynthetic electron transport chain (Horton et al., 1994; Allen and Pfannschmidt, 2000; Laisk et al., 2002; Yin et al., 2004). Whereas the conceptual power of a reduced complexity model (FvCB) yields crucial insights under nonstressed conditions, it lacks additional mechanistic detail for plants exposed to environmental stress (Urban et al., 2017).
Drought stress impacts both Ac and AJ via interactive mechanisms (Flexas and Medrano, 2002; Bota et al., 2004; Fini et al., 2012). The initial response to water stress is often a decline in stomatal conductance (gs), which impacts CO2 availability for photosynthesis (Medrano et al., 2002; Grassi and Magnani, 2005). Additional CO2 constraints on Ac are possible via mesophyll conductance (gm), limiting CO2 at the site of carboxylation (Flexas et al., 2002, 2018; Niinemets et al., 2009; Pons et al., 2009). Prolonged CO2 limitation can result in overreduction of the photosynthetic electron transport chain (Miller et al., 2010), triggering the production of reactive oxygen species at different sites of the photosynthetic pathway with the potential for photooxidative damage (Krieger-Liszkay et al., 2008; Miller et al., 2010; Sharma et al., 2012). PSII is highly susceptible to oxidative stress, and a variety of mechanisms, collectively called photoprotection, preserve it from irreversible photodamage that causes sustained declines in the overall efficiency of PSII (Murata et al., 2007; Takahashi and Badger, 2011). Heat energy dissipation, state transitions, augmented PSI energy utilization, and changes in leaf absorbance using alternate pigments or chloroplast avoidance are all known mechanisms of photoprotection (Müller et al., 2001; Kasahara et al., 2002; Takahashi and Badger, 2011).
Photosynthesis models must now progress to reflect these stress-induced mechanisms while using high-throughput phenotyping data, including noninvasive measures of leaf spectral reflectance, absorbance, and chlorophyll a fluorescence (Cruz et al., 2016; Kuhlgert et al., 2016; Silva-Perez et al., 2018). Fast and informative techniques provide fine temporal resolution of mechanistic responses to external stressors from mild to lethal stress (Guadagno et al., 2017), which are necessary to improve predictive understanding of photosynthesis responses to drought.
In particular, pulse amplitude modulated (PAM) chlorophyll a fluorescence analysis quantifies PSII activity in response to observed photosynthetically active radiation (Q) and is informative of the status of the photosynthetic electron transport (Maxwell and Johnson, 2000; Kramer et al., 2004a; Baker, 2008). PAM measurements, using the signal of the excitation energy reemitted by the chlorophyll a molecule as fluorescence, are used to define the fate of the absorbed light in the leaf and are currently one of the fastest and most reliable phenotyping tools in photosynthetic measurements (Filek et al., 2015; Gullì et al., 2015; Flood et al., 2016; Guadagno et al., 2017; Gómez et al., 2018). The operating efficiency of PSII (ϕPSII) is a fluorescence parameter calculated from the relative difference in light conditions between the steady-state fluorescence (Fs) and the maximum fluorescence emitted after a saturating flash that closes (reduces) all PSII reaction centers [Fm′; i.e. ϕPSII = (Fm′ − Fs)/Fm′; Genty et al., 1989]. A large fraction of the excitation energy not used in PSII photochemistry or reemitted as fluorescence is dissipated as heat via regulated (e.g. nonphotochemical quenching [NPQ]) and nonregulated energy dissipation (e.g. ϕNO) mechanisms (Müller et al., 2001; Kramer et al., 2004a). Recently, the original derivation of NPQ has been extended, allowing for high-throughput estimates of quantum yield NPQ (ϕNPQt; Tietz et al., 2017). ϕNPQt can be measured in a few seconds, allowing for high-throughput and field applications, and its calculation does not require full relaxation of quenching processes as for the classic NPQ parameter. The combination of fluorescence observations with leaf gas-exchange data has been shown as a powerful way to inform and test models of photosynthesis (Laisk et al., 2002; Yin et al., 2009; Bellasio et al., 2016).
Alternative models of photosynthetic electron transport have been developed using an increasing number of mechanistic details of the Z-scheme for the electron transport (Fig. 1). Within chloroplasts, photosynthetic electron transport occurs across the thylakoid membranes (Fig. 1A), where a hydrogen ion gradient builds up upon the transfer of excited e- to ultimately produce ATP and NADPH, which are used as substrates in the Calvin cycle. Figure 1B summarizes the ETR derivation of the FvCB model. This model assumes that the electron flow is entirely linear (LEF) from PSII to NADP+ reduction, with the CO2 fixation rate from the A/Ci response used to parametrize the maximum ETR (Jmax). Data from the linear portion of a light response curve can be used to parameterize quantum yield on a ΔCO2/ΔQ basis (ϕCO2; Fig. 1B, inset graph). Although the significance of the correlation between the quantum yield of assimilation and the PSII quantum yield has been previously studied (Oberhuber and Edwards, 1993; Pietrini and Massacci, 1998; Singsaas et al., 2001), to the best of our knowledge, the effect of drought on its linearity is still unclear. The FvCB model has been recently implemented to include proportional changes between ETR and An using observations of An and ϕPSII under low-light conditions (Q < 200 μmol photons m−2 s−1) to estimate ETR and AJ (Fig. 1C; Yin et al., 2004, 2009; Bellasio et al., 2016). Quantum yield is estimated on a Δe-/ΔQ basis using the linear portion of the ϕPSII light response (Fig. 1C, top inset graph), but the use of only low-light conditions to characterize PSII quantum yield is limiting. In the Yin model, a lumped parameter, s, is estimated to account for the energy partitioning between photosystems (ρ2), leaf absorbance in the antenna complex (αleaf), and the potential use of electron pathways other than LEF (falt). However, neither FvCB nor the Yin model explicitly addresses the influence of environmental stress on ETR and An, and they are not well equipped to capture the AJ responses of the PSII antenna complex to stressors (Govindjee, 2002; Asada, 2006; Murata et al., 2007; Urban et al., 2017).
Figure 1.

Simplified illustration of the light reactions of photosynthesis representing how three conceptual models account for the photosynthetic electron transport. A, Upon light energy absorption, energy in the form of excited electrons (e−) is transferred from light-harvesting antennae to the reaction centers of PSI and PSII in the chloroplastic thylakoid membranes. This energy transport has been described as a Z-scheme (Hill and Bendall, 1960) whereby e− from PSII produce a transmembrane H+ gradient (used for ATP production) while e− downstream of PSI produce NADPH; both ATP and NADPH are then used for Calvin cycle CO2 fixation. For modeling applications (inset graphs of B, C, and D), photosynthetic quantum yield describes how light energy relates to CO2 fixation (Genty et al., 1989; Martre et al., 2015) and assumptions are made about the processes of electron transfer more or less obscuring (gray boxes in B, C, and D) the actual physiological mechanisms. B, In the traditional FvCB conceptualization, quantum yield is calculated on a photon-to-CO2 basis (ϕCO2; inset graph). Here, ETR processes are ignored, assuming 100% LEF from PSII to NADPH production, leaf absorbance (αleaf) is fixed (0.85), and an implicit 50:50 fractionalization of Q exists between PSII and PSI (ρ2). C, The Yin conceptualization improved the use of PSII physiology by calculating quantum yield on a photon-to-e− basis, using the relationship between ϕPSII and Q under light-limiting conditions (ϕPSII_ll; top inset graph). Yin also used a lumped s parameter defined by the slope of a linear regression of An against (Q ϕPSII)/4 using light < 200 μmol m−2 s−1, where 4 is the number of protons needed to synthesize one ATP. This regression was used to calibrate for three factors, the unknown fraction of nonlinear electron flow around PSI (falt), αleaf, and ρ2 (collectively s; bottom inset graph). D, Our alternative βPSII conceptualization captures the behavior of energy transfer from the antennae complex to the PSII reaction complex. Here, quantum yield is modeled using an exponential decay function (Eq. 1) across all relevant Q conditions, on a photon-to-e− basis, providing estimates of both maximum light-acclimated quantum yield (αPSII) and the decay rate in ϕPSII under increasing Q (βPSII; inset graph). The βPSII model maintains the use of the s parameter to address falt, αleaf, and ρ2. Implementations of modeling photosynthetic electron transport in the Yin and βPSII approaches are represented as incrementing highlighted yellow in C and D.
Here, we introduce an alternative approach (βPSII model) that considers PSII activity across a wide range of light conditions and that can better accommodate the role of stress-related mechanisms (Fig. 1D). We observe that data from the ϕPSII/Q response can be modeled as an exponential decline (Fig. 1D, inset graph). This new parameter as the rate of decline (βPSII) can be used to calculate ETR, AJ, and An under stress conditions such as drought. Using a more complete characterization of quantum yield via the ϕPSII light response, the βPSII model approach accommodates mechanisms of photoprotection including NPQ, chloroplast avoidance, and pigment alterations as well as PSII damage relative to repair (Fig. 1D). Our integration of the ϕPSII decline provides a link between gas conductance-based limitations on Ac and photoprotective limitations impacting AJ, representing a further step in the mechanistic understanding of the electron transport under stress (incremental yellow shadow in Fig. 1). All model parameters (observed and predicted) for the FvCB, Yin, and βPSII models are compared in Table 1, whereas Table 2 describes the equations used in the three photosynthesis models.
Table 1. List of abbreviations used for models (observations, predictions, and parameters).
| Abbreviation | Definition | Units |
|---|---|---|
| An | CO2 assimilation rate observed | μmol m−2 s−1 |
| Ci | Intercellular CO2 partial pressure observed | Pa |
| Tleaf | Leaf temperature observed | °C |
| gs | Conductance to CO2 from atmosphere to intercellular space observed | μmol m−2 s−1 |
| O | Ambient O2 (assumed 21% atmosphere) | Pa |
| Q | Photosynthetically active radiation observed | μmol m−2 s−1 |
| ϕPSII | Operating efficiency of PSII (Fm′ − Fs′/Fm′) observed | e− photon−1 |
| Ac | Predicted Rubisco limited rate of CO2 assimilation | μmol m−2 s−1 |
| Aj | Predicted electron transport limited rate of CO2 assimilation | μmol m−2 s−1 |
| Jm | Predicted rate of electron transport following FvCB | μmol m−2 s−1 |
| Jf | Predicted rate of electron transport following Yin | μmol m−2 s−1 |
| Jl | Predicted rate of electron transport following beta decay model | μmol m−2 s−1 |
| R | Universal gas constant (8.314 J K−1 mol−1) | J K−1 mol−1 |
| αleaf | Absorptance of leaf photosynthetic pigments | % |
| ρ2 | Partitioning of energy between PSII and PSI | % |
| falt | Fraction of electron not using LEF (1 − fpseudo(b)/(1 − fcyc) in Yin et al. (2009) | % |
| s | Lumped parameter (ρ2 αleaf falt; Yin et al., 2009) | % |
| Γ*25 | CO2 photocompensation point (standardized to 25°C) | Pa |
| Kc25 | Michaelis-Menten constant for Rubisco for CO2 (standardized to 25°C) | Pa |
| Ko25 | Michaelis-Menten constant for Rubisco for O2 (standardized to 25°C) | kPa |
| Ei's (Kc, Ko, Rd, Vcmax, Γ*, Jmax, gm) | Activation energy used in Arrhenius function | KJ mol−1 |
| Rd25 | Respiration rate in the dark (standardized to 25°C) | μmol m−2 s−1 |
| gm25 | Mesophyll conductance (standardized to 25°C) | μmol m−2 s−1 Pa−1 |
| Vcmax25 | Maximum rate of carboxylation (standardized to 25°C) | μmol m−2 s−1 |
| Jmax25 | Maximum rate of electron transport (standardized to 25°C) | μmol m−2 s−1 |
| ϕCO2 | Quantum yield of CO2 using Equation 2.6 | mol CO2 mol−1 photon |
| θJ | Curvature factor on electron transport rate predictions Jm and Jf | unitless |
| ϕPSII_ll | Maximum quantum efficiency following Yin using Equation 2.6 | mol e− mol−1 photon |
| βPSII | Decay rate in ϕPSII under increasing Q using Equation 1 | Q -1 |
| αPSII | Modeled ϕPSII as Q approaches zero using Equation 1 | unitless |
| κPSII | Modeled ϕPSII as Q approaches ∞ using Equation 1 | unitless |
Table 2. List of equations used in three photosynthesis models (FvCB, Yin, and βPSII decay).
| Equation No. | Equation | Description |
|---|---|---|
| 2.1 | 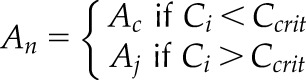 |
An depending on two limiting factors and the critical Ci (Ccrit) |
| 2.2 | 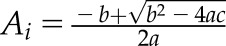 |
General quadratic form for solving Ac, Aj, Jm, and Jf |
| 2.3 | 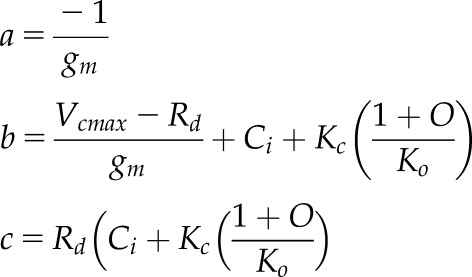 |
Quadratic roots using intercellular CO2 (Ci) and a gm term for describing Ac |
| 2.4 | 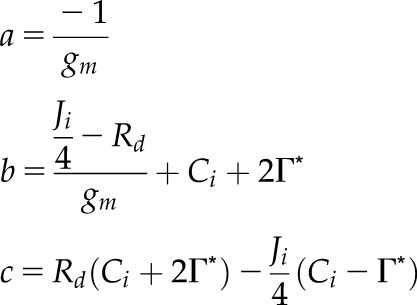 |
Quadratic roots for Aj using Jm, Jf, or Jl |
| 2.5 | 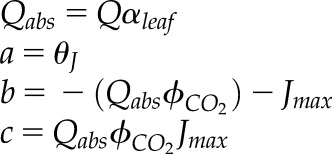 |
Quadratic roots for whole-chain ETR (Jm) as described by Von Caemmerer (2000) assumes αleaf = 0.85 |
| 2.6 | 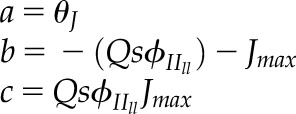 |
Quadratic roots for combined gas-exchange and chlorophyll fluorescence ETR (Jf) as described by Yin et al. (2009), 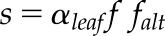
|
| 2.7 | 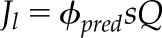 |
βPSII model for full ϕPSII versus Q derivation of ETR (Jl) using Equation 1 to predict ϕII from decay with Q |
We tested the βPSII approach in an effort to analyze physiological responses of An under different soil moisture conditions from full watering to moderate drought in the species Brassica rapa (Supplemental Figs. S1 and S2). High intraspecific physiological diversity with respect to complex quantitative traits such as An and water use efficiency has previously been shown for Brassica species (Edwards et al., 2011, 2012; Franks, 2011; Baker et al., 2015), making it a perfect model to investigate photosynthesis phenotyping tools. Specifically, we tested a turnip crop type (VT), a cultivated oilseed (R500), and two experimental genotypes (recombinant inbred lines [RILs]) developed from a cross between a rapid-cycling genotype (Imb211) and an oilseed crop (R500), thus ensuring a broad range of both photosynthetic and biomass allocation diversity (Edwards et al., 2011; Yarkhunova et al., 2016; Pleban et al., 2018).
We developed a ϕPSII light response curve using a three-parameter exponential function,
where the exponential rate of decline for ϕPSII (βPSII) under increasing light (Q) and the intercept of ϕPSII as Q approaches zero (αPSII) are used to model the responses. Importantly, αPSII derives from measurements taken in light conditions and is different that the classic Fv/Fm parameter derived from dark-adapted measurements (Table 1). The κPSII term represents a non-zero minimum of ϕPSII as Q approaches ∞. To evaluate potential differences in photoprotection strategies due to ETR, we validated the ϕPSII light response parameters (βPSII and αPSII) at different soil moisture conditions. Then, we incorporated these parameters in an alternative photosynthesis model that directly incorporates ϕPSII light response traits into the estimation of ETR, and we assessed how the derived parameters relate to known traits, including Vcmax and gm.
Using rapid measurements with high mechanistic significance, our approach innovatively connects high-throughput phenotyping and biophysical modeling to better predict plant photoprotective strategies. Gained knowledge will help to clarify the complexity of photosynthetic traits, such as drought tolerance, thus improving breeding and management strategies toward more drought-resistant crops with increased final yield.
RESULTS
Establishing Drought Treatments
After sowing, plants were immediately randomized and put into different treatment groups (Supplemental Fig. S1). On experimental day 0 (28 d after sowing), drought was applied via complete water withholding for the droughted cohort. Control pots (well watered [WW]) were watered daily throughout the experiment, and WW plants were measured on experimental days 1, 4, 5, 6, and 9. Droughted plants were assigned to three different groups, and replicate plants were observed on experimental days 4 to 7 (treatment group D1), 9 to 12 (treatment group D2), and 15 (treatment group D3). On experimental day 9, water was reapplied to a subset of droughted plants (R1), and they were observed on experimental days 9 to 12. On experimental day 15, a second subset of droughted plants (R2) was rewatered and observed 6 h after rewatering. Finally, on day 16, the last subset of droughted plants was rewatered and assessed at 30 h after rewatering (R3). For each experimental day, volumetric soil water content (VWC) was measured across all cohorts of plants for the duration of the experiment (Supplemental Fig. S2).
Impact of Drought on Leaf Traits and Genotypic Difference
The progressive drought and recovery (Supplemental Fig. S1) application inevitably impacted the photosynthetic performance of all genotypes. Table 3 summarizes 14 photosynthetic leaf traits assessed on three different experimental days for each B. rapa genotype. As expected, D1 plants were the least impacted by water scarcity for the measured physiological traits. However, early signs of drought stress were already detected. gs was reduced in D1 plants of all genotypes by a mean of 0.16 ± 0.1 mmol m−2 s−1, with the biggest decline for R500 (0.29 mmol m−2 s−1). In VT, the electrochromic shift (ECSt; Δ absorbance 530 nm), which reflects the transthylakoidal ∆H+ gradient, at 300 and 1,000 μmol photon m−2 s−1, increased in D1 plants relative to WW plants. More sustained drought (D2 and D3 plants) results in pronounced changes across all genotypes (Table 3). gs showed further reduction in all genotypes but r46 in D3 plants. LEF was decreased across genotypes, with R500 showing the greatest loss at both 300 and 1,000 μmol photon m−2 s−1.ϕNPQt and ECSt at both 300 and 1,000 μmol m−2 s−1 increased overall in D3 plants. Pigments content as SPAD at 530 nm units and relative chlorophyll content increased in all four genotypes of the D3 cohort. The changes in ECSt, LEF, and SPAD are reflected in a decreased lumped s parameter in D3 plants, which accounts for potential changes in falt, ρ2, and αleaf (Supplemental Fig. S3). These results validate the robustness of high-throughput measurements of fluorescence to pick up early signs of drought stress. The drought treatments applied here can be considered as mild to moderate for B. rapa, with an overall recorded VWC never lower than 3% and plants still capable of recovery upon rewatering for all genotypes (Supplemental Fig. S1). Changes in physiological traits reflect the expected behavior of the four genotypes under drought (Edwards et al., 2011, 2012; Baker et al., 2015; Greenham et al., 2017). Genotypes with high biomass accumulation (R500, r301, and VT) were more impacted at an earlier stage by changes in soil moisture, whereas the small, highly water use-efficient r46 was able to tolerate drought and maintain a stable level of gas exchange despite the decreased LEF. These genotypic differences in drought behavior were confirmed when looking at the onset of NPQt at increased LEF (Supplemental Fig. S4), where R500 and VT showed earlier changes in NPQt values already at lower LEF in comparison with the inbred lines r46 and r301.
Table 3. Genotype × treatment trait estimates.
Modeled traits show median of posterior distribution (95% credible interval range), while observed traits show mean values (sd). Boldface indicates significance relative to well-watered conditions at P < 0.05 or for 95% confidence interval (CI). HDI interval difference not intersecting with zero was used to describe a credible trait variance (Amax and s).
| Trait | Treatment | r301 | r46 | R500 | VT |
|---|---|---|---|---|---|
| Amax | Well watered | 27.70 (25.47, 30.26) | 17.12 (14.99, 19.57) | 25.42 (22.86, 28.13) | 18.25 (15.94, 20.64) |
| (μmol m−2 s−1) | Early drought | 28.70 (26.02, 31.22) | 14.54 (12.73, 16.43) | 25.62 (23.33, 27.74) | 14.71 (12.91, 16.45) |
| (95% CI range) | Late drought | 9.70 (7.63, 11.76) | 8.75 (6.65, 10.71) | 4.75 (2.17, 7.21) | 3.30 (−0.74, 6.83) |
| s | Well watered | 0.33 (0.3, 0.37) | 0.29 (0.25, 0.32) | 0.32 (0.29, 0.34) | 0.31 (0.27, 0.35) |
| unitless | Early drought | 0.36 (0.33, 0.38) | 0.28 (0.25, 0.31) | 0.32 (0.3, 0.34) | 0.29 (0.25, 0.32) |
| (95% CI range) | Late drought | 0.16 (0.12, 0.2) | 0.19 (0.15, 0.22) | 0.26 (0.02, 0.53) | 0.11 (0.05, 0.17) |
| ESCt_300 × 1000 | Well watered | 1.7 (0.35) | 1.7 (0.34) | 1.4 (0.32) | 1.2 (0.42) |
| Δ absorbance 530 nm | Early drought | 1.4 (0.10) | 1.7 (0.49) | 1.8 (0.48) | 1.9 (0.32) |
| (sd) | Late drought | 3.0 (0.44) | 2.4 (0.13) | 2.7 (0.24) | 2.7 (0.21) |
| ESCt_1000 × 1,000 | Well watered | 2.7 (0.15) | 2.6 (0.27) | 2.5 (0.29) | 1.9 (0.78) |
| Δ absorbance 530 nm | Early drought | 2.5 (0.18) | 2.3 (0.35) | 2.3 (0.65) | 2.4 (0.22) |
| (sd) | Late drought | 3.7 (0.43) | 3.1 (0.27) | 3.6 (0.57) | 3.7 (0.07) |
| LEF_300 | Well watered | 61.07 (2.90) | 57.37 (0.26) | 70.25 (4.43) | 64.06 (3.39) |
| (μmol m−2 s−1) | Early drought | 68.72 (0.18 | 57.46 (7.59) | 63.27 (4.34) | 61.23 (3.05 |
| (sd) | Late drought | 34.48 (11.38) | 43.06 (7.59) | 36.21 (5.70) | 42.39 (1.53) |
| LEF_1000 | Well watered | 93.00 (6.78) | 79.14 (8.03) | 106.17 (6.76) | 92.48 (7.64) |
| (μmol m−2 s−1) | Early drought | 105.18 (0.30) | 76.93 (2.65) | 98.07 (17.36) | 88.93 (9.63) |
| (sd) | Late drought | 49.22 (13.29) | 54.62 (10.92) | 51.74 (8.27) | 59.93 (3.61) |
| φNPQt_300 | Well watered | 0.31 (0.03) | 0.33 (0.04) | 0.21 (0.03) | 0.24 (0.04) |
| (%) | Early drought | 0.24 (0.02) | 0.32 (0.01) | 0.27 (0.06) | 0.28 (0.03) |
| (sd) | Late drought | 0.55 (0.05) | 0.49 (0.07) | 0.52 (0.08) | 0.49 (0.03) |
| φNPQt_1000 | Well watered | 0.64 (0.02) | 0.66 (0.02) | 0.57 (0.03) | 0.59 (0.04) |
| (%) | Early drought | 0.6 (0.01) | 0.67 (0.01) | 0.60 (0.06) | 0.62 (0.03) |
| (sd) | Late drought | 0.73 (0.01) | 0.73 (0.02) | 0.69 (0.05) | 0.69 (0.01) |
| φNO_300 | Well watered | 0.21 (0.019) | 0.22 (0.009) | 0.24 (0.011) | 0.25 (0.028) |
| (%) | Early drought | 0.22 (0.018) | 0.23 (0.01) | 0.23 (0.032) | 0.24 (0.011) |
| (sd) | Late drought | 0.18 (0.045) | 0.17 (0.015) | 0.20 (0.036) | 0.18 (0.019) |
| φNO_1000 | Well watered | 0.15 (0.022) | 0.15 (0.006) | 0.18 (0.018) | 0.20 (0.029) |
| (%) | Early drought | 0.15 (0.005) | 0.15 (0.011) | 0.17 (0.021) | 0.17 (0.008) |
| (sd) | Late drought | 0.15 (0.026) | 0.14 (0.007) | 0.19 (0.035) | 0.16 (0.005) |
| SPAD 530 | Well watered | 58.66 (3.93) | 52.42 (6.57) | 58.53 (5.8) | 41.54 (8.2) |
| Early drought | 53.06 (7.57) | 45.61 (7.39) | 56.86 (17.02) | 43.19 (9.4) | |
| (sd) | Late drought | 98.91 (10.11) | 72.59 (11.91) | 102.86 (8.66) | 84.86 (27.68) |
| gs | Well watered | 0.48 (0.07) | 0.21 (0.06) | 0.44 (0.12) | 0.23 (0.11) |
| (mmol m−2 s−1) | Early drought | 0.30 (0.15) | 0.17 (0.07) | 0.15 (0.15) | 0.09 (0.11) |
| (sd) | Late drought | 0.19 (0.14) | 0.17 (0.12) | 0.04 (0.06) | 0.06 (0.06) |
| Leaf temperature | Well watered | −1.2 (1.57) | −0.68 (1.02) | −0.58 (1.19) | −1.03 (0.94) |
| Differential (°C) | Early drought | −0.17 (0.81) | 0.51 (1.32) | 0.45 (1.48) | 1.76 (0.7) |
| (sd) | Late drought | −0.1 (1.41) | 0.53 (0.57) | 0.33 (0.24) | −0.24 (0.35) |
| Relative | Well watered | 45.75 (3.58) | 42.46 (5.91) | 45.72 (3.03) | 29.57 (10.98) |
| Chlorophyll | Early drought | 47.13 (3.18) | 38.12 (2.41) | 41.29 (14.02) | 39.00 (4.99) |
| (sd) | Late drought | 73.52 (2.04) | 56.82 (5.37) | 77.85 (3.67) | 67.44 (10.18) |
Analysis of Rapid Light Response Curves of Fluorescence
Rapid chlorophyll a fluorescence light response curves were taken on 119 replicate leaves during six different experimental days, with each genotype × treatment replicated one to seven times (mean replication rate of 3.3; Supplemental Fig. S1). The variation in sample size was due to time constraints and destructive measurements occurring during the experiment. First, the rapid light response curves for all genotypes and treatments were pooled together with the mean of observed ϕPSII at each Q estimated using the median value of the posterior distributions of the parameter from Equation 1. The decline was then fitted with an exponential model for each genotype and treatment (Fig. 2). All genotypes show a decline in ϕPSII under drought, more pronounced after 15 d (D3), but all plants recovered to prestressed values after rewatering (R1, R2, and R3). The partial increase of ϕPSII can be found in the rapid leaf development of the utilized genotypes, typical of the Brassicaceae. Since the youngest fully developed leaf was utilized at each measuring point, leaf growth and display changed over the course of 15 d, causing different leaf angles, changes in the photosynthetic complex stoichiometry, and different responses to incoming radiation and absorbance. Then, to utilize a more rigorous and probabilistic approach to signify differences (Kruschke, 2014), we used the 95% posterior high-density intervals (HDIs) as a Bayesian probabilistic estimator of difference. Figure 3 summarizes the changes in βPSII and αPSII, estimated following Equation 1, at varying VWC. Genotypes VT and r301 showed credible interval differences at 95% HDI in βPSII for D2 and D3 relative to the WW treatment, whereas r46 and R500 showed a credible interval difference (95% HDI) only for D3 relative to the WW treatment (Fig. 3, A–D).
Figure 2.

ϕPSII across photosynthetically active radiation (Q) of 0 to 1,000 μmol photons m−2 s−1 for four B. rapa genotypes. Observations of r301 (A), r46 (B), R500 (C), and VT (D) occurred over a range of water regimes from well-watered (W1, W2, and W3) to increasing drought (D1, D2, and D3) conditions and different levels of rewatering (R1, R2, and R3). Points are mean values of replicates (n curves = 119, average n curves per replicate = 3.3), and fitted lines use median posterior estimates of a three-parameter exponential decline model (Eq. 1) by genotype × treatment.
Figure 3.

PSII dynamics in response to different water regimes. Decline rate in ϕPSII under increasing light intensity (βPSII [Q−1]; A–D) and maximum light-acclimated PSII efficiency (αPSII; E–H) are shown for the four B. rapa genotypes R500 (A and E), r301 (B and F), r46 (C and G), and VT (D and H) over a range of water regimes, as defined in Figure 2, described by VWC. Points represent median posterior estimates of βPSII and αPSII from a three-parameter exponential decline model (Eq. 1; βPSII and αPSII are derived from n curves = 119, average n curves per replicate = 3.3), vertical bars are 95% high-density intervals of posterior estimates, and horizontal bars are sd values on observations of VWC (n = 153, average n per replicate = 4.25). At right are Bayesian prior distributions of βPSII and αPSII.
All genotypes demonstrated similar recovery patterns in βPSII, with credible differences at 95% HDI for the R2 and R3 treatments relative to D3. For R plants, a less negative βPSII was observed at 30 h after rewatering (R3) with respect to the 6-h period (R2), demonstrating ongoing recovery during that time period. Figure 3, E to H, displays the change of slope in ϕPSII as Q approaches zero, αPSII, with 95% posterior HDI. r301, R500, and VT all show credible interval differences at 95% HDI in αPSII for D3 relative to WW treatment, whereas r46 remains stable in αPSII. The αPSII parameter shows a recovery response similar to βPSII, with r301, R500, and VT all showing credible interval differences at 95% HDI for the R3 treatment with respect to prestressed values.
Comparison of Photosynthesis Models
All three photosynthesis models (FvCB, Yin, and βPSII) performed well across genotypes and treatments when comparing observations of leaf gas exchange with simulated results, using the medians of the posterior (i.e. a more rigorous Bayesian estimator that incorporates uncertainty in both measurements and models; Kruschke, 2014; McElreath, 2016) parameter distributions. For the βPSII model, a comparison of simulated An versus observed An from light response and A/Ci curves results in 0.66 < R < 0.98 across genotypes and treatments (Supplemental Fig. S5).
The βPSII parameter, describing the slope of decline of ϕPSII versus Q, was integrated into the ETR derivation for estimating light-limited photosynthesis, AJ, and the updated ETR description was compared with both the FvCB and Yin photosynthesis models. To quantitatively evaluate the alternate modeling approaches estimating ETR, posterior parameter distributions were compared between the FvCB, Yin, and βPSII decline models (Figs. 4 and 5). The correlation (R) of the medians of these posterior distributions was chosen to evaluate the strength and direction of a linear relationship among alternative parameterizations. For the parameter Vcmax, all models showed close agreement in estimates, with R values of 0.97 to 0.98 (Fig. 4, A–C). For gm, the R value between the FvCB model and the βPSII model was 0.9, between the Yin model and the βPSII model it was 0.9, and between the FvCB model and the Yin model it was 0.99 (Fig. 4, D–F). Additional posterior parameters not common to all three models were compared with factors with similar biophysical meaning, such as quantum yield terms (ϕCO2, ϕ2ll, and αPSII; Fig. 5, A–C). Agreement between the quantum yield terms is particularly strong between ϕ2ll (Yin model) and αPSII (βPSII model; Fig. 5B). The κPSII estimates show little correlation with Jmax in the FvCB or Yin model (Fig. 5, D and E), whereas Jmax estimates in FvCB and Yin are highly correlated. The Yin model and the βPSII model were highly correlated in the lumped s parameter (R = 0.83). The convexity factor, θ, used in the FvCB and Yin models shows a correlation of 0.57, with the Yin estimates closer to the maximum of 1. Finally, a comparison was made between βPSII as described in Equation 1 and the Vcmax and Jmax estimates from the FvCB and Yin models. βPSII showed an R value of 0.81 with Vcmax as described by the FvCB model and 0.83 with Vcmax as described by Yin. βPSII showed R = 0.69 with Jmax estimates of the FvCB model and R = 0.68 with Yin (Supplemental Fig. S6).
Figure 4.

Comparison of posterior median estimates of parameters common to the FvCB, Yin, and βPSII photosynthesis models. A to C, Comparison of Vcmax estimates between βPSII and FvCB, βPSII and Yin, and FvCB and Yin with R for each relationship. D to F, Comparison of gm estimates between βPSII and FvCB, βPSII and Yin, and FvCB and Yin with R for each relationship. Genotypes and water regimes are as defined in Figure 2.
Figure 5.

Comparison of posterior median estimates of parameters in the FvCB, Yin, and βPSII models. A to C, Comparison of quantum yield terms for each model: αPSII (mol photon mol−1 e−) of the βPSII model with ϕCO2 (mol CO2 mol−1 e−) of the FvCB model (A), αPSII with ϕPSII_ll (mol photon mol−1 e−) of the Yin model (B), and ϕJ with ϕPSII_ll (C) with correlation coefficient (R) for each. D and E, Comparison of the s parameter between the Yin model and the βPSII model (D) and comparison of θJ between the Yin model and the FvCB model (E). Genotypes and water regimes are as defined in Figure 2.
Comparison of High- and Low-Throughput Fluorescence Measurements
Full gas-exchange light response curves coupled with fluorescence were taken on 34 leaves on four experimental days with each genotype × treatment replicated one to four times (mean replication rate of 2.3 ± 0.9; Supplemental Fig. S1). The variation in sample size was once again due to time constraints and destructive measurements occurring during the experiment. Specifically, the assessment of gas-exchange light response curves was done at experimental days 1 and 6 for WW plants, at days 5 and 7 for D1 plants, and at days 9 and 13 for D2 plants. Rewatered plants in the cohort R2 were observed at experimental day 10 (Supplemental Fig. S1). The assessment of rapid ϕPSII versus Q curves was done at experimental days 1, 5, and 9 for WW plants, at day 5 for D1 plants, at days 9 and 12 for D2 plants, and at day 13 for D3 plants. Rewatered plants had rapid ϕPSII versus Q observations for cohort R1 on experimental day 9, for cohort R2 on experimental day 13 (6 h after watering was restored), and for cohort R3 on experimental day 14 (30 h after watering was restored). The comparable posterior parameter estimates were matched with posterior parameter estimates from classic gas-exchange light response curves following Equation 1 and shown in Supplemental Figure S7. The median posterior estimates of βPSII show an R value of 0.72, whereas median posterior estimates of αPSII show R = 0.67 (Supplemental Fig. S7, A and C). Next, the correlation between the posterior estimates for both βPSII and αPSII derived using the full βPSII photosynthesis model and the rapid fluorescence curves was tested (Supplemental Fig. S7, B and D). The full βPSII photosynthesis model utilizes coupled gas-exchange and fluorescence observations from a low-throughput infrared gas analyzer (LiCOR 6400XT), whereas the rapid fluorescence curves of ϕPSII versus Q curves are obtained using the high-throughput spectrophotometer MultispeQ. Despite the different times of collection, the two methods agree, with correlations of 0.66 for βPSII and 0.69 for αPSII (Supplemental Fig. S7, B and D).
DISCUSSION
Here, we tested how applying alternative descriptions of quantum yield (ϕCO2, ϕPSII, and βPSII) in photosynthesis models (Fig. 1) can improve the mechanistic realism of electron transport processes and their potential changes under drought. Our βPSII photosynthesis model utilized the full ϕPSII versus Q response, accounting for possible photoprotective mechanisms (i.e. NPQ, changes in absorbance, etc.). All these mechanisms decrease photosynthetic ETR and play crucial roles in the An magnitude under stress, and we have to consider and quantify them to mechanistically improve simulated responses to drought and other environmental changes.
βPSII Dynamics
Our main goal was to explore the use of chlorophyll a fluorescence parameters derived from rapid light curves, collected with a dynamic high-throughput tool, to develop a photosynthesis model for estimating photosynthetic ETR. The major design improvement of the MultispeQ is the quick capture of fluorescence parameters precisely during steady-state illumination (Kuhlgert et al., 2016), and we tested the relationship between rapid fluorescence data from the MultispeQ and the LiCOR 6400-40 fluorimeter (Fig. 6). Single-measurement comparisons grouped by genotype show linear relationships across different light levels and water treatment, with R2 > 0.9 despite the variations in time of day, duration of the actinic light, etc., between the low- and high-throughput measurements due to the fact that the LiCOR instrument is primarily utilized to take simultaneous measurements of gas exchange. Our results build on previous work by Meacham et al. (2017), who posed the question about the use of rapid fluorescence analysis for photosynthesis modeling. However, we experimented beyond their results, using the high-throughput MultispeQ instead of a monitoring PAM device from Walz, thus avoiding the use of aluminum foil to cover the leaves during the measurements and the possible increases in temperature with consequent changes in water vapor exchange (Giorio, 2011; Bücher et al., 2018). Rapid light curves are complex to interpret due to the presence of several components in the photosynthetic apparatus characterized by different time constants (i.e. the time to reach ∼63% of the full response) involved (Pearcy, 1990; Way and Pearcy, 2012). We acknowledge that light harvesting and energy transfer respond nearly instantaneously to changes in the light environment, whereas adjustments in the carbon cycle metabolites can take up to several seconds (Powles, 1984; Geiger and Servaites, 1994). However, the use of a fast analysis is necessary to capture the true light conditions of plants in the field, where they rarely photosynthesize at full capacity (Ort and Melis, 2011). Fast changes in incoming radiation, such as that used during the collection of rapid light curves, can be thought to have similar consequences as for leaves exposed to sunflecks. After an initial uncoupling of the electron transport from CO2 fixation, the metabolite pool has been shown to refill within a few seconds in healthy leaves (Parry et al., 2008; McClain and Sharkey, 2019). The fluorescence calculated parameters have already been shown to have a very dynamic behavior (Porcar-Castell et al., 2012), which leaves room to accommodate for stress-related mechanisms.
Figure 6.

PSII efficiency instrumentation correlation. Comparison of ϕPSII across two instruments, LiCOR 6400 and MultispeQ, and three light intensities (0, 500, and 1,000 μmol photons m−2 s−1 photosynthetically active radiation [PARi]) for the four B. rapa genotypes r301 (A), r46 (B), R500 (C), and VT (D). Each set of observations occurred over a range of water regimes from well-watered (W1) to increasing drought (D1–D3) and rewatering (R2). Points are means of replicates, and error bars represent sd (total n LiCOR 6400 = 162, average n per replicate = 2.7; total n MultispeQ = 213, average n per replicate = 3.6).
The exponential decline of ϕPSII versus Q (Eq. 1) takes into account changes occurring at PSII antenna reaction center complexes and is extremely relevant under stress conditions. These changes are not included in current photosynthesis models (Fig. 1). Identifying the parameter βPSII, meaning the rate of decline of ϕPSII at Q increase, and its dynamics at the onset of water stress is highly valuable to mechanistically elucidate processes of photoprotection and increased photorespiration, which are relevant for the overall reduction of assimilation under stress (Ort and Baker, 2002; Souza et al., 2004). The ϕPSII and Q relationship has been previously used to assess photosynthetic responses using the ETR maximum, showing declines under water stress (Rascher et al., 2004; Li et al., 2008; Batra et al., 2014).
Our results depict a more complete picture of the changes in ϕPSII versus Q under drought, and the parameter βPSII seems to be better suited to explain a range of stress responses (Figs. 2 and 3). The observed declines in βPSII, here observed under drought, may in fact be the result of more or less regulated processes, such as NPQ (Table 3), chloroplast light avoidance, and nonregulated energy dissipation (Müller et al., 2001; Kasahara et al., 2002; Takahashi and Badger, 2011). Furthermore, the modest recovery after a 6-h period in both βPSII and αPSII suggests that these parameters account for more than just fast-regulated photoprotective mechanisms (Dall’Osto et al., 2005; Lambrev et al., 2012). Nearly full recovery by 30 h after the start of rewatering may be due to slow-relaxing and/or unregulated processes, along with protein turnover and repair processes that require a longer time to return to prestress conditions (Nishiyama et al., 2006; Brooks et al., 2013; Malnoë, 2018). Indeed, both slow and rapid light curves are able to trigger slow-relaxing NPQ mechanisms (qI), with qI having lifetime changes similar to those observed during qE (rapid relaxing mechanisms; Müller et al., 2001; Lazár, 2015; Ruban, 2016).
Both βPSII and αPSII depicted genotypic variation relative to drought severity, with r301 showing greatest declines (i.e. transgressive segregation with respect to the RIL parents), followed by R500 and VT, which accumulate the highest amount of aboveground biomass (Fig. 3, B and F). Future work should consider how the slope of variation in the ϕPSII versus Q response relates to previous findings of root-shoot allocation differences occurring under drought (Edwards et al., 2016) as well as explore how variance in βPSII may influence reactive oxygen species production and, when more pronounced declines occur, cellular damage (Reddy et al., 2004).
Implementing Photosynthesis Modeling
Using direct observations of ϕPSII versus Q data as parameters in a leaf photosynthesis model provided a means of quantifying the impacts of PSII photoprotective mechanisms on ETR. Although these protective processes are critical to final net photosynthesis, they are abstracted out of all FvCB-based modeling efforts (Horton et al., 1994; Allen and Pfannschmidt, 2000; Laisk et al., 2002); therefore, current parameterization approaches may be biased by tuning parameters without mechanistic insight. Our βPSII approach extends the development of FvCB-based models using both A/Ci and light response curves in analysis (Holland, 2007; Patrick et al., 2009) to integrate both gas-exchange and fast chlorophyll a fluorescence observations into models (Laisk and Loreto, 1996; Laisk et al., 2002; Yin et al., 2006, 2009). The βPSII photosynthesis model maintains the use of commonly employed parameters, such as Vcmax, Rd, and gm, while shifting away from others, such as Jmax and θJ, that do not fully incorporate stress impacts on ETR, for describing ETR and associated processes. Estimates of the common parameters including Vcmax show strong similarity across the three considered photosynthetic models (Fig. 4). The correlations between the βPSII with Vcmax and Jmax estimates of the FvCB and Yin models is promising for model parameterization. The throughput of ϕPSII versus Q measurements will also increase the number of genotypes used in models and thus better incorporate mechanistically rigorous, genotype-level informed parameters for crop simulation (Boote et al., 2001; Bertin et al., 2010; Archontoulis et al., 2012; Pleban et al., 2018).
The lumped s parameter has a valuable role in accommodating a number of mechanisms affecting the final ETR and showed declines after 13 d of drought (Supplemental Fig. S3). Our photosynthesis model is able to assess the extent of the mechanisms slowing down ETR as a whole. However, the same MultispeQ collects fluorescence values at each recorded pulse. All components of NPQ (qE, qT, and qI) could then be calculated from values of Fm′ and Fm over time, allowing for a detailed energy partitioning analysis. These results could benefit the model and separate physiological (feedback mechanisms) and damage consequences of the stress. Future work, including the use of knockout mutants, such as those for genes involved in NPQ mechanisms, will be needed to disentangle the three factors lumped in s (falt, αleaf, and ρ2). Changes in relative chlorophyll and SPAD at 540 nm affect the overall leaf absorbance (αleaf) and are partially responsible for changes in s (Table 3). Future work evaluating the light-harvesting properties of photosynthetic pigment molecules will help clarify the importance of this component on the lumped s. Isolating changes in αleaf might also use statistical methods to identify dominant shifts in absorption from spectrophotometric data (Baker et al., 2018). It appears likely that the other two factors, falt and ρ2, changed during drought progression, based on the decline in LEF relative to increases in ECSt (Table 3). We speculate that the altered relationship between LEF and ECSt may relate to energetic spillover and changes in cross-membrane ∆H+ triggering unbalanced activity in the PSII-PSI duo, ultimately leading to an increased cyclic electron flow around PSI (Livingston et al., 2010; Strand et al., 2015). Future data-model integration could consider saturation pulse estimation of PSI yield parameters to quantify the specific contribution of falt and ρ2 (Klughammer and Schreiber, 1994). Integration with ECSt data could also assist in understanding the potential for change in how transthylakoidal ∆H+ might be coordinated by the use of cyclic and other nonlinear electron transport pathways (Kramer et al., 2004b).
Our framework offers opportunities to better evaluate stress limitations on quantum yield and ETR. The coupling of s and βPSII as described here is critical for future efforts to model individual photoprotective, photoinhibitory, and photodamaging mechanisms, which are encompassed in these two parameters, albeit in a lumped way. Further implementation of current instrumentation and further modeling approaches may allow for itemizing specific physiological or genetic mechanisms underlining s and βPSII responses to drought (Noctor et al., 2002; Miller et al., 2010; Guadagno et al., 2017).
βPSII Photosynthesis Model Limitations
Our approach needs additional tests under natural and/or higher intensity light conditions to investigate details of photoprotective mechanisms and their behavior under extreme environmental conditions. For instance, the ratio of carotenoids in the PSII antenna complex responsible for NPQ can vary with growing conditions (Kato et al., 2003). Furthermore, photodamage has been shown to be more severe in the UV range and at 500 to 600 nm, and the ratio of photodamage to repair is higher as light intensity increases (Nogués and Baker, 2000; Murata et al., 2007; Zavafer et al., 2015). Also, dynamic fluctuations in light, such as those in natural settings, can have relevant effects on photosynthetic rate (Vialet-Chabrand et al., 2016, 2017), which we expect are more severe under drought, with subsequent recovery processes possibly delayed (Fig. 3). The repair of PSII damage can also be compromised by temperature stress (Murata et al., 2007). Consequently, how βPSII, αPSII, and s respond to field conditions, drought, and other stresses should be further investigated.
The difficult estimation of gm may also affect further implementation of our framework, and alternative methods of gm assessment should be considered. The gm estimation in all three photosynthesis models used the combined fluorometry/gas-exchange approach (Harley et al., 1992; Pons et al., 2009; Archontoulis et al., 2012). Two of the three models (Yin and βPSII) included the s parameter to consider alternative electron pathways influencing the gm estimation (Fig. 4, D–F). State-of-the-art photosynthesis models include a dynamic gm responding to variations in both internal leaf status and external environments (Tazoe et al., 2009; Moualeu-Ngangue et al., 2017). Coupling online isotope discrimination data to the linear and total electron flow, gathered from gas-exchange and fluorometry observations, may help resolve concerns related to gm estimation and allow for the integration of a dynamic gm model into the βPSII method (Pons et al., 2009; Tazoe et al., 2009; Gu and Sun, 2014; Moualeu-Ngangue et al., 2017; Flexas et al., 2018).
Predictive understanding of both photoprotective and gm mechanisms is still in its infancy; the alternative approach we have successfully tested provides a crucial transfer of high-throughput empirical measurements and analyses to mechanistic simulations that are likely to improve predictive understanding of drought and other stress responses across a range of plant species and genotypes. Our βPSII model will further the improvements of current whole-plant crop modeling by the incorporation of first-principles mechanisms (Hammer et al., 2006; Chenu et al., 2009; Wang et al., 2019) through the incorporation of more genetic and omic information into the parameters of biophysical-based models.
MATERIALS AND METHODS
Plant Material
Four genotypes of Brassica rapa were utilized for our analysis: two crop accessions, R500 (oilseed crop, B. rapa ssp. trilocularis [‘Yellow Sarson’]) and VT (VT-089, D’Auvergne Hative); and two RILs (r46 and r301). The RILs are part of a population developed from a cross between the R500 × Imb211 genotypes. The R500 genotype is an oilseed cultivar planted in India for approximately 3,000 years (Prakash and Hinata, 1980) with large allocation to seed production (Baker et al., 2015). The Imb211 genotype is a rapid-cycling line derived from the Wisconsin Fast Plant (Williams and Hill, 1986). The extremely divergent selection history suggests that genetic variation segregating in the RILs may resemble that segregating in crop × wild hybrids found commonly in nature (Adler et al., 1993). The RIL population has been previously described, and the two RILs of interest were chosen based on their transgressively segregating drought stress phenotypes identified in earlier research (Iniguez-Luy et al., 2009; Edwards et al., 2011, 2012; Pleban et al., 2018). Seeds of R500, r46, and r301 were obtained from a single-seed collection bulked at the University of Wyoming in 2011. VT was obtained from the Wageningen University and Research Center for Genetic Resources (CGN#10995).
Growth Conditions
Seeds were germinated and grown in pots (500 mL) filled with a soil mixture (Miracle-Gro Moisture Control Potting Mix [20%, v/v] and Profile Porous Ceramic Greens Grade [80%, v/v]) with the addition of 2 mL of Osmocote 18-6-12 fertilizer (Scotts). Experiments occurred during July and August 2017 at the University at Wyoming in three growth chambers (PGC-9/2; Percival Scientific). Growth chamber conditions were set at a 14-h photoperiod of approximately 250 to 300 μmol photons m−2 s−1 Q, with a 25°C to 30°C/18°C to 22°C day/night cycle, and relative humidity maintained at 45% to 65%. Soil moisture content was monitored daily for all treatment groups (ECH2O/EC5 probe; Decagon). Plants were randomized in three growth chamber compartments with blocks of each treatment, with a randomized mix of four genotypes present in each compartment.
For 4 weeks, all plants were regularly watered to maintain VWC at 0.3 ± 5. At 28 d after sowing, watering was withheld from treatment plants in the droughted and rewatered cohorts (Supplemental Fig. S1). On experimental day 0, drought was applied via complete water withholding for the droughted cohort. Droughted plants were assigned to three different groups and replicate plants observed on experimental days 4 to 7 (treatment group D1), 9 to 12 (treatment group D2), and 15 (treatment group D3). On experimental day 9, water was reapplied to a subset of droughted plants (R1), and they were observed on experimental days 9 to 12. On experimental day 15, a second subset of droughted plants (R2) was rewatered and observed 6 h after rewatering. Finally, on day 16, the last subset of droughted plants was rewatered and assessed at 30 h after rewatering (R3). Soil moisture observations in this study were comparable to those from Guadagno et al. (2017), where the mean VWC was 0.06 ± 0.01 after 14 d of drought; here, the mean VWC after 13 d of drought was 0.05 ± 0.03.
Plant Physiological Observations
Physiological data collection followed the temporal frequency in Supplemental Figure S1. For evaluation of photosynthesis traits throughout the treatment period, A/Ci curves and photosynthetic light response curves were taken (LiCOR 6400XT; LI-COR Biosciences) following established methods (Long and Bernacchi, 2003). Both response curves were measured between 10 am and 4 pm on fully expanded leaves (between fifth and eighth leaves) with cuvette settings at a flow rate of 300 μmol s−1, relative humidity maintained at 50% ± 8%, and temperature maintained at 20°C. A/Ci curves set sample chamber CO2 concentrations to 50, 100, 200, 300, 400, 500, 600, 800, 1,000, 1,250, 1,500, and 2,000 µmol CO2 mol−1 air. A/Ci curves were taken on WW, D1, and R1 plants. Light response curves were measured across 10 light conditions (Q = 2,000, 1,500, 1,000, 500, 250, 125, 60, 30, 15, and 0 µmol photons m−2 s−1). Light response curves were taken on WW, D1, and R1 as well as D2 and D3 plants. For both response curves, PAM fluorescence was measured immediately after gas exchange using a leaf chamber fluorimeter (LiCOR 6400-40; LI-COR Biosciences). With actinic light maintained at setting of curve protocol (λ = 470 nm, 10% blue to obtain values of Fs), a short saturating pulse (0.8 s; ∼8,000 µmol photons m–2 s–1) was applied to measure Fm′ with a short far-red pulse to record the Fo′ value at the end of induction (Baker, 2008). These were used to determine the operating efficiency of PSII photochemistry, (Fm′ − Fs)/ Fm′ = ϕPSII, for light-acclimated conditions (Genty et al., 1989). Fluorescence measurements were taken in conjunction with all changes in Ci or Q for each A/Ci and light response curve.
Further chlorophyll fluorescence observations used a rapid PAM light response protocol developed for the MultispeQ spectrophotometer (PhotosynQ). The protocol is available on the PhotosynQ platform under project title: B. rapa drought and recovery Chl Fl evaluation (https://photosynq.org/projects/b-rapa-drought-and-recovery-chl-fl-evaluation). In a single 5-min clamping with a fully expanded leaf (between fifth and eighth leaves), actinic light (655 nm [Lumileds; LXZ1-PA01]) was incremented at 10 light intensities (1,000, 800, 600, 500, 400, 300, 200, 100, 50, and 0 µmol photons m–2 s–1) for 30 s before a PAM fluorometry sequence was initiated following established methods (Rascher et al., 2000; Datko et al., 2008). After each light acclimation period, the PAM sequences used the classic multiphase flash technique with four rectangular saturation flashes of 4,500, 4,050, 3,600, and 3,150. A linear regression of each maximum fluorescence ramp versus 1/Q was made to determine expected Fm′, used for calculating fluorescence parameters. Recently, the original derivation of NPQ was extended to NPQt, allowing for high-throughput (under 1 min each) yet mechanistically relevant measurements (Tietz et al., 2017). Therefore, this protocol assessed ϕPSII, the fraction of Q dissipated safely as heat (ϕNPQt), and the fraction of Q quenched via unregulated excitation dissipation (ϕNO) at each light intensity. ϕNPQt assumes a constant theoretical maximum dark-adapted fluorescence yield, and ϕNO represents the fraction of light use remaining after accounting for ϕNPQt and ϕPSII [ϕNO = 1 − (ϕNPQt + ϕPSII); Tietz et al., 2017]. From these response curves, LEF was calculated for each Q following LEF = ϕPSII Q αleaf ρ2, where αleaf is assumed to be 0.85 and ρ2 is assumed to be 0.5. Rapid PAM light response curves were taken on plants from each watering cohort (Supplemental Fig. S1).
Total ECSt measurements were obtained at two Q intensities (300 and 1,000 µmol photons m−2 s−1 at 650 nm) using the MutlispeQ (Kuhlgert et al., 2016). ECSt monitors the proton flow into the thylakoid lumen by evaluating shifts in the absorbance of cross-membrane carotenoid pigments (Fig. 1, blue H+ arrows). The carotenoid absorbance spectrum is dependent on the changing electrical gradient produced by proton flow across the thylakoid membrane (Sacksteder et al., 2000). The protocol for these ECSt observations is available on the PhotosynQ platform (https://photosynq.org/projects/b-rapa-drought-and-recovery-ecs-evaluation). ECSt observations were taken on plants of all watering cohorts (Supplemental Fig. S1). Observations of relative chlorophyll content were also measured with a hand-held MultispeQ spectrophotometer on plants of all watering cohorts (Supplemental Fig. S1).
Exponential Decline of ϕPSII Versus Q
Light response data, ϕPSII, from both the LiCOR fluorimeter and the MultispeQ rapid fluorescence protocol were used to model the decline in ϕPSII under increasing Q. A hierarchical Bayesian framework generated genotype × treatment posterior trait distributions of exponential decline parameters. A three-parameter exponential decline function was used following Equation 1:
where αPSII (y intercept) represents the maximum light-adapted ϕPSII, βPSII represents the exponential decline rate in ϕPSII under increasing Q, and κPSII represents a non-zero minimum of ϕPSII as Q approaches ∞. Equation 1 was modeled using rjags (Plummer, 2014), with samples from the posterior parameter distributions generated from a Gibbs sampling method (Plummer, 2003). Model parameters (αPSII, βPSII, and κPSII) were estimated using a three-level hierarchical structure with global, genotype × treatment, and individual plant levels. Priors for the means of the exponential decline parameters followed wide informed normal distributions broadly informed with wide variances. Priors for the precision terms used weakly informed normal distributions (Gelman, 2006). The credible interval divergence at 95% HDI was used to evaluate posterior parameter differences for each treatment time. This comparison metric used in Bayesian analysis allows the identification of definitive portions of the posterior distributions characterized by higher probability density than the regions outside those intervals (Kruschke, 2014, 2018; Kruschke and Liddell, 2018), with more rigorous results and higher predictive power.
Photosynthesis Modeling
Utilizing Bayesian statistics, all photosynthesis models describe how quantum yield and underpinning mechanisms are related to CO2 assimilation under changing light conditions and water availability. The three model formulations are similar to those found in photosynthesis process models while hierarchically incorporating uncertainty and providing probabilistic quantification of parameters. Tables 1 and 2 outline the three modeling approaches used to test the utility of ϕPSII light response data for characterizing ETR and light-limited An. All three approaches estimate An following Equation 2.1 with the estimation of the critical Ci (Ccrit), where Ac shifts to AJ, following methods detailed below. All three approaches estimate Ac using Equations 2.2 and 2.3 (Table 2). The approaches vary in the derivation of photosynthetic ETR. The first approach followed the FvCB model, estimating ETR using information from leaf gas exchange (Eq. 2.5; Farquhar et al., 1980; Farquhar and Wong, 1984; Fig. 1A). This FvCB derivation of ETR for AJ (Jm) requires estimation of three parameters: Jmax, the maximum rate of electron transport; ϕCO2, the quantum yield on a CO2-to-photon basis; and θJ, the convexity factor for the response of ETR to Q. Two other parameters are fixed a priori in FvCB: an equal fractionation of light between PSI and PSII (ρ2 = 0.5), and leaf absorbance (αleaf) is set at 0.85. The second approach, described by Yin et al. (2009), used a combined gas-exchange and fluorescence approach for modeling ETR (Jf; Fig. 1B). The Yin model used ϕPSII data to parameterize PSII efficiency under limiting light (ϕPSII_ll) as well as the lumped parameter, s, which lumps αleaf differences, differences in ρ2, as well as utilization of alternate electron paths, falt, along the Z-scheme (Eq. 2.6). Low-light (0 < Q < 200 μmol photon m−2 s−1) response data (An, Q, and ϕPSII) were subset to estimate Rd, s, and ϕPSII_ll in the Yin model. Rd is estimated as the y intercept of linear regression of An against  . The slope of this regression is used to estimate s. The quantum yield parameter for the Yin model, ϕPSII_ll, was estimated as the y intercept of a linear regression of An against ϕPSII under low Q. Finally, for the third approach, the βPSII photosynthesis model derivation ETR (Jl), the full light response ϕPSII data set was passed in the βPSII model for the estimation of αPSII, βPSII, or κPSII needed to describe ETR (Jl; Fig. 1C). Following Equation 1, the αPSII, βPSII, and κPSII estimates were used to predict ϕPSII at each Q, next Jl was solved following Equation 2.7. βPSII implementation used the same Rd and s estimation as Yin.
All models used a temperature response following an Arrhenius function for Kc, Ko, Vcmax, Jmax, gm, Rd, and Γ*. Each parameter was normalized with respect to 25°C following:
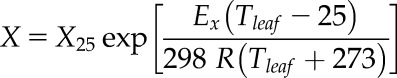 |
where Tleaf is leaf temperature (°C), X25 is the parameter normalized with respect to 25°C, EX is the activation energy of each parameter, and R is the universal gas constant (8.314 J K−1 mol−1). Other temperature response functions were considered, but given the limited variability in Tleaf (mean = 20 ± 0.2), a simple one-parameter equation was selected for analysis.
Ccrit, the Ci at which An transitions from Ac to AJ, was fixed at 285 ppm in all models based on an analysis of Fv′Fm′ under increasing Ci. Fv′Fm′ increases when Ci < Ccrit and remains constant when Ci > Ccrit (Sharkey et al., 2007; Gu et al., 2010; Moualeu-Ngangue et al., 2017). A Bayesian model was employed using a single change point method (Dose and Menzel, 2004) to estimate individual and population-level Ccrit. Results of the change point model found that the posterior population level estimate had a mean of 287.3 with a 95% HDI of 265.1 to 318.7 ppm (Supplemental Fig. S8).
All Ci, An, Q, and Tleaf data from A/Ci and light response curves were used to estimate An traits, an approached used previously (Patrick et al., 2009; Archontoulis et al., 2012), with ϕPSII data supplied to the Yin and βPSII models as described above. Parameter priors for FvCB and shared parameters among the three models were selected based on a recent implementation (Pleban et al., 2018). The code for all three photosynthesis models as well as the simple βPSII decline model are available at https://github.com/jrpleban/.
Supplemental Data
The following supplemental materials are available.
Supplemental Figure S1. Experimental design and observation schedule.
Supplemental Figure S2. Volumetric soil water content dynamics.
Supplemental Figure S3. Changes in lumped s parameter estimates.
Supplemental Figure S4. Onset of the NPQt parameter.
Supplemental Figure S5. Simulated An versus observed An for three photosynthesis models.
Supplemental Figure S6. Correlations of βPSII with classic photosynthetic model parameters.
Supplemental Figure S7. Decline rates of PSII efficiency under changing light conditions.
Supplemental Figure S8. Identification of the transition point between Ac and AJ (Ccrit).
Acknowledgments
We thank Christopher Nieters, Sara Lemli, and Shea Ruggier for assistance in data collection. We thank Xiaonan Tai, Dan Potts, and Diane R. Wang for feedback during article preparation.
Footnotes
This work was supported by the National Science Foundation Plant Genome Research Project (grant nos. IOS–1444571, IOS–1025965, and IOS–1547796), the University at Buffalo Mark Diamond Research Foundation, and the College of Arts and Sciences Dissertation Enhancement Grant.
Articles can be viewed without a subscription.
References
- Adler LS, Wikler K, Wyndham FS, Linder CR, Schmitt J(1993) Potential for persistence of genes escaped from canola: Germination cues in crop, wild, and crop-wild hybrid Brassica rapa. Funct Ecol 7: 736–745 [Google Scholar]
- Allen JF, Pfannschmidt T(2000) Balancing the two photosystems: Photosynthetic electron transfer governs transcription of reaction centre genes in chloroplasts. Philos Trans R Soc Lond B Biol Sci 355: 1351–1359 [DOI] [PMC free article] [PubMed] [Google Scholar]
- Archontoulis SV, Yin X, Vos J, Danalatos NG, Struik PC(2012) Leaf photosynthesis and respiration of three bioenergy crops in relation to temperature and leaf nitrogen: How conserved are biochemical model parameters among crop species? J Exp Bot 63: 895–911 [DOI] [PMC free article] [PubMed] [Google Scholar]
- Asada K.(2006) Production and scavenging of reactive oxygen species in chloroplasts and their functions. Plant Physiol 141: 391–396 [DOI] [PMC free article] [PubMed] [Google Scholar]
- Baker NR.(2008) Chlorophyll fluorescence: A probe of photosynthesis in vivo. Annu Rev Plant Biol 59: 89–113 [DOI] [PubMed] [Google Scholar]
- Baker RL, Leong WF, Brock MT, Markelz RJ, Covington MF, Devisetty UK, Edwards CE, Maloof J, Welch S, Weinig C(2015) Modeling development and quantitative trait mapping reveal independent genetic modules for leaf size and shape. New Phytol 208: 257–268 [DOI] [PubMed] [Google Scholar]
- Baker RL, Leong WF, Welch S, Weinig C(2018) Mapping and predicting non-linear Brassica rapa growth phenotypes based on bayesian and frequentist complex trait estimation. G3 (Bethesda) 8: 1247–1258 [DOI] [PMC free article] [PubMed] [Google Scholar]
- Batra NG, Sharma V, Kumari N(2014) Drought-induced changes in chlorophyll fluorescence, photosynthetic pigments, and thylakoid membrane proteins of Vigna radiata. J Plant Interact 9: 712–721 [Google Scholar]
- Bellasio C, Beerling DJ, Griffiths H(2016) An Excel tool for deriving key photosynthetic parameters from combined gas exchange and chlorophyll fluorescence: Theory and practice. Plant Cell Environ 39: 1180–1197 [DOI] [PubMed] [Google Scholar]
- Bertin N, Martre P, Génard M, Quilot B, Salon C(2010) Under what circumstances can process-based simulation models link genotype to phenotype for complex traits? Case-study of fruit and grain quality traits. J Exp Bot 61: 955–967 [DOI] [PubMed] [Google Scholar]
- Boote KJ, Kropff MJ, Bindraban PS(2001) Physiology and modelling of traits in crop plants: Implications for genetic improvement. Agric Syst 70: 395–420 [Google Scholar]
- Bota J, Medrano H, Flexas J(2004) Is photosynthesis limited by decreased Rubisco activity and RuBP content under progressive water stress? New Phytol 162: 671–681 [DOI] [PubMed] [Google Scholar]
- Brooks MD, Sylak-Glassman EJ, Fleming GR, Niyogi KK(2013) A thioredoxin-like/β-propeller protein maintains the efficiency of light harvesting in Arabidopsis. Proc Natl Acad Sci USA 110: E2733–E2740 [DOI] [PMC free article] [PubMed] [Google Scholar]
- Bücher SF, Bernhardt–Römermann M, Römermann C(2018) Chlorophyll fluorescence and gas exchange measurements in field research: An ecological case study. Photosynthetica 1161–1170 [Google Scholar]
- Chenu K, Chapman SC, Tardieu F, McLean G, Welcker C, Hammer GL(2009) Simulating the yield impacts of organ-level quantitative trait loci associated with drought response in maize: a “gene-to-phenotype” modeling approach. Genetics 183: 1507–1523 [DOI] [PMC free article] [PubMed] [Google Scholar]
- Cruz JA, Savage LJ, Zegarac R, Hall CC, Satoh-Cruz M, Davis GA, Kovac WK, Chen J, Kramer DM(2016) Dynamic environmental photosynthetic imaging reveals emergent phenotypes. Cell Syst 2: 365–377 [DOI] [PubMed] [Google Scholar]
- Dall’Osto L, Caffarri S, Bassi R(2005) A mechanism of nonphotochemical energy dissipation, independent from PsbS, revealed by a conformational change in the antenna protein CP26. Plant Cell 17: 1217–1232 [DOI] [PMC free article] [PubMed] [Google Scholar]
- Datko M, Zivcak M, Brestic M(2008) Proteomic analysis of barley (Hordeum vulgare L.) leaves as affected by high temperature treatment In Allen JF, Gantt E, Golbek JH, and Osmond B, eds, Photosynthesis: Energy from the Sun. Springer, Dordrecht, Germany, pp 1523–1527 [Google Scholar]
- de Witt CT.(1966) Agricultural Research Report: Photosynthesis of Leaf Canopies. Centre for Agricultural Publications and Documentation, Wageningen, The Netherlands [Google Scholar]
- Dose V, Menzel A(2004) Bayesian analysis of climate change impacts in phenology. Glob Change Biol 10: 259–272 [Google Scholar]
- Drake JE, Power SA, Duursma RA, Medlyn BE, Aspinwall MJ, Choat B, Creek D, Eamus D, Maier C, Pfautsch S, et al. (2017) Stomatal and non-stomatal limitations of photosynthesis for four tree species under drought: A comparison of model formulations. Agric For Meteorol 247: 454–466 [Google Scholar]
- Edwards CE, Ewers BE, McClung CR, Lou P, Weinig C(2012) Quantitative variation in water-use efficiency across water regimes and its relationship with circadian, vegetative, reproductive, and leaf gas-exchange traits. Mol Plant 5: 653–668 [DOI] [PubMed] [Google Scholar]
- Edwards CE, Ewers BE, Weinig C(2016) Genotypic variation in biomass allocation in response to field drought has a greater affect on yield than gas exchange or phenology. BMC Plant Biol 16: 185. [DOI] [PMC free article] [PubMed] [Google Scholar]
- Edwards CE, Ewers BE, Williams DG, Xie Q, Lou P, Xu X, McClung CR, Weinig C(2011) The genetic architecture of ecophysiological and circadian traits in Brassica rapa. Genetics 189: 375–390 [DOI] [PMC free article] [PubMed] [Google Scholar]
- Farquhar GD, von Caemmerer S, Berry JA(1980) A biochemical model of photosynthetic CO2 assimilation in leaves of C 3 species. Planta 149: 78–90 [DOI] [PubMed] [Google Scholar]
- Farquhar GD, Wong SC(1984) An empirical model of stomatal conductance. Aust J Plant Physiol 11: 191–210 [Google Scholar]
- Filek M, Łabanowska M, Kościelniak J, Biesaga-Kościelniak J, Kurdziel M, Szarejko I, Hartikainen H(2015) Characterization of barley leaf tolerance to drought stress by chlorophyll fluorescence and electron paramagnetic resonance studies. J Agron Crop Sci 201: 228–240 [Google Scholar]
- Fini A, Guidi L, Ferrini F, Brunetti C, Di Ferdinando M, Biricolti S, Pollastri S, Calamai L, Tattini M(2012) Drought stress has contrasting effects on antioxidant enzymes activity and phenylpropanoid biosynthesis in Fraxinus ornus leaves: An excess light stress affair? J Plant Physiol 169: 929–939 [DOI] [PubMed] [Google Scholar]
- Flexas J, Bota J, Escalona JM, Sampol B, Medrano H(2002) Effects of drought on photosynthesis in grapevines under field conditions: An evaluation of stomatal and mesophyll limitations. Funct Plant Biol 29: 461–471 [DOI] [PubMed] [Google Scholar]
- Flexas J, Carriquí M, Nadal M(2018) Gas exchange and hydraulics during drought in crops: Who drives whom? J Exp Bot 69: 3791–3795 [DOI] [PMC free article] [PubMed] [Google Scholar]
- Flexas J, Medrano H(2002) Drought-inhibition of photosynthesis in C3 plants: Stomatal and non-stomatal limitations revisited. Ann Bot 89: 183–189 [DOI] [PMC free article] [PubMed] [Google Scholar]
- Flood PJ, Kruijer W, Schnabel SK, van der Schoor R, Jalink H, Snel JF, Harbinson J, Aarts MG(2016) Phenomics for photosynthesis, growth and reflectance in Arabidopsis thaliana reveals circadian and long-term fluctuations in heritability. Plant Methods 12: 14. [DOI] [PMC free article] [PubMed] [Google Scholar]
- Franks SJ.(2011) Plasticity and evolution in drought avoidance and escape in the annual plant Brassica rapa. New Phytol 190: 249–257 [DOI] [PubMed] [Google Scholar]
- Geiger DR, Servaites JC(1994) Diurnal regulation of photosynthetic carbon metabolism in C3 plants. Annu Rev Plant Physiol Plant Mol Biol 45: 235–256 [Google Scholar]
- Gelman A.(2006) Prior distributions for variance parameters in hierarchical models (comment on article by Browne and Draper). Bayesian Anal 1: 515–534 [Google Scholar]
- Genty B, Briantais JM, Baker NR(1989) The relationship between the quantum yield of photosynthetic electron transport and quenching of chlorophyll fluorescence. Biochim Biophys Acta 990: 87–92 [Google Scholar]
- Giorio P.(2011) Black leaf-clips increased minimum fluorescence emission in clipped leavesexposed to high solar radiation during dark adaptation. Photosynthetica 49: 371–379 [Google Scholar]
- Gómez R, Carrillo N, Morelli MP, Tula S, Shahinnia F, Hajirezaei MR, Lodeyro AF(2018) Faster photosynthetic induction in tobacco by expressing cyanobacterial flavodiiron proteins in chloroplasts. Photosynth Res 136: 129–138 [DOI] [PubMed] [Google Scholar]
- Govindjee(2002) A role for a light-harvesting antenna complex of photosystem II in photoprotection. Plant Cell 14: 1663–1668 [DOI] [PMC free article] [PubMed] [Google Scholar]
- Grassi G, Magnani F(2005) Stomatal, mesophyll conductance and biochemical limitations to photosynthesis as affected by drought and leaf ontogeny in ash and oak trees. Plant Cell Environ 28: 834–849 [Google Scholar]
- Greenham K, Guadagno CR, Gehan MA, Mockler TC, Weinig C, Ewers BE, McClung CR(2017) Temporal network analysis identifies early physiological and transcriptomic indicators of mild drought in Brassica rapa. eLife 6: e29655. [DOI] [PMC free article] [PubMed] [Google Scholar]
- Gu L, Pallardy SG, Tu K, Law BE, Wullschleger SD(2010) Reliable estimation of biochemical parameters from C3 leaf photosynthesis-intercellular carbon dioxide response curves. Plant Cell Environ 33: 1852–1874 [DOI] [PubMed] [Google Scholar]
- Gu L, Sun Y(2014) Artefactual responses of mesophyll conductance to CO2 and irradiance estimated with the variable J and online isotope discrimination methods. Plant Cell Environ 37: 1231–1249 [DOI] [PubMed] [Google Scholar]
- Guadagno CR, Ewers BE, Speckman HN, Aston TL, Huhn BJ, DeVore SB, Ladwig JT, Strawn RN, Weinig C(2017) Dead or alive? Using membrane failure and chlorophyll a fluorescence to predict plant mortality from drought. Plant Physiol 175: 223–234 [DOI] [PMC free article] [PubMed] [Google Scholar]
- Gullì M, Salvatori E, Fusaro L, Pellacani C, Manes F, Marmiroli N(2015) Comparison of drought stress response and gene expression between a GM maize variety and a near-isogenic non-GM variety. PLoS ONE 10: e0117073. [DOI] [PMC free article] [PubMed] [Google Scholar]
- Hammer G, Cooper M, Tardieu F, Welch S, Walsh B, van Eeuwijk F, Chapman S, Podlich D(2006) Models for navigating biological complexity in breeding improved crop plants. Trends Plant Sci 11: 587–593 [DOI] [PubMed] [Google Scholar]
- Harley PC, Loreto F, Di Marco G, Sharkey TD(1992) Theoretical considerations when estimating the mesophyll conductance to CO2 flux by analysis of the response of photosynthesis to CO2. Plant Physiol 98: 1429–1436 [DOI] [PMC free article] [PubMed] [Google Scholar]
- Hill R, Bendall F(1960) Function of the two cytochrome components in chloroplasts: A working hypothesis. Nature 186: 136–137 [Google Scholar]
- Holland JB.(2007) Genetic architecture of complex traits in plants. Curr Opin Plant Biol 10: 156–161 [DOI] [PubMed] [Google Scholar]
- Horton P, Ruban AV, Walters RG(1994) Regulation of light harvesting in green plants (indication by nonphotochemical quenching of chlorophyll fluorescence). Plant Physiol 106: 415–420 [DOI] [PMC free article] [PubMed] [Google Scholar]
- Iniguez-Luy FL, Lukens L, Farnham MW, Amasino RM, Osborn TC(2009) Development of public immortal mapping populations, molecular markers and linkage maps for rapid cycling Brassica rapa and B. oleracea. Theor Appl Genet 120: 31–43 [DOI] [PubMed] [Google Scholar]
- Jin Z, Ainsworth EA, Leakey ADB, Lobell DB(2018) Increasing drought and diminishing benefits of elevated carbon dioxide for soybean yields across the US Midwest. Glob Change Biol 24: e522–e533 [DOI] [PubMed] [Google Scholar]
- Kasahara M, Kagawa T, Oikawa K, Suetsugu N, Miyao M, Wada M(2002) Chloroplast avoidance movement reduces photodamage in plants. Nature 420: 829–832 [DOI] [PubMed] [Google Scholar]
- Kato MC, Hikosaka K, Hirotsu N, Makino A, Hirose T(2003) The excess light energy that is neither utilized in photosynthesis nor dissipated by photoprotective mechanisms determines the rate of photoinactivation in photosystem II. Plant Cell Physiol 44: 318–325 [DOI] [PubMed] [Google Scholar]
- Klughammer C, Schreiber U(1994) An improved method, using saturating light pulses, for the determination of photosystem I quantum yield via P700+-absorbance changes at 830 nm. Planta 192: 261–268 [Google Scholar]
- Kramer DM, Avenson TJ, Edwards GE(2004a) Dynamic flexibility in the light reactions of photosynthesis governed by both electron and proton transfer reactions. Trends Plant Sci 9: 349–357 [DOI] [PubMed] [Google Scholar]
- Kramer DM, Johnson G, Kiirats O, Edwards GE(2004b) New fluorescence parameters for the determination of QA redox state and excitation energy fluxes. Photosynth Res 79: 209. [DOI] [PubMed] [Google Scholar]
- Krieger-Liszkay A, Fufezan C, Trebst A(2008) Singlet oxygen production in photosystem II and related protection mechanism. Photosynth Res 98: 551–564 [DOI] [PubMed] [Google Scholar]
- Kruschke JK.(2014) Doing Bayesian Data Analysis: A Tutorial with R, JAGS, and Stan. Academic Press, Burlington, MA [Google Scholar]
- Kruschke JK.(2018) Rejecting or accepting parameter values in Bayesian estimation, advances in methods and practices. Psychol Sci 1: 270–280 [Google Scholar]
- Kruschke JK, Liddell TM(2018) The Bayesian New Statistics: Hypothesis testing, estimation, meta-analysis, and power analysis from a Bayesian perspective. Psychon Bull Rev 25: 178–206 [DOI] [PubMed] [Google Scholar]
- Kuhlgert S, Austic G, Zegarac R, Osei-Bonsu I, Hoh D, Chilvers MI, Roth MG, Bi K, TerAvest D, Weebadde P, et al. (2016) MultispeQ Beta: A tool for large-scale plant phenotyping connected to the open PhotosynQ network. R Soc Open Sci 3: 160592. [DOI] [PMC free article] [PubMed] [Google Scholar]
- Laisk A, Loreto F(1996) Determining photosynthetic parameters from leaf CO2 exchange and chlorophyll fluorescence (ribulose-1,5-bisphosphate carboxylase/oxygenase specificity factor, dark respiration in the light, excitation distribution between photosystems, alternative electron transport rate, and mesophyll diffusion resistance). Plant Physiol 110: 903–912 [DOI] [PMC free article] [PubMed] [Google Scholar]
- Laisk A, Oja V, Rasulov B, Rämma H, Eichelmann H, Kasparova I, Pettai H, Padu E, Vapaavuori E(2002) A computer-operated routine of gas exchange and optical measurements to diagnose photosynthetic apparatus in leaves. Plant Cell Environ 25: 923–943 [Google Scholar]
- Lambrev PH, Miloslavina Y, Jahns P, Holzwarth AR(2012) On the relationship between non-photochemical quenching and photoprotection of photosystem II. Biochim Biophys Acta 1817: 760–769 [DOI] [PubMed] [Google Scholar]
- Lazár D.(2015) Parameters of photosynthetic energy partitioning. J Plant Physiol 175: 131–147 [DOI] [PubMed] [Google Scholar]
- Li QM, Liu BB, Wu Y, Zou ZR(2008) Interactive effects of drought stresses and elevated CO2 concentration on photochemistry efficiency of cucumber seedlings. J Integr Plant Biol 50: 1307–1317 [DOI] [PubMed] [Google Scholar]
- Livingston AK, Cruz JA, Kohzuma K, Dhingra A, Kramer DM(2010) An Arabidopsis mutant with high cyclic electron flow around photosystem I (hcef) involving the NADPH dehydrogenase complex. Plant Cell 22: 221–233 [DOI] [PMC free article] [PubMed] [Google Scholar]
- Long SP, Bernacchi CJ(2003) Gas exchange measurements, what can they tell us about the underlying limitations to photosynthesis? Procedures and sources of error. J Exp Bot 54: 2393–2401 [DOI] [PubMed] [Google Scholar]
- Malnoë A.(2018) Photoinhibition or photoprotection of photosynthesis? Update on the (newly termed) sustained quenching component qH. Environ Exp Bot 154: 123–133 [Google Scholar]
- Martre P, Quilot-Turion B, Luquet D, Memmah MMOS, Chenu K, Debaeke P(2015) Model-assisted phenotyping and ideotype design In Sadras VO, and Calderini DF, eds, Crop Physiology, 2nd ed. Academic Press, London, pp 349–373 [Google Scholar]
- Maxwell K, Johnson GN(2000) Chlorophyll fluorescence: A practical guide. J Exp Bot 51: 659–668 [DOI] [PubMed] [Google Scholar]
- McClain AM, Sharkey TD(2019) Triose phosphate utilization and beyond: From photosynthesis to end product synthesis. J Exp Bot 70: 1755–1766 [DOI] [PMC free article] [PubMed] [Google Scholar]
- McElreath R.(2016) Statistical Rethinking: A Bayesian Course with Examples in R and Stan CRC Press, Boca Raton, FL [Google Scholar]
- Meacham K, Sirault X, Quick WP, von Caemmerer S, Furbank R(2017) Diurnal solar energy conversion and photoprotection in rice canopies. Plant Physiol 173: 495–508 [DOI] [PMC free article] [PubMed] [Google Scholar]
- Medrano H, Escalona JM, Bota J, Gulías J, Flexas J(2002) Regulation of photosynthesis of C3 plants in response to progressive drought: Stomatal conductance as a reference parameter. Ann Bot 89: 895–905 [DOI] [PMC free article] [PubMed] [Google Scholar]
- Miller G, Suzuki N, Ciftci-Yilmaz S, Mittler R(2010) Reactive oxygen species homeostasis and signalling during drought and salinity stresses. Plant Cell Environ 33: 453–467 [DOI] [PubMed] [Google Scholar]
- Moualeu-Ngangue DP, Chen TW, Stützel H(2017) A new method to estimate photosynthetic parameters through net assimilation rate-intercellular space CO2 concentration (A-Ci) curve and chlorophyll fluorescence measurements. New Phytol 213: 1543–1554 [DOI] [PubMed] [Google Scholar]
- Müller P, Li XP, Niyogi KK(2001) Non-photochemical quenching: A response to excess light energy. Plant Physiol 125: 1558–1566 [DOI] [PMC free article] [PubMed] [Google Scholar]
- Murata N, Takahashi S, Nishiyama Y, Allakhverdiev SI(2007) Photoinhibition of photosystem II under environmental stress. Biochim Biophys Acta 1767: 414–421 [DOI] [PubMed] [Google Scholar]
- Niinemets U, Díaz-Espejo A, Flexas J, Galmés J, Warren CR(2009) Role of mesophyll diffusion conductance in constraining potential photosynthetic productivity in the field. J Exp Bot 60: 2249–2270 [DOI] [PubMed] [Google Scholar]
- Nishiyama Y, Allakhverdiev SI, Murata N(2006) A new paradigm for the action of reactive oxygen species in the photoinhibition of photosystem II. Biochim Biophys Acta 1757: 742–749 [DOI] [PubMed] [Google Scholar]
- Noctor G, Veljovic-Jovanovic S, Driscoll S, Novitskaya L, Foyer CH(2002) Drought and oxidative load in the leaves of C3 plants: A predominant role for photorespiration? Ann Bot 89: 841–850 [DOI] [PMC free article] [PubMed] [Google Scholar]
- Nogués S, Baker NR(2000) Effects of drought on photosynthesis in Mediterranean plants grown under enhanced UV-B radiation. J Exp Bot 51: 1309–1317 [DOI] [PubMed] [Google Scholar]
- Oberhuber W, Edwards GE(1993) Temperature dependence of the linkage of quantum yield of photosystem II to CO2 fixation in C4 and C3 plants. Plant Physiol 101: 507–512 [DOI] [PMC free article] [PubMed] [Google Scholar]
- Ort DR, Baker NR(2002) A photoprotective role for O2 as an alternative electron sink in photosynthesis? Curr Opin Plant Biol 5: 193–198 [DOI] [PubMed] [Google Scholar]
- Ort DR, Melis A(2011) Optimizing antenna size to maximize photosynthetic efficiency. Plant Physiol 155: 79–85 [DOI] [PMC free article] [PubMed] [Google Scholar]
- Parry MAJ, Keys AJ, Madgwick PJ, Carmo-Silva AE, Andralojc PJ(2008) Rubisco regulation: A role for inhibitors. J Exp Bot 59: 1569–1580 [DOI] [PubMed] [Google Scholar]
- Patrick LD, Ogle K, Tissue DT(2009) A hierarchical Bayesian approach for estimation of photosynthetic parameters of C3 plants. Plant Cell Environ 32: 1695–1709 [DOI] [PubMed] [Google Scholar]
- Pearcy RW.(1990) Sunflecks and photosynthesis in plant canopies. Annu Rev Plant Physiol Plant Mol Biol 41: 421–453 [Google Scholar]
- Pietrini F, Massacci A(1998) Leaf anthocyanin content changes in Zea mays L. grown at low temperature: Significance for the relationship between the quantum yield of PS II and the apparent quantum yield of CO2 assimilation. Photosynth Res 58: 213–219 [Google Scholar]
- Pleban JR, Mackay DS, Aston TL, Ewers BE, Weinig C(2018) Phenotypic trait identification using a multimodel Bayesian method: A case study using photosynthesis in Brassica rapa genotypes. Front Plant Sci 9: 448–468 [DOI] [PMC free article] [PubMed] [Google Scholar]
- Plummer M. (2003) JAGS: A program for analysis of Bayesian graphical models using Gibbs sampling. https://www.r-project.org/conferences/DSC-2003/Proceedings/Plummer.pdf
- Plummer M. (2014) rjags: Bayesian graphical models using MCMC. http://mcmc-jags.sourceforge.net/
- Pons TL, Flexas J, von Caemmerer S, Evans JR, Genty B, Ribas-Carbo M, Brugnoli E(2009) Estimating mesophyll conductance to CO2: Methodology, potential errors, and recommendations. J Exp Bot 60: 2217–2234 [DOI] [PubMed] [Google Scholar]
- Porcar-Castell A, Garcia-Plazaola JI, Nichol CJ, Kolari P, Olascoaga B, Kuusinen N, Fernández-Marín B, Pulkkinen M, Juurola E, Nikinmaa E(2012) Physiology of the seasonal relationship between the photochemical reflectance index and photosynthetic light use efficiency. Oecologia 170: 313–323 [DOI] [PubMed] [Google Scholar]
- Powles SB.(1984) Photoinhibition of photosynthesis induced by visible light. Ann Rev Plant Physiol 35: 15–44 [Google Scholar]
- Prakash S, Hinata K(1980) Taxonomy, cytogenetics and origin of crop Brassicas, a review. Opera Bot 55: 1–57 [Google Scholar]
- Rascher U, Bobich E, Lin G, Walter A, Morris T, Naumann M, Nichol C, Pierce D, Bil K, Kudeyarov V(2004) Functional diversity of photosynthesis during drought in a model tropical rainforest: the contributions of leaf area, photosynthetic electron transport and stomatal conductance to reduction in net ecosystem carbon exchange. Plant Cell Environ 27: 1239–1256 [Google Scholar]
- Rascher U, Liebig M, Lüttge U(2000) Evaluation of instant light-response curves of chlorophyll fluorescence parameters obtained with a portable chlorophyll fluorometer on site in the field. Plant Cell Environ 23: 1397–1405 [Google Scholar]
- Reddy AR, Chaitanya KV, Vivekanandan M(2004) Drought-induced responses of photosynthesis and antioxidant metabolism in higher plants. J Plant Physiol 161: 1189–1202 [DOI] [PubMed] [Google Scholar]
- Reymond M, Muller B, Leonardi A, Charcosset A, Tardieu F(2003) Combining quantitative trait loci analysis and an ecophysiological model to analyze the genetic variability of the responses of maize leaf growth to temperature and water deficit. Plant Physiol 131: 664–675 [DOI] [PMC free article] [PubMed] [Google Scholar]
- Ruban AV.(2016) Nonphotochemical chlorophyll fluorescence quenching: Mechanism and effectiveness in protecting plants from photodamage. Plant Physiol 170: 1903–1916 [DOI] [PMC free article] [PubMed] [Google Scholar]
- Sacksteder CA, Kanazawa A, Jacoby ME, Kramer DM(2000) The proton to electron stoichiometry of steady-state photosynthesis in living plants: A proton-pumping Q cycle is continuously engaged. Proc Natl Acad Sci USA 97: 14283–14288 [DOI] [PMC free article] [PubMed] [Google Scholar]
- Sharkey TD, Bernacchi CJ, Farquhar GD, Singsaas EL(2007) Fitting photosynthetic carbon dioxide response curves for C3 leaves. Plant Cell Environ 30: 1035–1040 [DOI] [PubMed] [Google Scholar]
- Sharma P, Jha AB, Dubey RS, Pessarakli M(2012) Reactive oxygen species, oxidative damage, and antioxidative defense mechanism in plants under stressful conditions. J Bot 2012: 217037 [Google Scholar]
- Sheffield J, Wood EF(2008) Projected changes in drought occurrence under future global warming from multi-model, multi-scenario, IPCC AR4 simulations. Clim Dyn 31: 79–105 [Google Scholar]
- Shi J, Li R, Qiu D, Jiang C, Long Y, Morgan C, Bancroft I, Zhao J, Meng J(2009) Unraveling the complex trait of crop yield with quantitative trait loci mapping in Brassica napus. Genetics 182: 851–861 [DOI] [PMC free article] [PubMed] [Google Scholar]
- Silva-Perez V, Molero G, Serbin SP, Condon AG, Reynolds MP, Furbank RT, Evans JR(2018) Hyperspectral reflectance as a tool to measure biochemical and physiological traits in wheat. J Exp Bot 69: 483–496 [DOI] [PMC free article] [PubMed] [Google Scholar]
- Singsaas EL, Ort DR, DeLucia EH(2001) Variation in measured values of photosynthetic quantum yield in ecophysiological studies. Oecologia 128: 15–23 [DOI] [PubMed] [Google Scholar]
- Souza RP, Machado EC, Silva JAB, Lagôa AMMA, Silveira JAG(2004) Photosynthetic gas exchange, chlorophyll fluorescence and some associated metabolic changes in cowpea (Vigna unguiculata) during water stress and recovery. Environ Exp Bot 51: 45–56 [Google Scholar]
- Strand DD, Livingston AK, Satoh-Cruz M, Froehlich JE, Maurino VG, Kramer DM(2015) Activation of cyclic electron flow by hydrogen peroxide in vivo. Proc Natl Acad Sci USA 112: 5539–5544 [DOI] [PMC free article] [PubMed] [Google Scholar]
- Takahashi S, Badger MR(2011) Photoprotection in plants: A new light on photosystem II damage. Trends Plant Sci 16: 53–60 [DOI] [PubMed] [Google Scholar]
- Tardieu F.(2003) Virtual plants: Modelling as a tool for the genomics of tolerance to water deficit. Trends Plant Sci 8: 9–14 [DOI] [PubMed] [Google Scholar]
- Tazoe Y, von Caemmerer S, Badger MR, Evans JR(2009) Light and CO2 do not affect the mesophyll conductance to CO2 diffusion in wheat leaves. J Exp Bot 60: 2291–2301 [DOI] [PubMed] [Google Scholar]
- Tietz S, Hall CC, Cruz JA, Kramer DM(2017) NPQT: A chlorophyll fluorescence parameter for rapid estimation and imaging of non-photochemical quenching of excitons in photosystem-II-associated antenna complexes. Plant Cell Environ 40: 1243–1255 [DOI] [PubMed] [Google Scholar]
- Urban L, Aarrouf J, Bidel LPR(2017) Assessing the effects of water deficit on photosynthesis using parameters derived from measurements of leaf gas exchange and of chlorophyll a fluorescence. Front Plant Sci 8: 2068. [DOI] [PMC free article] [PubMed] [Google Scholar]
- Vialet-Chabrand S, Matthews JSA, Brendel O, Blatt M, Wang Y, Hills A, Griffiths H, Rogers S, Lawson T(2016) Modelling water use efficiency in a dynamic environment: An example using Arabidopsis thaliana. Plant Sci 251: 65–74 [DOI] [PMC free article] [PubMed] [Google Scholar]
- Vialet-Chabrand S, Matthews JSA, Simkin AJ, Raines CA, Lawson T(2017) Importance of fluctuations in light on plant photosynthetic acclimation. Plant Physiol 173: 2163–2179 [DOI] [PMC free article] [PubMed] [Google Scholar]
- Von Caemmerer S.(2000) Biochemical Models of Leaf Photosynthesis. CSIRO Publishing, Collingwood, Victoria, Australia [Google Scholar]
- Wang DR, Guadagno CR, Mao X, Mackay DS, Pleban JR, Baker RL, Weinig C, Jannink JL, Ewers BE(2019) A framework for genomics-informed ecophysiological modeling in plants. J Exp Bot 70: 2561–2574 [DOI] [PMC free article] [PubMed] [Google Scholar]
- Way DA, Pearcy RW(2012) Sunflecks in trees and forests: From photosynthetic physiology to global change biology. Tree Physiol 32: 1066–1081 [DOI] [PubMed] [Google Scholar]
- Williams PH, Hill CB(1986) Rapid-cycling populations of Brassica. Science 232: 1385–1389 [DOI] [PubMed] [Google Scholar]
- Yarkhunova Y, Edwards CE, Ewers BE, Baker RL, Aston TL, McClung CR, Lou P, Weinig C(2016) Selection during crop diversification involves correlated evolution of the circadian clock and ecophysiological traits in Brassica rapa. New Phytol 210: 133–144 [DOI] [PubMed] [Google Scholar]
- Yin X, Harbinson J, Struik PC(2006) Mathematical review of literature to assess alternative electron transports and interphotosystem excitation partitioning of steady-state C3 photosynthesis under limiting light. Plant Cell Environ 29: 1771–1782 [DOI] [PubMed] [Google Scholar]
- Yin X, Struik PC, Romero P, Harbinson J, Evers JB, van der Putten PE, Vos J(2009) Using combined measurements of gas exchange and chlorophyll fluorescence to estimate parameters of a biochemical C photosynthesis model: A critical appraisal and a new integrated approach applied to leaves in a wheat (Triticum aestivum) canopy. Plant Cell Environ 32: 448–464 [DOI] [PubMed] [Google Scholar]
- Yin X, Van Oijen M, Schapendonk A(2004) Extension of a biochemical model for the generalized stoichiometry of electron transport limited C3 photosynthesis. Plant Cell Environ 27: 1211–1222 [Google Scholar]
- Zavafer A, Cheah MH, Hillier W, Chow WS, Takahashi S(2015) Photodamage to the oxygen evolving complex of photosystem II by visible light. Sci Rep 5: 16363. [DOI] [PMC free article] [PubMed] [Google Scholar]