

Abstract
The burden of enteric pathogens in poultry is growing after the ban of antibiotic use in animal production. Organic acids gained attention as a possible alternative to antibiotics due to their antimicrobial activities, improved nutrient metabolism and performance. The current study was conducted to evaluate the effectiveness of organic acid blend on broilers cecal microbiota, histomorphometric measurements, and short-chain fatty acid production in Salmonella enterica serovar Typhimurium challenge model. Birds were divided into four treatments, including a negative control, positive control challenged with S. Typhimurium, group supplemented with an organic acid blend, and birds supplemented with organic acid blend and Salmonella challenged. Results illustrate significant differences in feed conversion ratios and production efficiency factor between treatment groups, however, the influence of organic acid supplement was marginal. Organic acid blend significantly increased cecal acetic and butyric acids concentrations when compared to unsupplemented groups and resulted in minor alterations of intestinal bacterial communities.
Introduction
Antibiotic growth promoters (AGPs) have been used in the animal industry for several decades in various countries, to improve the production rate and reduce mortality [1]. However, European Union countries banned the use of AGPs in food animal production in 1995, due to the increasing concerns of high spread of antimicrobial resistance genes [2]. This action was followed by several other countries and created an urgent need for alternative solutions.
In recent years, organic acids gained attention as a possible alternative for AGPs, especially in the poultry industry. Organic acids demonstrated great potential as antimicrobial agents against a wide range of intestinal pathogens [3], especially after European Union approved the use of organic acids and their salts in poultry production as safe AGP alternatives [4]. Organic acids used in poultry were reported to exhibit antimicrobial actions against a wide range of intestinal pathogens, enhance nutrient metabolism, and improve performance [3,5]. The efficacy of an organic acid is influenced by several factors such as the chemical composition and form, pKa-value, with higher pKa values associated with better antibacterial activity, molecular weight and targeted microorganism control [6,7].
Adil et al. [4] tested the effect of multiple organic acids (butyric, fumaric and lactic acid) on poultry at varying concentrations, demonstrating beneficial influence on bird’s body weight gain, feed conversion ratio and increased villus height in the small intestine irrespective of type and concentration of acid used. Abudabos et al. [8] reported that the effect of organic acid blend in S. Typhimurium challenged broilers was similar to the effect of antibiotic avilamycin. Van Immerseel et al. [9] and Fernandez-Rubio et al. [10] showed that the supplementation with butyric acid-based feed additives reduced poultry susceptibility and shedding of Salmonella infection, thereby indirectly reducing the contamination of litter with pathogens.
Normal gut microbiota harbours millions of genes that support vital functions, including the functions the host is incapable of performing. As a consequence, the microbiota has a large influence on many important aspects of the development of the host [11]. Therefore, the extensive study of the chicken gut microbiota may give answers to a better understanding of how diet supplementations and environmental factors can be used to benefit the host [12,13].
Our present study was conducted to evaluate the effectiveness of organic acid blend using next-generation sequencing-based microbiota analysis, in combination with histomorphometric measurements and SCFA production profile in broiler chickens under S. Typhimurium challenge.
Materials and methods
Birds management and dietary treatments
The study was conducted on 100 one-day-old broiler chicks (Ross 308). Broilers chicks were randomly allocated into four dietary treatment groups; each treatment was further separated into five replicates with five birds per replica. The growth experiment was conducted for five weeks, with a standard starter period (1-21d) and finisher period diets (21-35d). Birds were raised under the strict biosecurity and hygienic settings in controlled light and temperature, ad libitum access to feed and water, and were kept on a 24 h light schedule.
A standard diet with isocaloric and isonitrogenous contents was offered in the mashed formula in both starter and finisher periods. Corn and soybean meal (corn-SBM) diet was formulated as per Ross 308 suggested recommendation, to meet or exceed recommendations in commercial settings in Saudi Arabia (Table 1). Organic acid (OA) blend was added into two groups over the top. Upon arrival, chicks were randomly distributed to one of the four treatment groups as follows: Treatment 1: negative control (no challenge, no OA); Treatment 2: positive control (S. Typhimurium challenge); Treatment 3: organic acid blend (OA -3.0 g/kg); Treatment 4: both OA (3.0 g/kg) and S. Typhimurium challenge. The commercial OA we used was Fysal® Fit 4 (Trouw Nutrition, Ireland). Fysal® Fit 4 is a blend of short and medium-chain fatty acids and a low dose of ß1-4 mannobiose. The manufacturer does not provide detailed blend information, however, the product is widely used in poultry.
Table 1. Ingredients and calculated nutrient analysis of broilers starter and finisher diets.
| Ingredients | ||
|---|---|---|
| Starter | Finisher | |
| Yellow corn | 50.635 | 65.39 |
| Soybean meal | 42.40 | 20.70 |
| Wheat bran | 0.00 | 0.60 |
| Corn Gluten meal | 0.00 | 0.70 |
| Choline chloride CL 60 | 0.05 | 0.05 |
| Corn oil | 3.60 | 3.00 |
| Dicalcuim Phosphate DCP | 1.270 | 1.027 |
| Ground Limestone | 1.080 | 1.04 |
| Salt | 0.300 | 0.30 |
| Phytase xp 10000 TPT | 0.005 | 0.005 |
| DL-methionine | 0.295 | 0.22 |
| Lysine-HCL | 0.080 | 0.36 |
| Threonine | 0.085 | 0.11 |
| Vitamin- Mineral premix1 | 0.200 | 0.200 |
| Total | 100 | 100 |
| Analysis | ||
| ME, kcal/kg | 3000 | 3200 |
| Crude protein, % | 23.0 | 19.5 |
| Non phytate P, % | 0.48 | 0.359 |
| Calcium, % | 0.96 | 0.81 |
| D. Lysine, % | 1.28 | 1.03 |
| Sulfur amino acids, % | 0.85 | 0.8 |
| Threonine, % | 0.86 | 0.69 |
1Vitamin-mineral premix contains in the following per kg: vitamin A, 12000000 IU; vitamin D3, 5000000 IU; vitamin E, 80000 IU; vitamin K3, 3200 mg; vitamin B1, 3200 mg; vitamin B2, 8600 mg; vitamin B3, 65000 mg; pantothenic acid, 20000 mg; vitamin B6, 4300 mg; biotin 220 mg; antioxidant(BHA+BHT), 50000 mg; B9, 2200 mg; B12, 17 mg; copper, 16000 mg; iodine, 1250 mg; iron, 20000 mg; manganese, 120000 mg; selenium, 300 mg, and zinc, 110000 mg.
At the end of the first week (7d), birds from T2 and T4 were orally challenged with 1 ml 3 x10⁹ CFU Salmonella enterica subsp. enterica, serovar Typhimurium (S. Typhimurium) (ATCC# 14028). The challenge inoculum was prepared as described previously [14].
Performance measurements
Overall performance was measured on a weekly basis, from week 1 to week 5 (35 days), feed intake (FI) was determined by subtracting the entire rejected feed from the total feed. Average body weight gain (BWG) and adjusted feed conversion ratios (FCR) were corrected for the bird’s mortality and computed for each group. Production efficiency factor (PEF) was calculated using the following formula:
Analysis of broilers cecal microbiota composition
On day 40, cecum contents were collected randomly from 14 birds from each of the treatment groups. Samples were directly transported to the lab in sterile containers under ice and stored at -80°C. Total DNA was extracted using a protocol designed and described previously by Stanley et al. [15] with minor modifications. The quality and quantity of DNA were confirmed using a Nanodrop spectrophotometer. Hypervariable regions V3–V4 of the 16S rRNA gene were amplified and sequenced to determine the cecal microbiota using primers; forward ACTCCTACGGGAGGCAGCAG, reverse GGACTACHVGGGTWTCTAAT. Primers used were uniquely barcoded and contained Illumina spacers and sequencing linkers, using an approach that has been proposed by Fadrosh et al. [16]. The sequencing library was prepared by following the manufacturer's protocol (Illumina Inc., San Diego, CA, USA). Sequencing was performed using the Illumina MiSeq 2x300 bp paired-end sequencing.
Bioinformatics analysis
Illumina MiSeq sequencing generated reads were primarily investigated using Quantitative Insights Into Microbial Ecology (QIIME v.1.9.1) [17]. Fastq-Join algorithm was used to join pair-end sequences allowing no mismatches within the overlap region. Only sequences with greater than 20 Phred quality threshold were taken in further analysis. Using UCLUST algorithm, sequences were clustered and grouped into operational taxonomic units OTUs at 97% match [18], and inspected for chimeric sequences using Pintail [19]. All taxonomic assignments were performed in QIIME against the GreenGenes database using QIIME default arguments [20]. Calculation of Weighted and Unweighted Unifrac distance matrixes was done using QIIME, with 99,999. OTUs with a relative abundance of less than 0.01% were removed. After quality filtering, there were 50 cecum samples that were sequenced to sufficient depth and sequence quality. Data analysis was completed using Hellinger transformed rarefied data [21]. Data visualization were done via Calypso (http://cgenome.net/calypso/) [22]. Chao1, Shannon, Richness, Evenness and Simpson indexes were used to measure Alpha diversity. Figure comparing relative abundance shows the untransformed version of the data. ANOVA was used to detect the significance of univariates. Multivariate data visualisation and multivariate statistical testing were inspected by applying the supervised multivariate redundancy analysis (RDA) using 999 permutations. Complete sequencing dataset is accessible on the MG-RAST public server (http://metagenomics.anl.gov/) with library ID mgl758080.
Extraction and analysis of short-chain fatty acids
On day 40, cecal contents were collected from 56 birds (14 birds per treatment) for SCFAs analysis. An acidified water-extraction protocol described by Zhao et al. [23] was used for SCFAs extraction with minor alterations. Acetic acid (99.9%), propionic acid (99.9%), butyric acid (99.5%), i-butyric acid (99.0%), n-valeric acid (99.3%) and i-valeric acid (99.0%) were obtained from Dr Ehrenstorfer (Augsburg, Germany), and adjusted to 1000 ug/ml (ppm) in methanol. Gas chromatograph/Mass spectrometer (GC/MS) on an Agilent (Palo Alto, CA) 7890A with an Agilent 350°C separation column (30 m x 250 μm x 0.25 μm) was used. The retention time of each SCFA was defined using total ion chromatogram (TIC) scan mode. SCFAs separation was done following methods described previously [24–27]. A single ion monitoring (SIM) mode was used to operate the GC/MS following instrumental parameters. Oven programme was 18.133 min starting on 50°C for 1 min, then 6°C per min to 100°C for 1 min, next 25°C per min to 270°C for 1 min, and 2 min post run 300°C. Sample of 2 μL was injected at 250°C using split-less mode and helium carrier gas. The pressure was fixed on 11.747 psi at 24.4 mL/min total flow. Calibration curves were constructed from a standard stock concentration of 1000 ppm of all six tested acids.
Histological analysis
Ileum tissue was collected aseptically at day 40, from six birds per treatment (two centimetres from the mid-section) and fixed immediately in 10% buffered formaldehyde, followed by dehydration and paraffin embedding. Sections were cut in 5 μm and were stained by haematoxylin and eosin (H&E) stain. Images were scanned with a Nikon Eclipse Ni-U microscope with the camera (Nikon, Tokyo, Japan) at magnifications power of (4x, 10x, 40x). Histomorphometric measurements, villi height, width, and total surface area were assessed based on a minimum of 10 well-oriented villi/section using an IX71 Inverted Olympus Microscope with a PC-based image analysis system (Olympus DP72 microscope digital camera; Olympus NV, Aartselaar, Belgium), and analysis was done using CellSens digital imaging software. Villus surface area was calculated using the formula:
Statistical analysis
Performance and sampling data were analysed using ANOVA for a complete randomized block design, using SAS software (SAS, 2009) general linear models (GLM) procedure. Least significant difference (LSD) test was used to compare the group means when the treatment impact was significant at P-value <0.05.
Ethical statement
This trial was performed under project number (KSU-SE-18-38) with the approval of the Research Ethics Committee, Deanship of Scientific Research, Vice-Rectorate for Graduate Studies & Scientific Research at King Saud University. All methods were performed in accordance with the Gloucestershire County Council’s (GCC) Animal Welfare Act endorsed by Saudi Arabia and approved in Royal Decree No. (M / 44).
Results
Organic acid supplementation effect on growth performance
Cumulative performance measurements were calculated at the end of the finisher period (21-35d) including average feed intake (FI), body weight gain (BWG), feed conversion ratio (FCR), and production efficiency factor (PEF) (Table 2). A significant impact was observed on average FCR and PEF (P = 0.012, P = 0.047 respectively), were birds under S. Typhimurium challenge were characterised with the highest FCR (1.646). Broilers that were under S. Typhimurium challenge and had their diet supplemented with OA showed marginally lower FCR compared to the unsupplemented S. Typhimurium challenged group. The highest PEF values were detected in T1 followed by T4 and T3, while the lowest value was recorded in T2 (S. Typhimurium). There were no mortalities in T1, 10.4% in T2, 0.4% in T3 and 6% in T4. The mortality has taken into account how long the bird lived (the age at the time of death).
Table 2. Cumulative Feed Intake (FI), body weight gain (BWG), feed conversion ratio (FCR), and production efficiency factor (PEF) of broilers given different diet supplementation during the finisher period (21-35d).
| Treatment group | Performance | |||
|---|---|---|---|---|
| FI, g | BWG, g | FCR, g:g | PEF | |
| T1 | 1597.4 | 1128.6a | 1.413c | 390.4a |
| T2 | 1661.5 | 1014.3b | 1.646a | 318.4b |
| T3 | 1589.9 | 1073.1ab | 1.484bc | 356.6ab |
| T4 | 1669.9 | 1075.5ab | 1.554ab | 348.9ab |
| SEM± | ±39.77 | ±31.73 | ±0.038 | ±14.07 |
| p-value | 0.41NS | 0.0211* | 0.012** | 0.047* |
T1: Negative Control, basal diet, unchallenged; T2: Positive Control, S. Typhimurium Challenge; T3: OA, unchallenged and T4: OA, S. Typhimurium Challenge.
BWG, body weight gain; FI, feed intake; FCR, feed conversion ratio; PEF, production efficiency factor.
abcdMeans in the column with different superscripts differ significantly.
NS, not significant.
Organic acid effect on ileum histomorphological measurements
The impact of organic acid supplementation on ileum histomorphometric measurements including villus length (L), width (W), and surface area (SA) in broilers at (40 d) are presented in Table 3. S. Typhimurium challenge was associated with a significant decrease in villus length and intestinal surface area. Birds from T4 (challenged and supplemented) had significantly higher villus length than challenged group T2, while there were no differences in width and surface area.
Table 3. Effect of different dietary supplementation and bacterial challenges on ileum histomorphometric measurements of broilers at (40 d).
| Treatment group | Histomorphometric Measurements | ||
|---|---|---|---|
| L (μm) | W (μm) | SA (μm) | |
| T1 | 624.8a | 75.9 | 0.147a |
| T2 | 535.2b | 63.3 | 0.109b |
| T3 | 603.9ab | 75.7 | 0.152a |
| T4 | 622.7a | 70.3 | 0.139ab |
| SEM1 | ±18.83 | ±4.08 | ±0.0100 |
| p-Value | 0.0024*** | 0.1002 | 0.012** |
T1: Negative Control, basal diet, unchallenged; T2: Positive Control, S. Typhimurium Challenge; T3: OA, unchallenged and T4: OA, S. Typhimurium Challenge.
L: villus length; W: villi width; SA: surface area
1 SEM: standard error of the mean
abc Means values within a column with different superscripts are significantly different
*, P <0.05
**, P <0.01
***, P <0.001, NS, not significant.
Microbiota structure overview
The sequencing of 16S rRNA gene revealed the dominance of five main phyla, where Firmicutes were highly dominant, followed by abundant Bacteroidetes, along with Actinobacteria, Tenericutes, and Proteobacteria (Fig 1A). The most abundant culturable genera identified from cecal microbiota reads were Faecalibacterium and Oscillospira followed by Ruminococcus, Coprococcus, Lactobacillus, Blautla, Bacteroides, Eubacterium, Dorea, Coprobacillus, and Eggerthella. The remaining identified bacteria belonged to unclassified genera as presented in Fig 1B.
Fig 1.

Overall microbiota composition variation of broilers within different groups (top) the most dominant phyla, and (bottom) the 20 most abundant genera.
Cecal microbiota composition
Microbiota diversity analysis revealed no significant differences between bird treatment groups (T1: negative control, T2: positive control, S. Typhimurium challenged, T3: OA (3.0 g/kg), T4: OA (3.0 g/kg) and S. Typhimurium challenged) using several alpha diversity parameters including Shannon, Richness, Chao1, Evenness, and Simpson indexes (Fig 1A). Likewise, when we separated birds based on the two main factors of the trial (S. Typhimurium challenge and OA supplementation) we detected a marginal increase in the number of species present and their Simpson's diversity index marginally influenced by organic acid supplementation (P = 0.081) (Fig 2B).
Fig 2. Multivariate redundancy analysis (RDA) plots at a phylum, genus, and OTU levels.
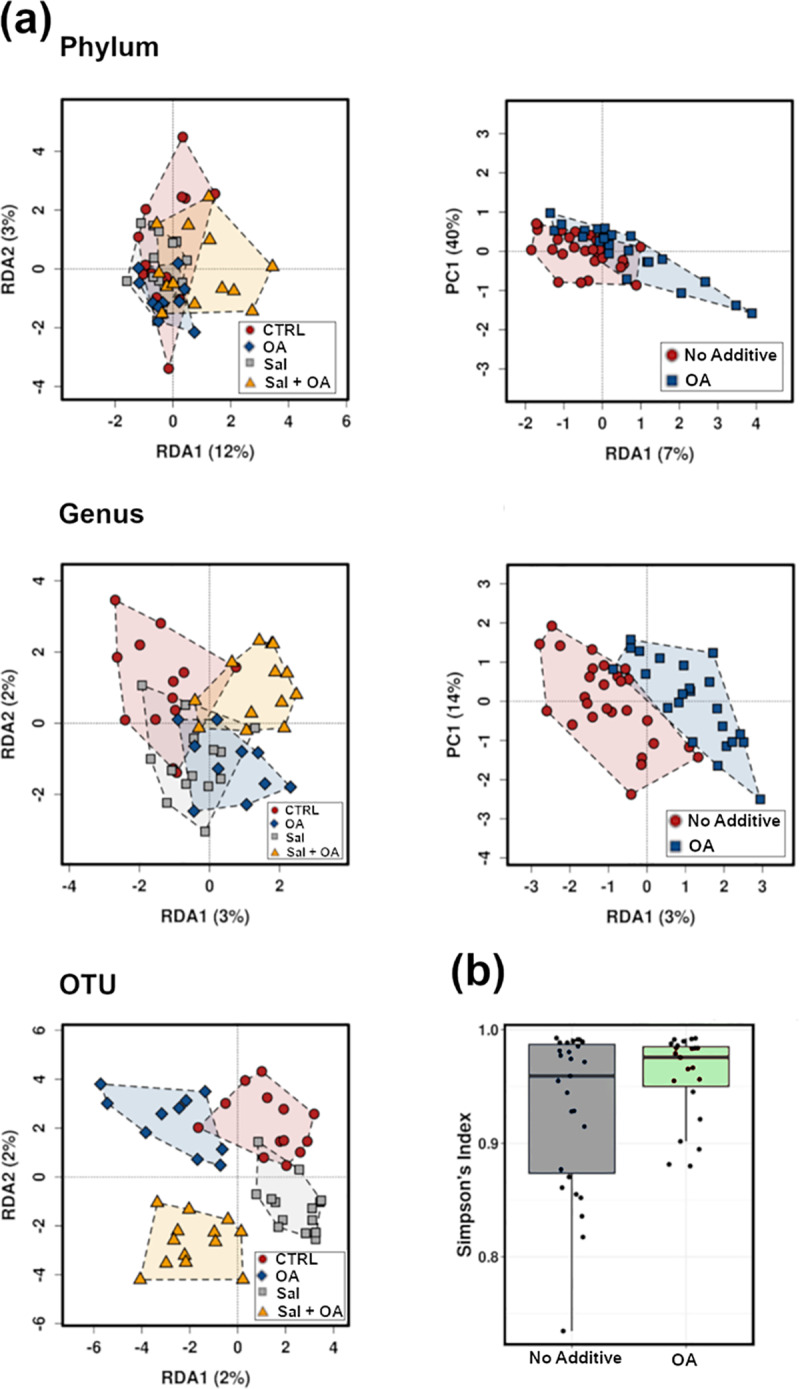
Showing OA supplementation significantly impacting beta diversity at phylum and genus level (a), Alpha diversity marginally affected by organic acid OA (P = 0.0.81) (b), CTR: negative control.
Multivariate RDA analysis showed highly significant differences in microbiota composition at a phylum level (P = 0.003) between the 4 groups with no significant difference by Salmonella (P = 0.263) but with a significant effect of OA blend as a factor (P = 0.014). This was confirmed using 2-way PERMANOVA (Primer-e) with 99999 permutations, showing the significant influence of OA supplement (P = 0.012), the marginal influence of Salmonella (P = 0.059) and significant interactions (P = 0.027) between Salmonella challenge and OA.
At the genus level, RDA showed insignificant differences between the 4 groups (P = 0.159) and Salmonella (P = 0.513) and significant influence of OA blend (P = 0.030). Genus level significance of organic acid blend was not confirmed with 2-way PERMANOVA (P = 0.162). At an OTU level, both RDA analysis and 2-way PERMANOVA showed no significant difference between either all groups, individual factors or interactions.
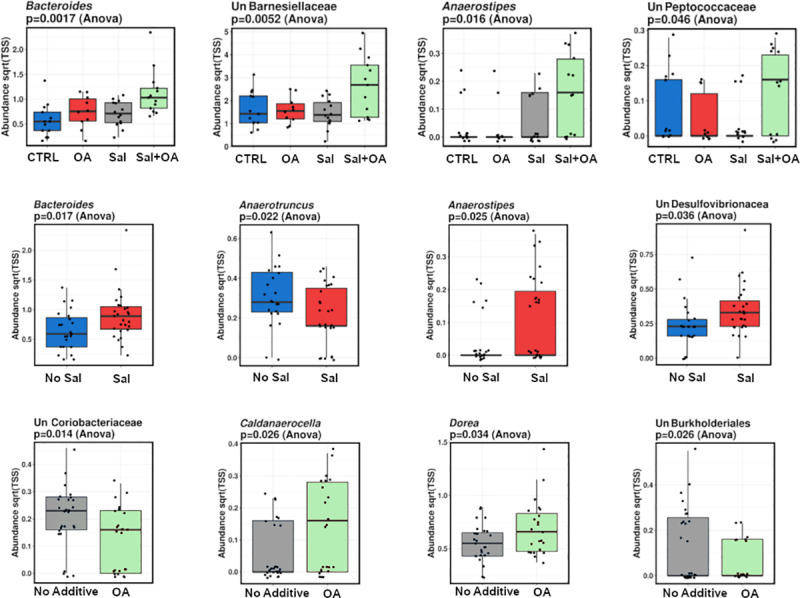
We then examined the individual impact of taxa at various taxonomic levels. At a phylum level, we found a change of Bacteroidetes (P = 0.0016) and Firmicutes (P = 0.0011), (Fig 3). S. Typhimurium was associated with a marginal increase in Bacteroidetes (P = 0.069). At the genus level, Bacteroides and unclassified Barnesiellaceae were both increased in supplemented/challenged birds (P = 0.0017, P = 0.0052) respectively. Anaerotruncus declined in S. Typhimurium infected birds (P< 0.05) while Bacteroides, Anaerostipes, and unclassified Desulfovibrionaceae were significantly higher. OA supplementation was associated with a decline in unclassified Coriobacteriaceae and unclassified Burkholderiales, and an increase in Caldanaerocella and Dorrea, (P< 0.05) (Fig 4).
Fig 3. Significant univariate changes observed on phylum level in S. Typhimurium (Sal) challenge and organic acid (OA) treatments, CTR: Negative control.
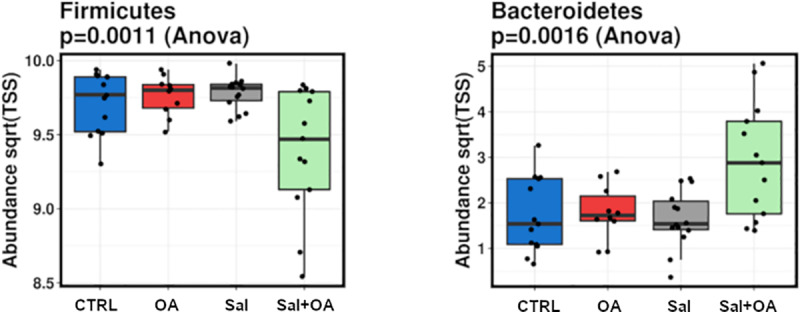
Fig 4. Genera abundances across treatment groups showing significant changes due to S. Typhimurium (Sal) challenge and/or organic acid (OA) administration.
Although beta diversity analysis showed no significant alterations at an OTU level, there were numerous OTUs changed by different treatments, individually or in combination. A number of OTUs assigned to Faecalibacterium prausnitzii were highly significantly changed, however, cumulatively the genus Faecalibacterium, in this dataset comprised only from F. prausnitzii OTUs, was not significantly altered, indicating that this could be due to the split-OTU or strain rearrangement.
Short-chain fatty acid production
A significant rise in cecal propionic acid was observed in association with S. Typhimurium challenge against any of the other treatments. OA supplemented groups were characterized by a significant increase in acetic and butyric acid concentrations, along with a decrease in the concentration of propionic and n-valeric acids (Fig 5).
Fig 5. Impact of S. Typhimurium (Sal) challenge and OA administration on six SCFA concentrations in broiler chicken cecum.
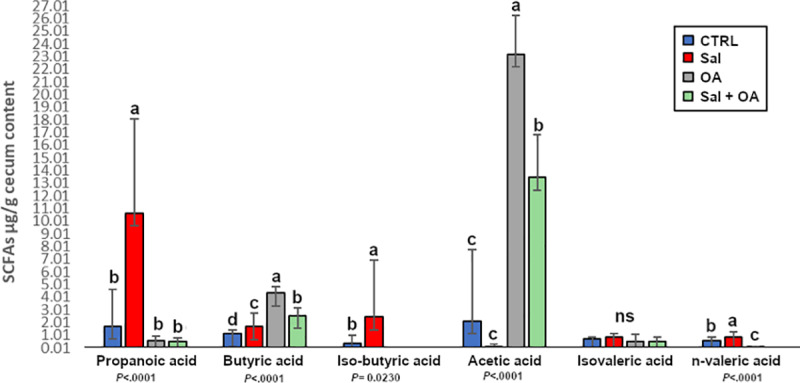
abcdMeans in the bar with different superscripts differ significantly. ns: not significant.
Discussion
S. Typhimurium is a well-known enteric pathogen that can colonize bird’s gastrointestinal tract causing salmonellosis in broiler chickens [28,29]. Salmonellosis is strongly associated with negative influence on chicken growth performance parameters which could be regarded as an indication of the severity of the infection. Reports indicate that average body weight gain can decrease by 14% to 33%, and FCR to rise by 5% to 20% [30,31]. Our results show that organic acid supplementation marginally influenced the overall performance following Salmonella challenge. This could be influenced by the sample size, and it is quite possible that the marginal improvement would become significant if we had a higher power. Abudabos and Al-Mufarrej [32] reported that the addition of essential oils and other phytogens with OA, were as efficient as an antibiotic regarding growth performance and feed utilization; therefore it is possible that other similar products can amplify the marginal improvements we detected.
Chicken GIT has two primary functions which frequently interfere with each other: nutrient absorption and utilization and defence against enteric pathogens. Normal microbiota plays a vital role in supporting host physiological homeostasis [33] and contributes to chicken’s susceptibility to bacterial infection [11]. Although several individual taxa were significantly changed in our dataset, multivariate analysis shows that total microbial community was not significantly altered by S. Typhimurium induced infection, which is consistent with previous reports in S. Enteritidis challenged chicken [34–36]. However, we found that organic OA significantly alter microbial community of birds at a phylum (P = 0.008) and genus level (P = 0.03). Comparatively, recent reports show that the broiler diet supplementation with organic acids-based formulation influences intestinal microbiota and activates the expression of gut barrier genes [37].
It was hypothesized that the use of organic acids in poultry could reduce the abundance of lactic acid bacteria present in the bird’s intestine, thereby increasing the chance of Salmonella sp. colonizing. This particularly may occur as organic acids can be restricted to the crop and may not be capable of handling a high inclusion of Salmonella [7] in the gut. Nevertheless, our performance data did not indicate any reduction in broilers ability to utilize feed and nutrients in terms of bird’s performance over the entire span of the trial. SCFA-producing genus, Bacteroides was affected by the treatments [38].
The high abundance of unclassified Barnesiellaceae was observed in supplemented and challenged birds (T4), a previous study has reported that increased Barnesiellaceae in large intestinal contents was linked to tibial dyschondroplasia (TD), which is considered one of the most serious nutritional and metabolic disorders in broilers [39]. However, this increase did not occur in individual treatment, OA (T2) or Salmonella (T3), indicating their combination may promote unclassified Barnesiellaceae. Anaerostipes were substantially increased in all challenged birds; similar results have been reported previously in S. Enteritidis inoculation birds [36]. The Anaerotruncus genus declined in S. Typhimurium infected birds; however, Liu et al. [36] reported opposing results in S. Enteritidis challenged chicken. Organic acid blend supplementation was linked to a decline in unclassified Coriobacteriaceae and unclassified Burkholderiales; similar effects were reported in tetracycline and streptomycin treated laying hens [40].
Dittoe et al. [41] showed that organic acids supplementation in poultry demonstrated competence to improve bird’s performance by changing the pH of the GIT consequently alter microbiota composition by eliminating pH-sensitive pathogens and enhancing the morphology of intestine [41]. Villi length is associated with good intestinal health and high absorptive capacity [42]. Several studies proposed that organic acids administration increases villus length in poultry [43,44]. Results from the present study show that S. Typhimurium infection was linked to decreased intestinal surface area and villus length, villus fusion, and flattening with a high degree of villus deterioration.
Organic acid blend supplementation resulted in improved villi histomorphometric measurements where the birds challenged and supplemented with organic acid blend had significantly higher villus length than the challenged group. It was previously reported that a significant increase in Faecalibacterium prausnitzii correlated with intestinal epithelial health due to its strong metabolite production, particularly butyrate [45], which also applies for human health. In our data genus Faecalibacterium was one of the most abundant genera, and significant, yet inconclusive, strain level alterations we noted cannot be reliably associated with the histological changes. Fysal® Fit 4 has been reported to improve the morphology of the ileum and lower cumulative FCR [31].
SCFAs play a powerful role in host-pathogen interactions by multiple regulatory functions for instant regulation of virulence gene in some enteric pathogens through chemical environment modification as a form of acid stress, in addition to a broad impact on host energy homeostasis [46]. SCFAs are secreted in the ceca by bacterial fermentation of complex non-digestible polysaccharides. Acetic, butyric and propionic acids are the most abundant SCFAs accounting for more than 90% of colonic SCFAs [47]. Our results show that the highest concentration of butyric, i-butyric and acetic acids were observed in organic acid supplemented broilers. Acetic acid and butyric acid have been reported to positively influence the host's energy state by providing a carbon source for intestinal microbiota through the activation of glyoxylate pathway enzymes [48–50].
Some concerns for the use of organic acids as AGPs alternatives include their possible ability to influence pH and the inability to effectively reach the lower GIT, and their predicted hindering influence on beneficial bacteria such as lactic acid bacteria. For example, Thompson and Hinton [7] noted that as SCFAs pass through the digestive tract, their concentration declines because of digestion and metabolism. Our data show that organic acid supplementation improved cecal SCFAs, which could be related to the promotion of SCFA producing microbiota, without altering major probiotic taxa such as Lactobacillus.
Acknowledgments
The authors would like to thank Jason Bell for his help in all aspects of high performance computing.
Data Availability
The raw sequencing data is available on MG-RAST database (http://metagenomics.anl.gov/) under the MG-RAST ID: mgp91659.
Funding Statement
The authors would like to extend their sincere appreciation to the Deanship of Scientific Research at King Saud University for funding this research through Research Group Project No. RGP-1441-273.
References
- 1.Jones FT, Ricke S (2003) Observations on the history of the development of antimicrobials and their use in poultry feeds. Poult Sci 82(4):613–617. 10.1093/ps/82.4.613 [DOI] [PubMed] [Google Scholar]
- 2.Cogliani C, Goossens H, Greko C (2011) Restricting antimicrobial use in food animals: lessons from Europe. Microbe 6: 274. [Google Scholar]
- 3.Huyghebaert G, Ducatelle R, Van Immerseel F (2011) An update on alternatives to antimicrobial growth promoters for broilers. Vet J 187: 182–188. 10.1016/j.tvjl.2010.03.003 [DOI] [PubMed] [Google Scholar]
- 4.Adil S, Banday T, Bhat GA, Mir MS, Rehman M (2010) Effect of dietary supplementation of organic acids on performance, intestinal histomorphology, and serum biochemistry of broiler chicken. Vet Med Int 10.4061/2010/479485 [DOI] [PMC free article] [PubMed] [Google Scholar]
- 5.Boling SD, Webel DM, Mavromichalis I, Parsons CM, Baker DH (2000) The effects of citric acid on phytate-phosphorus utilization in young chicks and pigs. J Anim Sci 78: 682–689. 10.2527/2000.783682x [DOI] [PubMed] [Google Scholar]
- 6.Patten J, Waldroup P (1988) Use of organic acids in broiler diets. Poult Sci 67: 1178–1182. 10.3382/ps.0671178 [DOI] [PubMed] [Google Scholar]
- 7.Thompson JL, Hinton M (1997) Antibacterial activity of formic and propionic acids in the diet of hens on Salmonella in the crop. Br Poult Sci 38: 59–65. 10.1080/00071669708417941 [DOI] [PubMed] [Google Scholar]
- 8.Abudabos AM, Alyemni AH, Dafalla YM, Khan RU (2017) Effect of organic acid blend and Bacillus subtilis alone or in combination on growth traits, blood biochemical and antioxidant status in broilers exposed to Salmonella typhimurium challenge during the starter phase. J Appl Anim Res 45: 538–542. [Google Scholar]
- 9.Van Immerseel F, Boyen F, Gantois I, Timbermont L, Bohez L, et al. (2005) Supplementation of coated butyric acid in the feed reduces colonization and shedding of Salmonella in poultry. Poult Sci 84: 1851–1856. 10.1093/ps/84.12.1851 [DOI] [PubMed] [Google Scholar]
- 10.Fernandez-Rubio C, Ordonez C, Abad-Gonzalez J, Garcia-Gallego A, Honrubia MP, et al. (2009) Butyric acid-based feed additives help protect broiler chickens from Salmonella Enteritidis infection. Poult Sci 88: 943–948. 10.3382/ps.2008-00484 [DOI] [PubMed] [Google Scholar]
- 11.Cisek AA, Binek M (2014) Chicken intestinal microbiota function with a special emphasis on the role of probiotic bacteria. Pol J Vet Sci 17: 385–394. 10.2478/pjvs-2014-0057 [DOI] [PubMed] [Google Scholar]
- 12.Oakley BB, Lillehoj HS, Kogut MH, Kim WK, Maurer JJ, et al. (2014) The chicken gastrointestinal microbiome. FEMS Microbiol Lett 360: 100–112. 10.1111/1574-6968.12608 [DOI] [PubMed] [Google Scholar]
- 13.Ballou AL, Ali RA, Mendoza MA, Ellis JC, Hassan HM, et al. (2016) Development of the chick microbiome: how early exposure influences future microbial diversity. Front Vet Sci 3: 2 10.3389/fvets.2016.00002 [DOI] [PMC free article] [PubMed] [Google Scholar]
- 14.Marcq C, Cox E, Szalo IM, Thewis A, Beckers Y (2011) Salmonella Typhimurium oral challenge model in mature broilers: bacteriological, immunological, and growth performance aspects. Poult Sci 90: 59–67. 10.3382/ps.2010-01017 [DOI] [PubMed] [Google Scholar]
- 15.Stanley D, Denman SE, Hughes RJ, Geier MS, Crowley TM, et al. (2012) Intestinal microbiota associated with differential feed conversion efficiency in chickens. Appl Microbiol Biotechnol 96: 1361–1369. 10.1007/s00253-011-3847-5 [DOI] [PubMed] [Google Scholar]
- 16.Fadrosh DW, Ma B, Gajer P, Sengamalay N, Ott S, et al. (2014) An improved dual-indexing approach for multiplexed 16S rRNA gene sequencing on the Illumina MiSeq platform. Microbiome 2: 6 10.1186/2049-2618-2-6 [DOI] [PMC free article] [PubMed] [Google Scholar]
- 17.Caporaso JG, Kuczynski J, Stombaugh J, Bittinger K, Bushman FD, et al. (2010) QIIME allows analysis of high-throughput community sequencing data. Nat Methods 7: 335–336. 10.1038/nmeth.f.303 [DOI] [PMC free article] [PubMed] [Google Scholar]
- 18.Edgar RC (2010) Search and clustering orders of magnitude faster than BLAST. Bioinformatics 26: 2460–2461. 10.1093/bioinformatics/btq461 [DOI] [PubMed] [Google Scholar]
- 19.Ashelford KE, Chuzhanova NA, Fry JC, Jones AJ, Weightman AJ (2005) At least 1 in 20 16S rRNA sequence records currently held in public repositories is estimated to contain substantial anomalies. Appl Env Microbiol 71: 7724–7736. [DOI] [PMC free article] [PubMed] [Google Scholar]
- 20.DeSantis TZ, Hugenholtz P, Larsen N, Rojas M, Brodie EL, et al. (2006) Greengenes, a chimera-checked 16S rRNA gene database and workbench compatible with ARB. Appl Env Microbiol 72: 5069–5072. [DOI] [PMC free article] [PubMed] [Google Scholar]
- 21.Legendre P, Gallagher ED (2001) Ecologically meaningful transformations for ordination of species data. Oecologia 129: 271–280. 10.1007/s004420100716 [DOI] [PubMed] [Google Scholar]
- 22.Zakrzewski M, Proietti C, Ellis JJ, Hasan S, Brion M-J, et al. (2016) Calypso: a user-friendly web-server for mining and visualizing microbiome–environment interactions. Bioinformatics 33: 782–783. [DOI] [PMC free article] [PubMed] [Google Scholar]
- 23.Zhao G, Nyman M, Jonsson JA (2006) Rapid determination of short-chain fatty acids in colonic contents and faeces of humans and rats by acidified water-extraction and direct-injection gas chromatography. Biomed Chromatogr 20: 674–682. 10.1002/bmc.580 [DOI] [PubMed] [Google Scholar]
- 24.Harrison C (2010) Quantification of short-chain fatty acids in cecal material by gas chromatography-mass spectrometry Thesis, Eastern Michigan University [Google Scholar]
- 25.Kloos DP, Gay E, Lingeman H, Bracher F, Müller C, et al. (2014) Comprehensive gas chromatography–electron ionisation mass spectrometric analysis of fatty acids and sterols using sequential one‐pot silylation: quantification and isotopologue analysis. Rapid Communications in Mass Spect 28: 1507–1514. [DOI] [PubMed] [Google Scholar]
- 26.Hoving LR, Heijink M, van Harmelen V, van Dijk KW, Giera M (2018) GC-MS analysis of short-chain fatty acids in feces, cecum content, and blood samples. Methods Mol Biol. 2018;1730:247–256 10.1007/978-1-4939-7592-1_17 [DOI] [PubMed] [Google Scholar]
- 27.He L, Prodhan MAI, Yuan F, Yin X, Lorkiewicz PK, et al. (2018) Simultaneous quantification of straight-chain and branched-chain short chain fatty acids by gas chromatography mass spectrometry. J Chromatogr B Analyt Technol 1092: 359–367. [DOI] [PMC free article] [PubMed] [Google Scholar]
- 28.Ribeiro AML, Vogt LK, Canal CW, Cardoso MRdI, Labres RV, et al. (2007) Effects of prebiotics and probiotics on the colonization and immune response of broiler chickens challenged with Salmonella Enteritidis. Revista Brasileira de Ciência Avícola 9: 193–200. [Google Scholar]
- 29.Van Immerseel F, De Zutter L, Houf K, Pasmans F, Haesebrouck F, et al. (2009) Strategies to control Salmonella in the broiler production chain. W Poult Sci J 65: 367–392. [Google Scholar]
- 30.Chalghoumi R, Marcq C, Thewis A, Portetelle D, Beckers Y (2009) Effects of feed supplementation with specific hen egg yolk antibody (immunoglobin Y) on Salmonella species cecal colonization and growth performances of challenged broiler chickens. Poult Sci 88: 2081–2092. 10.3382/ps.2009-00173 [DOI] [PubMed] [Google Scholar]
- 31.Abudabos AM, Al-Mufarrej SI, Alyemni AH, Yehia HM, Garelnabi AR, et al. (2014) Effect of using organic acids to substitute antimicrobial growth promoters on broiler chickens performance. J Food Agric and Environ 12: 447–451. [Google Scholar]
- 32.Abudabos A, Al-Mufarrej S (2014) Effects of organic acid supplementation on antioxidant capacity and immune responses of broilers challenged orally with Salmonella enterica subsp. enterica Typhimurium. S Afr J Anim Sci 44: 360–370. [Google Scholar]
- 33.Sommer F, Bäckhed F (2013) The gut microbiota—masters of host development and physiology. Nat Rev Microbiol 11: 227 10.1038/nrmicro2974 [DOI] [PubMed] [Google Scholar]
- 34.Videnska P, Sisak F, Havlickova H, Faldynova M, Rychlik I (2013) Influence of Salmonella enterica serovar Enteritidis infection on the composition of chicken cecal microbiota. BMC Vet Res 9: 140 10.1186/1746-6148-9-140 [DOI] [PMC free article] [PubMed] [Google Scholar]
- 35.Nordentoft S, Mølbak L, Bjerrum L, De Vylder J, Van Immerseel F, et al. (2011) The influence of the cage system and colonisation of Salmonella Enteritidis on the microbial gut flora of laying hens studied by T-RFLP and 454 pyrosequencing. BMC Microbiol 11: 187 10.1186/1471-2180-11-187 [DOI] [PMC free article] [PubMed] [Google Scholar]
- 36.Liu L, Lin L, Zheng L, Tang H, Fan X, et al. (2018) Cecal microbiome profile altered by Salmonella enterica, serovar Enteritidis inoculation in chicken. Gut Pathog 10: 34 10.1186/s13099-018-0261-x [DOI] [PMC free article] [PubMed] [Google Scholar]
- 37.Palamidi I, Mountzouris KC (2018) Diet supplementation with an organic acids-based formulation affects gut microbiota and expression of gut barrier genes in broilers. Anim Nutr 4: 367–377. 10.1016/j.aninu.2018.03.007 [DOI] [PMC free article] [PubMed] [Google Scholar]
- 38.Huang P, Zhang Y, Xiao K, Jiang F, Wang H, et al. (2018) The chicken gut metagenome and the modulatory effects of plant-derived benzylisoquinoline alkaloids. Microbiome 6: 211 10.1186/s40168-018-0590-5 [DOI] [PMC free article] [PubMed] [Google Scholar]
- 39.Tong X, Rehman MU, Huang S, Jiang X, Zhang H, et al. (2018) Comparative analysis of gut microbial community in healthy and tibial dyschondroplasia affected chickens by high throughput sequencing. Microb Pathog 118: 133–139. 10.1016/j.micpath.2018.03.001 [DOI] [PubMed] [Google Scholar]
- 40.Videnska P, Faldynova M, Juricova H, Babak V, Sisak F, et al. (2013) Chicken faecal microbiota and disturbances induced by single or repeated therapy with tetracycline and streptomycin. BMC Vet Res 9: 30 10.1186/1746-6148-9-30 [DOI] [PMC free article] [PubMed] [Google Scholar]
- 41.Dittoe DK, Ricke SC, Kiess AS (2018) Organic acids and potential for modifying the avian gastrointestinal tract and reducing pathogens and disease. Front Vet Sci 5. [DOI] [PMC free article] [PubMed] [Google Scholar]
- 42.Cengiz O, Koksal B, Tatli O, Sevim O, Avci H, et al. (2012) Influence of dietary organic acid blend supplementation and interaction with delayed feed access after hatch on broiler growth performance and intestinal health. Vet Med-Czech 57. [Google Scholar]
- 43.Gunal M, Yayli G, Kaya O, Karahan N, Sulak O (2006) The effects of antibiotic growth promoter, probiotic or organic acid supplementation on performance, intestinal microflora and tissue of broilers. Int J Poult Sci 5: 149–155. [Google Scholar]
- 44.Paul SK, Halder G, Mondal MK, Samanta G (2007) Effect of organic acid salt on the performance and gut health of broiler chicken. J Poult Sci 44: 389–395. [Google Scholar]
- 45.Miquel S, Martin R, Rossi O, Bermudez-Humaran LG, Chatel JM, et al. (2013) Faecalibacterium prausnitzii and human intestinal health. Curr Opin Microbiol 16: 255–261. 10.1016/j.mib.2013.06.003 [DOI] [PubMed] [Google Scholar]
- 46.Sun Y, O'Riordan MX (2013) Regulation of bacterial pathogenesis by intestinal short-chain Fatty acids. Adv Appl Microbiol 85: 93–118. 10.1016/B978-0-12-407672-3.00003-4 [DOI] [PMC free article] [PubMed] [Google Scholar]
- 47.Ríos-Covián D, Ruas-Madiedo P, Margolles A, Gueimonde M, de los Reyes-Gavilán CG, et al. (2016) Intestinal short chain fatty acids and their link with diet and human health. Front Microbiol 7: 185 10.3389/fmicb.2016.00185 [DOI] [PMC free article] [PubMed] [Google Scholar]
- 48.Clark DP, Cronan JE (1996) Two-carbon compounds and fatty acids as carbon sources Escherichia coli and Salmonella: cellular and molecular biology, 2nd ed ASM Press, Washington, DC: 343–357. [Google Scholar]
- 49.Panda A, Rao SR, Raju M, Sunder GS (2009) Effect of butyric acid on performance, gastrointestinal tract health and carcass characteristics in broiler chickens. Asian Austral J Anim Sci 22: 1026–1031. [Google Scholar]
- 50.Donohoe DR, Garge N, Zhang X, Sun W, O'Connell TM, et al. (2011) The microbiome and butyrate regulate energy metabolism and autophagy in the mammalian colon. Cell Metab 13: 517–526. 10.1016/j.cmet.2011.02.018 [DOI] [PMC free article] [PubMed] [Google Scholar]
Associated Data
This section collects any data citations, data availability statements, or supplementary materials included in this article.
Data Availability Statement
The raw sequencing data is available on MG-RAST database (http://metagenomics.anl.gov/) under the MG-RAST ID: mgp91659.