

Abstract
An unresolved issue in autoimmunity is the lack of surrogate biomarkers of immunological self-tolerance for disease monitoring. Here, we show that peripheral frequency of a regulatory T cell population, characterized by the co-expression of CD3 and CD56 molecules (TR3-56), is reduced in subjects with new-onset type 1 diabetes (T1D). In three independent T1D cohorts, we find that low frequency of circulating TR3-56 cells is associated with reduced β-cell function and with the presence of diabetic ketoacidosis. As autoreactive CD8+ T cells mediate disruption of insulin-producing β-cells1–3, we demonstrate that TR3-56 cells can suppress CD8+ T cell functions in vitro by reducing levels of intracellular reactive oxygen species. The suppressive function, phenotype and transcriptional signature of TR3-56 cells are also altered in T1D children. Together, our findings indicate that TR3-56 cells constitute a regulatory cell population that controls CD8+ effector functions, whose peripheral frequency may represent a traceable biomarker for monitoring immunological self-tolerance in T1D.
T1D is an autoimmune disease characterized by T cell-mediated destruction of insulin producing β-cells in the pancreas2. An unresolved issue in T1D is the lack of biomarkers able to track immunological self-tolerance and disease progression in autoimmune disorders such as T1D. Peripheral blood of healthy individuals contains a T cell subset co-expressing CD3 and CD56 molecules4, whose peripheral frequency has been associated with different pathological conditions5,6. We recently observed that the number of CD3+CD56+ T cells present at T1D diagnosis, directly reflected residual β-cell function one-year later7.
To gain further insight into the physio-pathological relevance and the potential regulatory function of CD3+CD56+ T cells (herein defined as TR3-56 cells), we first enumerated circulating TR3-56 cells (see Supplementary Figure 1 for gating strategy) in a large cohort (enrolled in Campania Region of Italy, herein “Italian cohort”) of pre-puberty T1D children at disease onset (n=128), in comparison with healthy children (n=113) (Supplementary Table 1). We found that T1D children had reduced percentage and absolute number of TR3-56 cells compared with healthy controls (Fig. 1a, left and right). The observed differences were maintained also after adjusting the comparison for sex, age and body mass index (BMI) (Extended Data 1a, left and right). The lower frequency of circulating TR3-56 cells in T1D subjects associated, at least in part, with their increased rate of necrotic death (1.5% ± 0.14, 3.9% ± 0.44 for healthy and T1D subjects, respectively), while no difference was observed in apoptosis (Extended Data 1b, left and right).
Fig. 1. TR3-56 cell enumeration predicts residual β-cell function in T1D subjects at disease onset.

a, Percentage (left) and absolute number (right) of circulating TR3-56 cells in pre-puberty T1D subjects (n=128 for percentage and n=126 for absolute number, respectively) at disease onset (Italian cohort), as compared with age-, sex-related healthy subjects (n=113). Data are presented as box plots (min, max, median, and 25th and 75th percentiles), each dot represents a individual subject. *p<0.0001 by two-tailed Mann-Whitney U-test. b, Scatter plot showing positive correlation between the frequency of circulating TR3-56 cells and serum levels of fasting C-peptide in pre-puberty subjects (Italian cohort) affected by T1D (n=128) at disease onset; r=0.71, p<0.0001 by two-tailed Pearson's correlation. Red line indicates regression line and shading indicates confidence interval. c, Scatter plot showing positive correlation between the absolute number of circulating TR3-56 cells and serum levels of fasting C-peptide in pre-puberty T1D subjects (n=126) at disease onset from Italian cohort; r=0.57, p<0.0001 by two-tailed Pearson's correlation. Red line indicates regression line and shading indicates confidence interval. d, Box plots indicate the percentage (left) and absolute number (right) of circulating TR3-56 cells in post-puberty young adults T1D (n=19 for percentage and n=18 for absolute number, respectively) at disease onset (Italian cohort), as compared with age-sex related healthy subjects (n=14). Each dot represents an individual subject. Data are shown as described for a. ap=0.0001, *p<0.0001 by two-tailed Mann-Whitney U-test. e, Scatter plot showing positive correlation between the frequency of circulating TR3-56 cells and serum levels of fasting C-peptide in post-puberty young adults T1D (n=19) at disease onset from Italian cohort; r=0.46, p=0.0477 by two-tailed Pearson's correlation. Red line indicates regression line and shading indicates confidence interval. f, Scatter plot showing the correlation between the absolute number of circulating TR3-56 cells and serum levels of fasting C-peptide in post-puberty young adults T1D (n=18) from Italian cohort; r=0.50, p=0.0369 by two-tailed Pearson's correlation. Red line indicates regression line and shading indicates confidence interval.
Next, we asked whether TR3-56 cells associated with residual pancreatic β-cell function (measured as circulating fasting C-peptide) in T1D at disease onset. To this end we performed a bivariate analysis that revealed a positive correlation between peripheral frequency and absolute number of TR3-56 cells and fasting C-peptide levels (r=0.71, p<0.0001; r=0.57, p<0.0001, respectively) (Fig. 1b,c).
As diabetic ketoacidosis (DKA), haemoglobin A1c (HbA1c) and daily insulin dose strongly influence T1D complication overtime8,9, we applied a logistic regression modeling on these parameters and revealed that low percentages of TR3-56 cells were able to predict DKA at disease onset (Extended Data 1c, left). Prognostic validity of the fitted model was evaluated by receiver operating characteristic (ROC) curve analysis and measured using the area under the curve (AUC) (Extended Data 1c, right). Low absolute counts of TR3-56 cells also associated with the presence of DKA (Extended Data 1d, left and right). Finally, the frequency and absolute numbers of TR3-56 cells did not associate either with HbA1c values or with daily insulin dose (Supplementary Figure 2).
We corroborated our findings also in post-puberty young T1D adults at diagnosis (Italian cohort, n=19) (Supplementary Table 2). Specifically, we observed that TR3-56 cell frequency and absolute number were reduced compared to age-matched healthy subjects (n=14) (Fig. 1d, left and right), positively correlated with plasma levels of fasting C-peptide (r=0.46, p=0.047; r=0.50, p=0.0369, respectively) (Fig. 1e,f) and negatively associated with presence of DKA (Extended Data 1e,f).
Then, to further validate TR3-56 cells as traceable biomarker of T1D progression, we analysed an independent cohort of children with recent-onset T1D (n=36) recruited at Linköping University Hospital, Sweden (Supplementary Table 3). In this validation cohort (herein defined as “Swedish cohort”), bivariate analysis further confirmed that the frequency of circulating TR3-56 cells positively correlated with fasting C-peptide (r=0.63, p<0.0001) (Fig. 2a).
Fig. 2. Validation and specificity of TR3-56 cell predictive role.
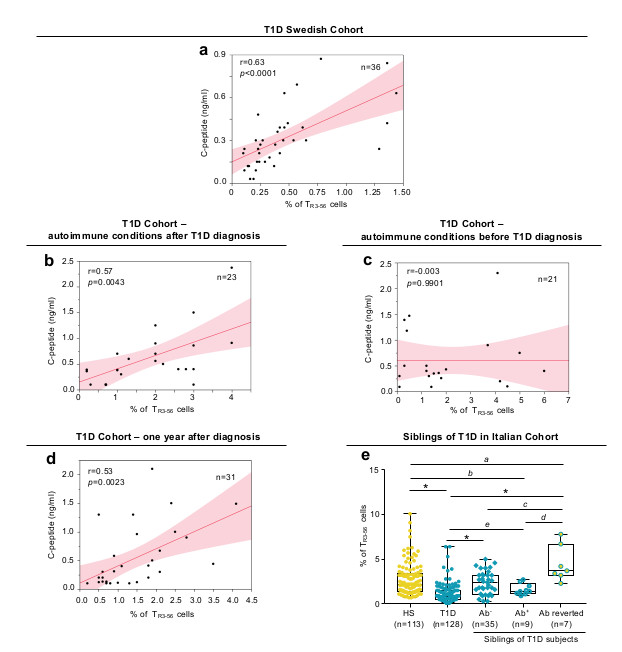
a, Scatter plot showing positive correlation between the frequency of circulating TR3-56 cells and serum levels of fasting C-peptide in a validation cohort (Swedish cohort) of T1D children (n=36) at disease onset; r=0.63, p<0.0001 by two-tailed Pearson's correlation. Red line indicates regression line and shading indicates confidence interval. b, Scatter plot showing positive correlation between the frequency of circulating TR3-56 cells and serum levels of fasting C-peptide in a cohort of T1D children that developed other autoimmune conditions after T1D diagnosis (n=23); r=0.57, p=0.0043 by two-tailed Pearson's correlation. Red line indicates regression line and shading indicates confidence interval. c, Scatter plot showing the absence of statistical correlation between the frequency of circulating TR3-56 cells and serum levels of fasting C-peptide in children (n=21) that at T1D diagnosis were already affected by other autoimmune conditions (CD or AIT); r=-0.003, p=0.9901 by two-tailed Pearson's correlation. Red line indicates regression line and shading indicates confidence interval. d, Scatter plot showing positive correlation between the frequency of circulating TR3-56 cells and serum levels of fasting C-peptide in T1D subjects one year after diagnosis (Italian cohort) (n=31); r=0.53, p=0.0023 by two-tailed Pearson's correlation. Red line indicates regression line and shading indicates confidence interval. e, Box plot indicates the frequency of TR3-56 cells in healthy subjects (n=113), T1D children at diagnosis (n=128) and in 51 at-risk siblings of T1D individuals: 35 autoantibody negative (Ab-), 9 autoantibody positive (Ab+) and 7 autoantibody positive reverted to autoantibody negative (Ab reverted) subjects. Data are presented as box plots (min, max, median, and 25th and 75th percentiles), each dot represents a individual subjects. ap=0.0084; bp=0.0456; cp=0.006; dp=0.0007; ep=0.0106; *p<0.0001 by two-tailed Mann-Whitney U-test.
Next, we measured specificity of our findings in a third independent cohort of T1D subjects (n=44) recruited at European Laboratory for the Investigation of Food-Induced Disease (ELFID), University of Napoli “Federico II” (Supplementary Table 4), in which T1D at diagnosis was associated or not with another autoimmune disorder/immune dysregulation [(either autoimmune thyroiditis (AIT) or coeliac disease (CD)]. Strikingly, in 23 out of 44 children at T1D diagnosis (going to develop also CD or AIT in the following three years), bivariate analysis confirmed the positive correlation between TR3-56 cells and fasting C-peptide levels (r=0.57, p=0.0043) (Fig. 2b). Logistic regression modeling established that peripheral percentages of TR3-56 cells indicated the presence of DKA (Extended Data 2a left and right). On the contrary, in 21 out of the 44 children that at T1D diagnosis were already affected by either CD or AIT, TR3-56 cells did not show statistical correlation with fasting C-peptide levels (r=-0.003, p=0.9901) (Fig. 2c), and weakly associated with the presence of DKA (Extended Data 2b, left and right).
To exclude that the association between TR3-56 cells and C-peptide relied on metabolic alterations (i.e. hyperglycaemia and DKA) both typical of T1D onset, we assessed their frequency also in T1D subjects (n=31) one year after T1D diagnosis when metabolic alterations have been stabilized. In these subjects, we found that TR3-56 cell frequency positively correlated with plasma levels of fasting C-peptide (r=0.53, p=0.0023) and reflected residual β-cell mass (Fig. 2d).
Finally, to rule out the possibility of a bias induced by the presence of possible outliers in the peripheral frequency of TR3-56 cells, analyses excluding these subjects were performed and also revealed statistical correlation between TR3-56 cells and fasting C-peptide (Supplementary Figure 2).
To investigate whether frequency of TR3-56 cells also associated with pre-symptomatic stages of T1D, we measured the frequency of TR3-56 cells in 51 at-risk subjects, siblings of T1D individuals from our main “Italian cohort” followed over time every six months from 2015. This included 35 autoantibody negative (Ab), 9 autoantibody positive (Ab+) and 7 autoantibody positive that reverted into autoantibody negative (Ab reverted) subjects. Interestingly, we observed that frequency of TR3-56 cells was significantly higher in “Ab reverted” subjects compared with healthy, Ab- and Ab+ children (Fig. 2e). We also noticed a significant reduction of TR3-56 cells in Ab+ subjects with respect to healthy individuals (Fig. 2e). In all, peripheral frequency of TR3-56 cells can act as specific non-invasive T1D biomarker able to reflect disease progression and severity in T1D at onset and far from diagnosis. However, further investigations on larger cohorts of at-risk subjects are need to confirm TR3-56 cells as biomarker of early asymptomatic phase of disease.
Moreover, if the development of T1D was anticipated by another immune-mediated disorder (either CD or AIT), TR3-56 cells failed to predict T1D progression, probably as consequence of confounding factors related to an already compromised immunological self-tolerance associated with the first autoimmune disorder.
Since high frequency of TR3-56 cells associated with a preserved residual β-cell reservoir, we hypothesised a possible, unexplored, immune regulatory role for this cellular subset. To test this hypothesis, first we characterized TR3-56 cells in adult healthy donors and subsequently we assessed their function, surface phenotype and molecular profile in T1D children. Specifically, we measured the capacity of flow-sorted human TR3-56 cells to affect proliferation of in vitro T cell receptor (TCR)-stimulated human CD8+ and CD4+ T cells from adult healthy donors. Strikingly, we observed that TR3-56 cells inhibited proliferation of both CD8+ and CD4+ T cells (Fig. 3a), with the main suppressive effect on the proliferation of the CD8+ subset (Fig. 3a). These findings prompted us to focus on the ability of TR3-56 cells to suppress effector/cytotoxic functions of CD8+ T lymphocytes. We evaluated the ability of TR3-56 cells to control cytotoxicity of human CD8+ T cells (effectors) against allogeneic target (see experimental procedure Supplementary Figure 3). Specifically, TR3-56 cells, compared with control cells, suppressed lytic capacity of CD8+ effector cells at different effector:target ratio (Fig. 3b). Next, we further explore the regulatory activity of TR3-56 cells on cytolytic T lymphocytes (CTLs), generated from CD8+ T cells stimulated with human recombinant (hr) IL-2 in vitro10,11 (see experimental procedure Supplementary Figure 4). CTLs were co-cultured with TR3-56 cells or control cells and stimulated for 4 hours via TCR to evaluate cytotoxic activity (measured by CD107a/LAMP-1 expression as readout of cytotoxicity12,13) and IFN-γ production by CTLs (see experimental procedure Supplementary Figure 4 and gating strategy Supplementary Figure 5). TR3-56 cells significantly suppressed CTL effector functions, while addition of either Natural Killer (NK) or CD8+ T cells (as internal control), was unable to affect CD107a/LAMP-1 expression and IFN-γ production by CTLs (Fig. 3c). We found that TR3-56 cell suppressive functions were maintained also in co-culture with allogeneic CTLs (Extended Data 4a).
Fig. 3. TR3-56 cells regulate CD8+ effector functions by modulating intracellular ROS levels.

a, Suppression exerted by TR3-56 (blue) or control cells on the proliferation of CFSE-labelled CD8+ (left panel) and CFSE-labelled CD4+ (right panel) lymphocytes TCR-stimulated for 72 hours in vitro, at different ratios. Data are from independent experiments, n=6 for TR3-56 cells and n=3 for CD3+ cells. Error bars represent SEM. ap=0.0013; ****p<0.0001 by two-way ANOVA corrected for multiple comparison using Bonferroni test. b, Cytolytic activity of CTLs against allogeneic PBMCs. PBMCs (target) are CFDA-labelled and co-cultured for 3 hours with allogenic CTLs, either in the presence of TR3-56 or control cells (see also Supplementary Figure 3). Data are from five independent experiments (n=5). ap=0.0376; bp=0.0460 by two-tailed Student's t-test. Data are expressed as mean ± SEM. c, Left, CD107a/LAMP-1 and IFN-γ staining of CTLs after 4 hours stimulation via TCR alone (grey), in the presence of TR3-56 (blue) or control cells (see also Supplementary Figure 4). Data are from one representative experiment out of nine. Dotted lines indicate unstimulated cells. Numbers indicate percentage of positive cells. Right, cumulative data from nine independent experiments. Data are expressed as mean ± SEM. ap=0.0039 by two-tailed Wilcoxon matched pairs test. d, CD107a/LAMP-1 and IFN-γ from CTLs stimulated for 4 hours via TCR alone (grey), in the presence of TR3-56 cells (blue) or when TR3-56 cells were separated in transwell plate (bold blue). Data are expressed as mean ± SEM. Data are from six independent experiments (n=6). ap=0.013 by two-tailed Wilcoxon matched pairs test. e, Kinetics of DCF staining, as a measure of intracellular ROS levels, of CTLs TCR-stimulated alone (grey) with TR3-56 (blue), or in the presence of control cells. Numbers in plot show the MFI. Data are from one representative experiment out of three. f, CD107a/LAMP-1 and IFN-γ production by CTLs stimulated for 4 hours via TCR alone (grey) or in the presence of TR3-56 cells (blue); light blue boxes indicate co-culture of TR3-56 cells with menadione pre-treated CTLs. Data are from six independent experiments. Data are expressed as mean ± SEM. ap=0.013 by two-tailed Wilcoxon matched pairs test.
To identify the molecular mechanisms of TR3-56 cell suppression, we assessed whether this function relied on either cell-to-cell contact, secretion of soluble factors or both. Trans-well experiments revealed that TR3-56 cells were unable to exert regulatory activity when separated from CTLs (Fig. 3d and Extended Data 4b). Therefore, their contact-mediated suppressive activity was independent on the expression of CD56 molecules (Extended Data 4c).
ROS-mediated signalling has been frequently associated with degranulation processes and IFN-γ production by CTLs14,15. We studied dynamic changes of cytosolic and mitochondrial ROS levels upon TCR-stimulation of CTLs cultured with TR3-56 cells. Cytosolic CTLs ROS levels, evaluated by 2',7'-dichlorodihydrofluorescein diacetate (DCF) staining, were significantly reduced by TR3-56 cells (Fig. 3e); control cells (NK or CD8+ T cells) did not influence cellular ROS levels in CTLs (Fig. 3e). Conversely, TR3-56 cells did not affect mitochondrial-derived ROS in CTLs, as testified by mitoSOX staining (Supplementary Figure 6). To confirm the role of cellular ROS in mediating TR3-56 cell regulatory activity, we took advantage of the ability of menadione, an analogue of 1,4-naphthoquinone, to generate intracellular ROS via redox cycling16,17. TR3-56 cells are unable to suppress CD107a/LAMP-1 expression and IFN-γ of menadione pre-treated CTLs (Fig. 3f and Extended Data 5). In addition, menadione per se was unable to induce in vitro CTL activation in absence of TCR stimulation (Extended Data 5). To note, treatment with the ROS-inhibitor, N-acetyl-L-cysteine (NAC), completely blocked CTL activation18, suggesting that TR3-56 cells control CD8+ responses by modulating cytosolic ROS.
Finally, adult TR3-56 cells were also characterized for metabolic features (glycolysis and oxidative phosphorylation) and their transcriptional signature. Seahorse analysis revealed that upon TCR stimulation, TR3-56 cells have a distinct metabolic phenotype compared to NK, CD8+ and CD4+ cells, as preferentially utilizing OXPHOS as the main cellular bio-energetic source (Supplementary Figure 7). Microarray analysis of RNA from TR3-56 cells revealed their distinct transcriptomic signature, compared to NK, CD3+CD56- and CD8+ subsets (Supplementary Figure 8).
Compelling experimental evidence supports the central role of T lymphocytes in immune-mediated damage of β-cells in T1D19–21. Autoreactive CD8+ T lymphocytes kill β-cells through release of cytolytic granules and by production of tissue damaging pro-inflammatory cytokines22,23. As specific regulatory networks targeting CD8+ T cell functions are still poorly understood in T1D, we explored whether human TR3-56 cells are involved in T1D pathogenesis. We evaluated suppressive capability, phenotype, cytokine production and transcriptomic-molecular signature of TR3-56 cells isolated from recent-onset T1D subjects in comparison with those of healthy children. Notably, TR3-56 cells isolated from newly diagnosed T1D subjects had a decreased ability to modulate TCR-dependent CD107a/LAMP-1 expression of autologous CTLs (Fig. 4a). This impaired suppressive function was not due to the presence of suppression-resistant CD8+ T cells in T1D subjects, since CTLs from T1D resulted to be sensitive to regulatory activity of TR3-56 cells from healthy individuals (Fig. 4b). These results indicate that suppressive capability of TR3-56 cells is impaired in T1D children at diagnosis.
Fig. 4. Functional and molecular dysregulation of TR3-56 cells from recent-onset T1D children.

a, CD107a/LAMP-1 staining of CTLs TCR-stimulated for 4 hours alone (grey) or with autologous TR3-56 cells (blue) from one representative healthy (upper) and T1D individual (lower). Right, suppression of CD107a/LAMP-1 in CTLs from T1D (n=11) and healthy subjects (n=15), in presence of autologous TR3-56 cells. Each dot represents an individual subject. Data are expressed as mean ± SEM. ap=0.0456 by two-tailed Mann-Whitney U-test. b, CD107a/LAMP-1 expression in CTLs, from T1D subject, TCR-stimulated for 4 hours alone (left), in the presence of autologous (middle) or allogeneic (right) TR3-56 cells from a control. Data are from one representative experiment out of three. Dotted lines indicate unstimulated CTLs. Numbers indicate percentage of positive cells. c, Expression of molecules on TR3-56 cells from healthy and T1D individuals. Data are from n=16 HS, n=24 T1D for all molecules except for CD94 (n=16 HS, n=22 T1D), NKG2C (n=16 HS, n=21 T1D) and CXCR4 (n=14 HS, n=19 T1D). Each dot represents an individual subject. Data are expressed as mean ± SEM. ap=0.04; bp=0.0442; cp=0.0294; dp=0.044; ep=0.0062; fp=0.0147; gp=0.0211; hp=0.0041; ip=0.0010; *p<0.0001 by two-tailed Mann-Whitney U-test. d, Cytokines released by TR3-56 cells TCR-activated for 48 hours in vitro from healthy and T1D individuals (n=4 HS, n=6 T1D for IFN-γ, IL-8 and IL-9; n=5 HS, n=6 T1D for IL-4, IL-13 and IL-31; n=4 HS and T1D for IL-15 and IL-17A; n=6 HS, n=9 T1D for IL-2; n=6 HS, n=10 T1D for IL-10; n=6 HS, n=8 T1D for IL-23; n=5 HS, n=7 T1D for IL-22; n=5 and T1D for TNF-α; n=6 HS, n=7 T1D for TNF-β). Each dot represents an individual subject. Data are expressed as mean ± SEM. ap=0.0381; bp=0.0132; cp=0.0476; dp=0.0043; ep=0.0286; fp=0.0426; gp=0.0366; hp=0.0317 by two-tailed Mann-Whitney U-test. e, Heatmap of z-scored RNA-Seq expression values of 33 genes with a log2FoldChange<-1.0 in comparison of TR3-56 cells from healthy and T1D subjects (n=3 for group). f, Protein-protein interaction network reconstructed from STRING database and differentially expressed transcripts (log2FoldChange<-1.0 as in e) identified by comparing RNA-Seq profiles from TR3-56 cells of both group (n=3 for group) by non-parametric/permutation-based and multiple testing correction according to Benjamini and Hochber. In blue, 23 genes leading to a significant enrichment of the cellular component “membrane” (GO:0016020) (FDR=0.0059).
Surface phenotypic analysis revealed that TR3-56 cells from recent-onset T1D children were comparable to healthy controls for CD4, CD8, CD45RA, CD45RO and CD27 expression while CD28 surface levels were significantly higher in TR3-56 cells from T1D subjects (Fig. 4c and Extended Data 6a, left and right). Also, TR3-56 cells from T1D children had reduced surface expression of activating/inhibitor receptors (CD94, NKG2A, NKG2C, NKG2D, DNAM-1 and CD16)24 and cytotoxicity-related molecule (Granzyme-B)23, compared to healthy children (Fig. 4c). On the other hand, TR3-56 cells from recent-onset T1D children expressed increased surface levels of chemokine receptors homing cells in the pancreas, such as CXCR3, CXCR4 and CCR7 (Fig. 4c)25–27. Low or moderate levels of main TReg cell-associated markers28, such as CD25, the transcription factor forkhead box P3 (FoxP3), CTLA-4, CD39, GITR and PD-1 were expressed on TR3-56 cells from both control and T1D subjects (Supplementary Figure 9).
Finally, FACS analysis revealed that TR3-56 cells from both healthy controls and T1D subjects are distinct from the invariant (i)NKT subset29,30, as they are not CD1d-restricted, do not express Vα24/Vβ11 TCR chains and display a heterogeneous β TCR repertoire (Extended Data 6a,b).
Multiplex cytokine analysis showed that TR3-56 cells from new onset T1D individuals released, upon 48 hours of TCR stimulation, reduced amount of IFN-γ, IL-2, IL-4, IL-13, IL-21, IL-22, TNF-α compared with healthy children (Fig. 4d); on the other side, TR3-56 cells from T1D children secreted increased amounts of IL-15 and IL-17A (Fig. 4d), while no significant differences were observed for other cytokines such as IL-8, IL-9, IL-10, IL-31, TNF-β (Fig. 4d). Furthermore, an un-biased high-throughput analysis (RNA-seq) of the transcriptome expressed by TR3-56 cells from T1D children in comparison with age- and sex-matched healthy controls revealed the dysregulation of several genes that may contribute to T1D-depedent functional impairment of this cell subset. In particular, we concentrated our attention on genes (n=33, see Fig. 4e) whose mean level was found decreased of more than two folds in T1D cells compared to the healthy counterpart: the majority of these genes (n=23) encoded for proteins functionally linked to the membrane, suggesting a rearrangement of the cell surface in T1D (Fig. 4f). Specifically, TR3-56 cells from newly diagnosed T1D expressed lower levels of the G protein-coupled receptor 65 (GPR65) gene, that has been genetically associated with autoimmune disorders31, KLRB1 (alias CD161) and KLRC1 (alias NKG2A), two killer cell lectin like receptors, described to function as inhibitory determinants in human NK cells 32,33. Further, we also spotted in T1D TR3-56 cells decreased expression of genes encoding for proteins related to regulatory functions, such as Lysosomal Protein Transmembrane 4 Beta (LAPTM4B)34 and hydroxyprostaglandin dehydrogenase (HPGD)35.
In summary, this study reveals that TR3-56 cells may represent a disease biomarker with a previous undisclosed role in human T1D. In three independent cohorts - from Italy and Sweden - of new onset T1D subjects, we found that lower frequency of this cellular subset associates with reduced insulin-secreting capacity and with undesirable disease outcome, such as DKA. Also, we found that TR3-56 cells possess a certain degree of specificity for T1D as their enumeration failed to predict disease progression when T1D was preceded by another autoimmune disease as confounding factor. Moreover, TR3-56 cells associated to C-peptide levels also later from T1D diagnosis (one year later), when metabolic alterations have been normalized. In all, our results also revealed functional, phenotypic and molecular impairments in TR3-56 cells isolated at T1D onset suggesting a "general" dysregulation of this cellular subset in T1D, also confirmed by reduced expression of either inhibitory/activating receptors and of genes encoding for proteins involved in canonical TReg cell-mediated suppressive functions (i.e. LPTMB4 and HPGD)32–35. In an integrate view, defects of TR3-56 cells associate with attack of pancreatic β-cells by islet-specific auto-reactive CD8+ T cell clones, impacting on residual insulin production and influencing T1D progression (Extended Data 7). Further, TR3-56 cell counts may represent a valuable criterion to monitor disease progression also improving stratification of individuals for T1D trials and identify at-risk pre-diabetic subjects during the asymptomatic phase of the disease. It is clear that more research is needed to further strengthen our findings, and studies are in progress also in other autoimmune disorders to expand the role of TR3-56 cells in immunological self-tolerance and their potential translational relevance in a wider perspective. In conclusion, we propose a model in which in healthy conditions, TR3-56 cells might participate to immune regulation to preserve tissue integrity of insulin-producing β-cells (Extended Data 7). An alteration in number and/or function of this cellular subset could lead to β-cell damage and loss of endogenous insulin production (measured as fasting C-peptide), thus allowing the seed of autoimmunity to take root (Extended Data 7).
Methods
Healthy and T1D subjects
Diagnosis of T1D was defined according to the Global International Diabetes Federation/International Society for Pediatric and Adolescent Diabetes Guidelines for Diabetes in Childhood and Adolescence36 and included symptoms of diabetes in addition to casual plasma glucose concentration ≥11.1 mmol/L (200 mg/dl), or fasting plasma glucose ≥7.0 mmol/l (≥126 mg/dl), or 2 hours post load glucose ≥11.1 mmol/l (≥200 mg/dl) during an oral glucose tolerance test, and glycated haemoglobin (HbA1c) ≥6.536. Recent-onset T1D subjects and individuals one year after T1D diagnosis from Italian cohort were recruited at the Dipartimento di Scienze Mediche Traslazionali, Sezione di Pediatria, Università di Napoli “Federico II” (Prof. Adriana Franzese). T1D subjects from the validation Swedish cohort were recruited at Crown Princess Victoria Children´s Hospital, University Hospital, Linköping, Sweden (Prof. Johnny Ludvigsson); PBMCs were isolated and frozen at the Division of Pediatrics, Departement of Biomedical and Clinical Sciences, Linköping University, Sweden. Subjects from the cohort which developed other AIDs (CD or AIT) before or after T1D diagnosis were recruited at European Laboratory for the Investigation of Food-Induced Disease (ELFID), Università di Napoli “Federico II” (Prof. Riccardo Troncone). CD were diagnosed in accordance with the 1990 European Society for Pediatric Gastroenterology Hepatology and Nutrition guidelines37; diagnosis of AIT was based on the presence of high levels of antithyroid antibodies (anti-thyroperoxidase and/or anti-thyroglobulin), normal or low thyroid function (T4, TSH), together with a heterogenity and hypoechogenity of thyroid parenchyma at ultrasound examination38. At-risk subjects, siblings of T1D children, were recruited at the Dipartimento di Scienze Mediche Traslazionali, Sezione di Pediatria, Università di Napoli “Federico II”. Autoantibody positive subjects were positive for at least two autoantibodies. Healthy children were recruited at the Dipartimento di Scienze Mediche Traslazionali, Sezione di Pediatria, Università di Napoli “Federico II” (Prof. Adriana Franzese). Blood samples from individuals with recent-onset T1D was achieved 10 d after glycaemic stabilization by treatment with exogenous insulin (glucose values between 3.5-10 mmol/l or 80-180 mg/dl) and all of them were positive for at least two anti-islet autoantibody. Healthy subjects were matched for sex, age and BMI with T1D subjects and selected by the following criteria: fasting blood glucose of <5.5 mmol/L (<100 mg/dl), negative personal and familial history of autoimmune disorders, and negativity for islet autoantibodies at the 99th percentile. T1D and healthy subjects with recent vaccinations or infections were excluded from the study. See Supplementary Tables 1-4 for demographic and clinical characteristics of T1D cohorts and healthy subjects.
Institutional Review Board of the Ethics Committee of University of Naples “Federico II” approved the study (Prot. N. 200/16 and N.161/18). Approval by the Research Ethics Committee by Linköping University was obtained (Dnr 02-482). All adult human subjects, or parents of participating children, provided written informed consent. We have complied with all relevant ethical regulations.
Laboratory testing
Blood samples from T1D subjects, at-risk siblings and from healthy individuals were withdrawn at 8.00 a.m. into heparinized BD Vacutainers and processed within the following 4 hours. Serum or plasma were obtained after centrifugation and kept at −80°C until use. Fasting C-peptide levels were measured in duplicate serum samples, at the same time for all samples, using a commercial ELISA kit (Merck Millipore Corporation). Results for each assay were validated, and a high- and low-level control sample were included. Glucose levels were measured using enzymatic hexokinase method and HbA1c by high-performance liquid chromatography (HLC-723 G7 TOSOH, Bioscience). Islet autoantibodies (GADA, IA-2A, IAA, ZnT8), transglutaminase IgA and antithyroid antibodies (anti-thyroperoxidase and/or anti-thyroglobulin) were measured by commercial ELISA (Pantec). Whole blood cells were analysed with a clinical-grade haemocytometer to determine absolute lymphocyte numbers in each sample. Remaining part of blood samples was processed and after Ficoll-Hypaque (GE-Healthcare) gradient centrifugation, PBMCs were obtained.
For the validation T1D Swedish cohort, blood samples were processed at Division of Pediatrics, Department of Clinical and Experimental Medicine, Medical Faculty Linköping University, Sweden. PBMCs were obtained and cryopreserved in liquid nitrogen. An aliquot of them were shipped to our laboratory at IEOS-CNR and kept in liquid nitrogen until use. Nitrogen cryopreserved PBMCs from Swedish cohort were thawed as follows: cryovials containing frozen cells were removed from liquid nitrogen storage and placed into a 37°C water bath; the vials were gently swirling in the 37°C water bath until there was a small amount of ice left in the vial. Pre-warmed complete growth medium (RPMI 10% FBS) drop wise into the cryovial containing the thawed cells. After centrifugation cells were re-suspend in complete growth medium and utilized for flow cytometry staining. Viability was always assessed after defrosting and was on average > 85%.
Flow cytometry and cell isolation
PBMCs from human healthy donors, T1D subjects and at-risk siblings of T1D were stained with the following antibodies for the evaluation of TR3-56 cells: FITC anti-human CD3 (BD Pharmingen, clone UCHT1), PE-Cy7 anti-human CD56 (BD Pharmingen, clone B159).
For the evaluation of TR3-56 death cell, PBMCs were stained with the following antibodies: FITC human Annexin V (BD Pharmingen), PE-Cy7 anti-human CD56 (BD Pharmingen, clone B159), APC anti-human CD3 (BD Pharmingen, clone UCHT1), propidium iodide (BD Pharmingen); Annexin V buffer (BD Pharmingen) was used for the staining according the manufactories’ instructions.
Multiparametric flow cytometry were used for the evaluation of surface markers on TR3-56 cells from PBMCs: FITC or APC anti-human CD3 (BD Pharmingen, clone UCHT1), PE or APC-H7 anti-human CD4 (BD Pharmingen, clone RPA-T4), BV421 anti-human CD8 (BD Pharmingen, clone RPA-T8), PE anti-human CD16 (BD Pharmingen, clone 3G8), BV510 anti-human CD27 (BD Pharmingen, clone M-T271), PE anti-human CD28 (BD Pharmingen, clone CD28.2), APC anti-human CD45 (BD Pharmingen, clone HI30), FITC anti-human CD45RA (Miltenyi Biotec, clone REA562), APC anti-human CD45RO (BD Pharmingen, clone UCHL1), PeCy7 or APC anti-human CD56 (BD Pharmingen, clone B159; BD Biosciences, clone NCAM16.2), APC anti-human CD94 (BD Pharmingen, clone HP-3D9), BB700 anti-human CCR7 (BD Horizon, clone 3D12), BV510 anti-human CXCR3 (BD Optibuild, clone 1C6/CXCR3), BB700 anti-human CXCR4 (BD Horizon, clone 12G5), BV510 anti-human DNAM-1 (BD Optibuild, clone DX11), BB700 anti-human NKG2A (BD Optibuild, clone 131411), BV510 anti-human NKG2C (BD Optibuild, clone 134591), APC anti-human NKG2D (BD Pharmingen, clone 1D11), PE labelled CD1d tetramers loaded with α-galactosyl ceramide (ProImmune), PE labelled CD1d negative control tetramers (ProImmune), FITC anti-human Vα24 (Beckman Coulter, clone C15), BV421 anti-human Granzyme B (BD Horizon, clone GB11), PECy7 anti–human CD25 (BD Pharmingen, clone M-A251), BV421 anti–human PD-1 (BD Horizon, clone EH12-1), PE anti-human FoxP3-all (BD Pharmingen, clone 259D/C7), APC anti–human CD152/CTLA-4 (BD Pharmingen, clone BN13), APC anti-human CD39 (BD Pharmingen, clone TU66), BV421 anti-human GITR (BD Horizon, clone V27-580). FITC and PE labelled mAbs against TCR Vβ epitopes; anti-human Vβ1, Vβ2, Vβ3, Vβ4, Vβ5.1, Vβ5.2; Vβ5.3, Vβ7.1, Vβ7.2, Vβ8, Vβ9, Vβ11, Vβ12, Vβ13.1, Vβ13.2, Vβ13.6, Vβ14, Vβ16, Vβ17, Vβ18, Vβ20, Vβ1.3, Vβ22 and Vβ23 all from Beckman Coulter. Granzyme B expression was performed by using the fixation/permeabilization solution kit BD Cytofix-Cytoperm (BD Biosciences), according the manufacturer’s instructions. Staining for intracellular factors was performed by using fixation and permeabilization FoxP3 buffer kit (BD Pharmingen), according the manufacturer’s instructions. Samples were acquired by using a two lasers equipped FACSCanto II (BD Bioscience); at least 3x10⁴ events in the lymphocyte gate. For the evaluation of positive events, fluorescence minus one (FMO) controls were used for setting the gate; non-viable cells were detected by 7-AAD viability staining (BD Pharmingen). See Supplementary Figure 1 for gating strategy of TR3-56 cells. Cytofluorimetric analyses were performed by using FlowJo Software (FlowJo, LLC).
Human CD3+CD56+ (TR3-56), CD3− CD56+ (NK), CD3+CD56-, CD4+ and CD8+ T cells were isolated from PBMCs of human healthy donors and T1D subjects by high-performance cell sorting (BD FACS-Jazz, BD Bioscience) in the IEOS-CNR Sorting Facility in Naples, after staining with the following antibodies: FITC anti-human CD3 (BD PharMingen, clone UCHT1), APC anti-human CD56 (BD Biosciences, clone NCAM16.2), APC anti-human CD4 (BD Pharmingen, clone RPA-T4), APC anti-human CD8 (BD Pharmingen, clone RPA-T8) or by magnetic cell separation with microbeads CD3+CD56+ isolation Kit (Miltenyi Biotec), Dynabeads™ CD8 Positive Isolation Kit (Invitrogen, Thermo Fisher Scientific) and Dynabeads™ Regulatory CD4+CD25+ T Cell Kit for CD4+ cell isolation (Invitrogen, Thermo Fisher Scientific). Purity of isolated cells was 95%-99% as reported in figures.
Proliferation assays
To analyse cell division, flow-sorted CD4+ and CD8+ T cells were labelled with 5,6-carboxyfluorescein-diacetate-succinimidyl ester (CFSE) (Thermo Fischer Scientific) before the culture39. For the assessment of cell proliferation, 3x10⁴ CD4+ or CD8+ cells were cultured for 72 hours in the presence of TR3-56 cells (or CD3+CD56- control cells) stimulated with anti-CD3 plus anti-CD28 microbeads (0.2 beads/cell) (Gibco, Thermo Fisher Scientific) at different cell ratio (1:1, 1:2, 1:4, 1:8), as previously indicated39. All tests were performed in the presence of RPMI 1640 medium supplemented with 5% heat inactivated AB human serum (Euroclone). CFSE analyses were performed using BD FACSCanto II (BD Biosciences) and FlowJo software V.10 (FlowJo, LLC).
Cytotoxicity assays
To obtain CTLs directed against allogeneic targets, flow sorted CD8+ cells (purity > 95%) from adult healthy donor (effectors) were cultured with 30 Gy-irradiated allogeneic PBMCs (stimulators) for 10 days with regular hrIL-2 supplementation (20 IU/ml); allogeneic targets were obtained by anti-CD3 treatment and hrIL-2 expansion of stimulator PBMCs; specific cytotoxicity of effector cells was measured by using the 5,6-carboxyfluoresceindiacetate (CFDA) cytotoxicity assay (Molecular Probes, Eugene). Briefly, the target cells were labelled with CFDA mixed with effector cells at different E:T ratio and incubated at 37°C for 3 hours in 96-well round-bottom plates (Falcon, Becton Dickinson). The specific lysis of target cells was calculated as follows: % specific lysis = (CT-TE/CT) x100, where CT indicates mean number of fluorescent target cells in control tubes and TE indicates mean number of fluorescent cells in target plus effector tubes40,41. TR3-56 cells (or CD8+ control cells) and effector CTLs were co-cultured (at 1:1 ratio) in order to evaluate the ability of TR3-56 cells to suppress lytic capacity of effector CTLs against the CFDA-labeled allogeneic target (see experimental procedure Supplementary Fig. 3).
Degranulation assay, CD107/LAMP-1 expression and IFN-γ production
To obtain activated CTLs, flow-sorted CD8+ T cells were cultured for 36 hours in RPMI-1640 (Gibco, Life Technologies) supplemented with 5% AB human serum (Euroclone) in the presence of hrIL-2 (Roche) at 200 IU/ml. After 36 hours, CTLs were labelled with BV421-conjugated anti-human CD8 and then cultured alone or in the presence of freshly flow-sorted TR3-56, NK and CD8+ T lymphocytes at different ratio, with or without TCR-stimulation (1 bead/cell) in 96-well round-bottom plates (Falcon, Becton Dickinson). PE-conjugated anti-human CD107a/LAMP-1 (BD Pharmingen, clone H4A3) was added to the cell culture for the whole culture period (4 hours).
To avoid extracellular cytokine export, the cultures were performed in the presence of 5 μg/ml of Brefeldin-A (Sigma-Aldrich), as described42; in particular for CD107a/LAMP-1 experiments Brefeldin-A was added in the last 3 hours of culture. For IFN-γ production, CTLs were cultured as described above, while 5 μg/ml of Brefeldin-A was added to the cell culture for the whole culture period (4 hours)12,13,42. Then to evaluated IFN-γ expression, samples were fixed and permeabilized (Cytofix-Cytoperm, BD Bioscience) and stained for PE-conjugated anti-human IFN-γ (BD Pharmingen, clone B27), following the manufacturer’s instructions.
For transwell experiments, the co-culture of TR3-56 cells with CTLs was performed in the above condition using transwell inserts (Corning Life Sciences) in 24-well round-bottom plates (Falcon, Becton Dickinson). For the degranulation assay in the presence of CD56 blocking soluble human recombinant cell adhesion molecule NCAM-1/CD56 (R&D Systems Inc.) was used (10 ng/ml). The control 345.134 IgG2a mAb, recognizing a glycoprotein widely expressed on human leucocytes43 was a kind gift of Dr. S. Ferrone, and was used as described above.
In all the experiments, non-viable cells were detected by 7-AAD viability staining and both CD107a/LAMP-1 expression and IFN-γ production were evaluated in labelled-CTLs, using fluorescence values of unstimulated CTLs (medium) as negative values to identify positive gate, as described in experimental procedure in Supplementary Figure 4 and gating strategy in Supplementary Figure 5. All the experiments were performed in autologous condition except when indicated. Experiments in adult healthy subjects were performed co-culturing 1x10⁵ CTLs and 1x10⁵ TR3-56 or control cells; experiments in T1D and control children were performed co-culturing at least 3x10⁴ CTLs and 3x10⁴ TR3-56 or control cells due to the reduced volume of blood withdrawn from children and also due to the reduce frequency of this population in T1D.
ROS production
For intracellular ROS production CTLs were stained using 2',7'-dichlorodihydrofluorescein diacetate (DCF) (Sigma-Aldrich). Briefly, CTLs were stained with DCF and cultured alone or with TR3-56 or control cells in the presence of anti-CD3 plus anti-CD28; ROS production was detected after 5, 20 e 40 min of culture. Induction of intracellular ROS was obtained by treating CTLs with menadione (0.05 μM). Mitochondrial ROS was measured by MitoSOX Red Mitochondrial Superoxide Indicator (Thermo Fisher Scientific), according to manufactore's instructions. DCF and mitoSoX levels were evaluated by flow cytometry using BD FACSCanto II (BD Biosciences) and FlowJo software (FlowJo, LLC).
Seahorse analyses
Metabolic profile was evaluated in TR3-56, NK, CD3+CD56- and CD8+ cells from adult healthy subjects, in the presence of anti-CD3 plus anti-CD28 microbeads (1 bead/cell) (Gibco, Thermo Fisher Scientific) for 1 hour. Real time measurements of extracellular acidification rate (ECAR) and oxygen consumption rate (OCR) were performed by an XFe-96 Analyzer (Agilent Technologies). Specifically, cells were plated in XFe-96 plates (Agilent Technologies) at the concentration of 2 x 10⁵ cells/well and cultured with RPMI-1640 medium supplemented with 5% AB human serum. ECAR was measured in XF DMEM medium (Agilent Technologies) in basal condition and in response to 10 mM glucose, 5 μM oligomycin and 100 mM of 2DG (all from Sigma-Aldrich). OCR was measured in XF DMEM medium (supplemented with 10 mM glucose, 2 mM L-glutamin, and 1 mM sodium pyruvate), under basal conditions and in response to 5 μM oligomycin, 1.5 μM of carbonylcyanide-4-(trifluoromethoxy)-phenylhydrazone (FCCP) and 1 μM of antimycin A and rotenone (all from Sigma-Aldrich). Experiments with the Seahorse were done with the following assay conditions: 3 minutes mixture; 3 minutes wait; and 3 minutes measurement.
Transcriptome analysis
For microarray analysis flow sorted cell populations (TR3-56, NK, CD3+CD56-, CD8+ isolated were isolated from helathy adults (n=3 biological replicates for each cell population obtained from adult healthy individuals) were quantified through microarray-based human Affymetrix Clariom S Assays (Eurofins Genomics), which provides extensive coverage of all known well-annotated genes (21448 gene probes for 19525 annotated unique genes). The raw intensity values were background corrected, log2 transformed and quantile normalized using the Robust Multi-array average (RMA) algorithm. Data were imported and analysed using MultiExperimentViewer (MeV). Sample similarity was described by multivariate Principal Component Analysis (PCA) and Pearson's correlation. For supervised sample clustering, significant genes were selected by one-way ANOVA, followed by Pearson's correlation. In order to identify a TR3-56 cell specific gene expression pattern, we selected genes for having a consistent log2 fold change (either > +1 or < -1) compared to all other evaluated populations (NK, CD3+CD56- and CD8+ cells) and a significant Student’s t-test (p<0.05) for all three comparisons: TR3-56 vs NK, TR3-56 vs CD3+CD56- and TR3-56 vs CD8+ T cells.
For NGS analysis, RNA sequencing was performed by IGA technology (IGATech) services (Udine, Italy). Total RNA was extracted from TR3-56 cells isolated from either healthy subjects (n=3) or recent-onset T1D subjects (n=3) using the RNeasy Micro Kit from QIAGEN, according to manufacturer’s instructions. RNA samples were then quantified and quality tested by Agilent 2100 Bioanalyzer RNA assay (Agilent technologies, Santa Clara, CA) or Caliper (PerkinElmer, Waltham, MA). Libraries were prepared by the ‘Ovation SoLo RNA-seq Library Preparation kit’ (NuGEN, San Carlos, CA), following the manufacturer’s instructions and checked with both Qubit 2.0 Fluorometer (Invitrogen, Carlsbad, CA) and Agilent Bioanalyzer DNA assay or Caliper (PerkinElmer, Waltham, MA). Sequencing was performed on single-end 75 bp mode on NextSeq 500 (Illumina, San Diego, CA) and number of reads ranged from 29.1x10⁶ to 32.5x10⁶. Raw data were processed by Bcl2Fastq 2.0.2 version of the Illumina pipeline for both format conversion and de-multiplexing and lower quality bases and adapters were removed by ERNE Version 1.4.644 and Cutadapt 1.1645 software. Reads were then deduplicated based on unique molecular identifier (UMI) composed of 8 random bases for unambiguous identification of unique library molecules by IGATech proprietary script; and aligned on reference GRCh38 genome/transcriptome with STAR3 2.646. Full-length transcripts representing multiple spliced variants for each gene locus were assembled and quantified by Stringtie 1.3.4d47. RNA-Seq data was preprocessed by counting the overlap of reads with genes through htseq-count 0.9.148 and DESeq2 1.14.149 was used to perform comparisons between expression levels of genes and transcripts. Normalization was performed using the median-of-ratios method50 and statistical significance determined using a Wald test49.
Cytokine assessment
A total of 40.000 flow-sorted TR3-56 cells from healthy and T1D subjects were cultured with RPMI-1640 medium supplemented with 5% serum autologous in the presence of anti-CD3 plus anti-CD28 microbeads (0.1 bead/cell) (Gibco, Thermo Fisher Scientific). After 48 hours supernatant were collected and stored at -20° C until use. Cytokine production was analyzed using the bead-based multianalyte immunoassay (Invitrogen, Thermo Fisher Scientific) according to the manufacturer’s recommendations, and then was measured by Multiplex technology (Luminex 200, Luminex). xPONENT 3.1 software (Luminex) was used for data acquisition.
Statistical analysis
Modelling and statistical analyses of data were carried by JMP Statistical Discovery software 6.0.3 (SAS, North Carolina, USA), and GraphPad Prism 7 software (GraphPad, California, USA). Comparisons were performed by Mann-Whitney U-test, Student’s t-test, one-way ANOVA and two-way ANOVA-corrected for multiple comparison using Bonferroni test and Wilcoxon matched pairs test as indicated. Correlation analyses were performed by Pearson's correlation. A linear model was used for the adjustment of the comparison for sex, age and BMI variables. To identify outliers, ROUT (Q=0.1%) method has been applied.
For all analyses, we used two-tailed tests, with p<0.05 values denoting statistical significance. A univariate logistic regression modeling was fitted to predict DKA at T1D diagnosis as described: T1D subjects were dichotomized on the basis of the presence (Yes) or absence (No) of DKA at disease diagnosis. Prognostic validity of the fitted models was evaluated by receiver operating characteristic (ROC) curve analysis and measured using the area under the ROC curve (AUC). The black line represents the ROC curve that derives from sensitivity (the probability that X value is true positive) versus 1-specificity (the probability that X value is false positive). The yellow line indicates the optimal combination of sensitivity and specificity according to the Youden criterion. The optimal combination between sensitivity and specificity is represented by the interception between the ROC curve and the yellow line.
Extended Data
Extended Data Fig. 1. TR3-56 cell enumeration predicts residual β-cell function and DKA in pre-puberty T1D subjects at disease onset.

a, Box plots indicate the percentage (left) and absolute number (right) of circulating TR3-56 cells in pre-puberty T1D subjects at disease onset from Italian cohort compared with healthy subjects, after adjustment for age, sex and BMI. Data are presented as box plots (min, max, median, and 25th and 75th percentiles), each dot represents a individual subjects (n=86 healthy subjects; n=128 T1D for percentage of TR3-56 cells and n=126 T1D for absolute number of TR3-56 cells). *p<0.0001 by two-tailed Mann-Whitney U-test. b, Box plots indicate the percentage of necrotic (left) and apoptotic (right) rate of circulating TR3-56 cells in healthy subjects (n=47) and T1D children at disease onset (n=82) from Italian cohort. Data are presented as box plots (min, max, median, and 25th and 75th percentiles), each dot represents a individual subjects. *p<0.0001 by two-tailed Mann-Whitney U-test. c, Left, logistic regression modeling shows that percentage of TR3-56 cells predicts the presence or absence of DKA in pre-puberty T1D subjects at diagnosis (n=128) from Italian cohort. T1D subjects were dichotomized on the basis of the presence (Yes) or absence (No) of DKA at disease diagnosis. Low numbers of TR3-56 cells at diagnosis associated with presence of DKA. Right, ROC curve of the model-based prognostic scores of TR3-56 cells for the presence of DKA. AUC=0.72. d, Left, logistic regression modeling shows that absolute number of TR3-56 cell counts predicts the presence or absence of DKA in pre-puberty T1D subjects at diagnosis (n=126) from Italian cohort. Right, ROC curve of the model-based prognostic scores of TR3-56 cells for the presence of DKA. AUC=0.67. e, Left, logistic regression modeling shows that percentage of circulating TR3-56 cells predicts the presence or absence of DKA in post-puberty young adults T1D (n=19) from Italian cohort. Right, ROC curve of the model-based prognostic scores of TR3-56 cells for the presence of DKA. AUC=0.88. f, Left, logistic regression modeling shows that absolute number of TR3-56 cells predicts presence of DKA in post-puberty young adults T1D (n=18) from Italian cohort. Right, ROC curve of the model-based prognostic scores of TR3-56 cells for the presence of DKA. AUC=0.81.
Extended Data Fig. 2. TR3-56 cells in T1D subjects with other autoimmune diseases.

a, Left, logistic regression modeling shows that percentage of TR3-56 cells predicts the presence or absence of DKA in children (n=23) that developed after diagnosis of T1D another autoimmune conditions (CD or AIT). T1D subjects were dichotomized on the basis of the presence (Yes) or absence (No) of DKA at disease diagnosis. Right, ROC curve of the model-based prognostic scores of TR3-56 cells for the presence of DKA. AUC=0.87. b, Left, logistic regression modeling shows that peripheral frequency of TR3-56 cells associated with presence of DKA in children (n=21) that at T1D diagnosis are already affected by other autoimmune conditions. Right, ROC curve of the model-based prognostic scores of TR3-56 cells for the presence of DKA. AUC=0.67.
Extended Data Fig. 3. Correlation between TR3-56 cells and fasting C-peptide in the absence of outliers.

a, Scatter plot showing statistical correlation between frequency of TR3-56 cells and fasting C-peptide in the absence of TR3-56 cell outliers (n=5) in pre-puberty T1D subjects (n=123) at disease onset from Italian cohort. Red line indicates regression line and shading indicates confidence interval. r=0.52, p<0.0001 by two-tailed Pearson’s correlation. b, Scatter plot showing statistical correlation between absolute numbers of TR3-56 cells and C-peptide in the absence of TR3-56 cell outliers (n=7) in pre-puberty T1D subjects (n=119) at disease onset from Italian cohort. Red line indicates regression line and shading indicates confidence interval. r=0.31, p=0.0007 by two-tailed Pearson’s correlation. c, Scatter plot showing positive correlation between the frequency of circulating TR3-56 cells and serum levels of fasting C-peptide in absence of TR3-56 outliers (n=4) in Swedish cohort of T1D children (n=32) at disease onset; Red line indicates regression line and shading indicates confidence interval. r=0.72, p<0.0001 by two-tailed Pearson's correlation. To identify outliers ROUT (Q=0.1%) method has been applied.
Extended Data Fig. 4. TR3-56 cells suppress CD107a/LAMP-1 and IFN-γ in both autologous and allogeneic conditions, require cell-to-cell contact and is independent from CD56 molecules.

a, Representative flow cytometry histograms showing CD107a/LAMP-1 and IFN-γ staining of CTLs after 4 hours of culture with anti-CD3 plus anti-CD28 microbeads alone (grey), in the presence of autologous or allogeneic TR3-56 cells (blue) as indicated. Dotted lines indicate unstimulated CTLs. Numbers indicate percentage of positive cells. Data are from one representative experiment out of four. b, Representative flow cytometry histograms showing CD107a/LAMP-1 and IFN-γ staining of CTLs cultured for 4 hours with anti-CD3 plus anti-CD28 microbeads alone (grey), in the presence of TR3-56 cells or when TR3-56 cells were separated by transwell (TW) plate system (as indicated). Dotted lines indicate unstimulated CTLs. Numbers indicate percentage of positive cells. Data are from one representative experiment out of six. c, Representative flow cytometry histograms showing CD107a/LAMP-1 and IFN-γ staining of CTLs after 4 hours of culture with anti-CD3 plus anti-CD28 microbeads alone (grey), or in the presence of TR3-56 cells (blue), either in the presence of the control 345.134 IgG2a or the anti-CD56 neutralizing mAb, as indicated. Dotted lines indicate unstimulated CTLs. Numbers indicate percentage of positive cells. Data are from one representative experiment out of three.
Extended Data Fig. 5. Menadione pre-treated CTLs are resistant to TR3-56 cell suppressive activity.

CD107a/LAMP-1 and IFN-γ staining of CTLs cultured for 4 hours in the presence or absence of anti-CD3 plus anti-CD28 microbeads alone or in the presence of TR3-56 cells; light blue lines indicate CTLs pre-treated for 15 minutes with 0.05 mM menadione. Dotted lines indicate unstimulated cells. Numbers indicate percentage of positive cells. Data are from one representative experiment out of six.
Extended Data Fig. 6. Phenotype of peripheral TR3-56 cells in healthy and T1D subjects.

a,Representative flow-cytometry plots showing the gating strategy used to evaluate the expression of CD4 and CD8 on TR3-56 cells (upper panels) and the frequency of invariant (i)NKT cells, evaluated by Vα24 expression and CD1d tetramers loaded with a-Galactosyl ceramide (CD1d-aGal) binding on TR3-56 lymphocytes (lower panels) on both healthy and T1D at-onset subjects, as indicated. Numbers in plots indicate percent of positive cells. b, Column bar showing the TCR Vβ family expression in TR3-56 cells from healthy subjects (yellow) and T1D children (turquoise) at diagnosis, as indicated. Data are from n=5 healthy subjects and n=3 T1D subjects. Data are expressed as mean ± SEM. No statistical significance differences are identified by two-way ANOVA-corrected for multiple comparison using Bonferroni test (p >0.9999).
Extended Data Fig. 7. Hypothetic model showing the regulatory function of TR3-56 cells and β-cell integrity in healthy and autoimmune conditions.

In healthy subjects, normal number and suppressive function of TR3-56 cells control self-reactive CD8+ T cells (green), possible contributing to maintenance of immune self-tolerance and insulin production by live β-islet cells (red). Right, in autoimmune T1D, a lower frequency and a reduced functional capacity of TR3-56 cells correlated with reduced β-cell mass, reduced serum levels of C-peptide and progressive lost of immunological self-tolerance. The schematic model was prepared using the Motifolio Scientific Illustration Toolkit.
Supplementary Material
Acknowledgements
We thank M. Montagna and all members of the IEOS-CNR for technical support. M. Carrara and F. Marabita for assistance in transcriptomic analysis. This paper was supported by grants from the Juvenile Diabetes Research Foundation (JDRF n. 2-SRA-2018-479-S-B to M.G.; JDRF n. 1-SRA-2018-477-S-B to P.d.C); the European Foundation for the Study of Diabetes (EFSD/JDRF/Lilly Programme 2016 to M.G.); the National Multiple Sclerosis Society (NMSS n. PP-1804-30725 to M.G.); Fondazione Italiana Sclerosi Multipla (FISM n. 2016/R/18 to G.M.; FISM n. 2018/R/4 to V.D.R.); by Ministero della Salute (n. GR-2016-02363725 to V.D.R); Università degli Studi di Napoli “Federico II” (STAR Program Linea 1 - 2018 to V.D.R.); European Research Council Grant (ERC "menTORingTregs" n. 310496 to G.M.); Telethon (n. GGP 17086 to G.M.); Italian Ministry of Health Giovani Ricercatori (n. GR-2016-02363749 to C.Pr.).
Footnotes
Data availability
The data that support the findings of this study are available from the corresponding authors upon request. Transcriptional data of TR3-56, NK, CD3+CD56-, CD8+ cells from adult healthy subjects are in the GEO database with accession code GSE106082. Transcriptional data of TR3-56 cells from T1D and healthy children are in the GEO database with accession code GSE134916.
Authors Contributions
S.B., V.R. and M.S. performed most of the experiments and data analyses; A.T.P., A.G., C.L.R. and S.D.S. performed the experiments and data analyses; F.P. and S.B. performed flow cytometry experiments and data analyses; S.B., V.R., M.S., G.T., G.R., A.Po., V.D.R. and C.Pr. and M.G. analysed the data and interpreted the results; A.Pu. and P.d.C. analysed transcriptional data; V.D.R., A.Po. and C.Pr. were involved in the discussion about the data; J.L., C.Po., V.F., E.M., R.T. and A.F. provided human samples from the patients and were involved in discussion about the data; P.d.C., G.T., G.R., J.L., G.M. and M.G. designed the study and wrote the manuscript.
Competing Financial Interests
The authors declare no competing financial interests.
Reporting Summary
Further information on research design is available in the Nature Research Reporting Summary linked to this article.
References
- 1.Liblau RS, Wong FS, Mars LT, Santamaria P. Autoreactive CD8 T cells in organ-specific autoimmunity: emerging targets for therapeutic intervention. Immunity. 2002;17:1–6. doi: 10.1016/s1074-7613(02)00338-2. [DOI] [PubMed] [Google Scholar]
- 2.Coppieters KT, et al. Demonstration of islet-autoreactive CD8 T cells in insulitic lesions from recent onset and long-term type 1 diabetes patients. J Exp Med. 2012;209:51–60. doi: 10.1084/jem.20111187. [DOI] [PMC free article] [PubMed] [Google Scholar]
- 3.Culina S, et al. CD8(+) T cell frequencies in the pancreas, but not in blood, distinguish type 1 diabetic patients from healthy donors. Sci Immunol. 2018;3 doi: 10.1126/sciimmunol.aao4013. [DOI] [PMC free article] [PubMed] [Google Scholar]
- 4.Schmidt RE, Murray C, Daley JF, Schlossman SF, Ritz J. A subset of natural killer cells in peripheral blood displays a mature T cell phenotype. J Exp Med. 1986;1:351–356. doi: 10.1084/jem.164.1.351. [DOI] [PMC free article] [PubMed] [Google Scholar]
- 5.Zhou J, et al. High circulating CD3+CD56+CD16+ natural killer-like T cell levels predict a better IVF treatment outcome. J Reprod Immunol. 2013;97:197–203. doi: 10.1016/j.jri.2012.12.006. [DOI] [PubMed] [Google Scholar]
- 6.Diao H, et al. A possible role for NKT-like cells in patients with chronic hepatitis B during telbivudine treatment. Immunol Lett. 2014;160:65–71. doi: 10.1016/j.imlet.2014.03.013. [DOI] [PubMed] [Google Scholar]
- 7.Galgani M, et al. Meta-immunological profiling of children with type 1 diabetes identifies new biomarkers to monitor disease progression. Diabetes. 2013;62:2481–2491. doi: 10.2337/db12-1273. [DOI] [PMC free article] [PubMed] [Google Scholar]
- 8.Atkinson MA, et al. How does type 1 diabetes develop?: the notion of homicide or β-cell suicide revisited. Diabetes. 2011;60:1370–1379. doi: 10.2337/db10-1797. [DOI] [PMC free article] [PubMed] [Google Scholar]
- 9.Beato-Víbora PI, Tormo-García MÁ. Glycemic control and insulin requirements in type 1 diabetic patients depending on the clinical characteristics at diabetes onset. Endocr Res. 2014;39:86–90. doi: 10.3109/07435800.2013.840651. [DOI] [PubMed] [Google Scholar]
- 10.Pipkin ME, et al. Interleukin-2 and inflammation induce distinct transcriptional programs that promote the differentiation of effector cytolytic T cells. Immunity. 2010;32:79–90. doi: 10.1016/j.immuni.2009.11.012. [DOI] [PMC free article] [PubMed] [Google Scholar]
- 11.Kalia V, et al. Prolonged interleukin-2Ralpha expression on virus-specific CD8+ T cells favors terminal-effector differentiation in vivo. Immunity. 2010;32:91–103. doi: 10.1016/j.immuni.2009.11.010. [DOI] [PubMed] [Google Scholar]
- 12.Alter G, Malenfant JM, Altfeld M. CD107a as a functional marker for the identification of natural killer cell activity. J Immunol Methods. 2004;294:15–22. doi: 10.1016/j.jim.2004.08.008. [DOI] [PubMed] [Google Scholar]
- 13.Wagner JA, et al. CD56bright NK cells exhibit potent antitumor responses following IL-15 priming. J Clin Invest. 2017;127:4042–4058. doi: 10.1172/JCI90387. [DOI] [PMC free article] [PubMed] [Google Scholar]
- 14.Yi JS, Holbrook BC, Michalek RD, Laniewski NG, Grayson JM. Electron transport complex I is required for CD8+ T cell function. J Immunol. 2006;177:852–862. doi: 10.4049/jimmunol.177.2.852. [DOI] [PubMed] [Google Scholar]
- 15.Bai A, et al. NADH oxidase-dependent CD39 expression by CD8(+) T cells modulates interferon gamma responses via generation of adenosine. Nat Commun. 2015;9 doi: 10.1038/ncomms9819. 8819. [DOI] [PMC free article] [PubMed] [Google Scholar]
- 16.Nazarewicz RR, Bikineyeva A, Dikalov SI. Rapid and specific measurements of superoxide using fluorescence spectroscopy. J Biomol Screen. 2013;18:498–503. doi: 10.1177/1087057112468765. [DOI] [PMC free article] [PubMed] [Google Scholar]
- 17.Criddle DN, et al. Menadione-induced reactive oxygen species generation via redox cycling promotes apoptosis of murine pancreatic acinar cells. J Biol Chem. 2006;281:40485–40492. doi: 10.1074/jbc.M607704200. [DOI] [PubMed] [Google Scholar]
- 18.Terrazzano G, et al. T cell activation induces CuZn superoxide dismutase (SOD)-1 intracellular re-localization, production and secretion. Biochim Biophys Acta. 2014;1843:265–274. doi: 10.1016/j.bbamcr.2013.10.020. [DOI] [PubMed] [Google Scholar]
- 19.Wicker LS, et al. Type 1 diabetes genes and pathways shared by humans and NOD mice. J Autoimmun. 2005;25:29–33. doi: 10.1016/j.jaut.2005.09.009. [DOI] [PubMed] [Google Scholar]
- 20.Roep BO. The role of T-cells in the pathogenesis of Type 1 diabetes: from cause to cure. Diabetologia. 2003;46:305–321. doi: 10.1007/s00125-003-1089-5. [DOI] [PubMed] [Google Scholar]
- 21.Dirice E, et al. Increased β-cell proliferation before immune cell invasion prevents progression of type 1 diabetes. Nat Metab. 2019;1:509–518. doi: 10.1038/s42255-019-0061-8. [DOI] [PMC free article] [PubMed] [Google Scholar]
- 22.Pugliese A. Autoreactive T cells in type 1 diabetes. J Clin Invest. 2017;127:2881–2891. doi: 10.1172/JCI94549. [DOI] [PMC free article] [PubMed] [Google Scholar]
- 23.Pinkse GG, et al. Autoreactive CD8 T cells associated with beta cell destruction in type 1 diabetes. Proc Natl Acad Sci USA. 2005;102:18425–1830. doi: 10.1073/pnas.0508621102. [DOI] [PMC free article] [PubMed] [Google Scholar]
- 24.Sivori S, et al. Human NK cells: surface receptors, inhibitory checkpoints, and translational applications. Cell Mol Immunol. 2019;16:430–441. doi: 10.1038/s41423-019-0206-4. [DOI] [PMC free article] [PubMed] [Google Scholar]
- 25.Tan TG, Mathis D, Benoist C. Singular role for T-BET+CXCR3+ regulatory T cells in protection from autoimmune diabetes. Proc Natl Acad Sci USA. 2016;113:14103–14108. doi: 10.1073/pnas.1616710113. [DOI] [PMC free article] [PubMed] [Google Scholar]
- 26.van Halteren AG, Kardol MJ, Mulder A, Roep BO. Homing of human autoreactive T cells into pancreatic tissue of NOD-scid mice. Diabetologia. 2005;48:75–82. doi: 10.1007/s00125-004-1613-2. [DOI] [PubMed] [Google Scholar]
- 27.Shan Z, Xu B, Mikulowska-Mennis A, Michie SA. CCR7 directs the recruitment of T cells into inflamed pancreatic islets of nonobese diabetic (NOD) mice. Immunol Res. 2014;58:351–357. doi: 10.1007/s12026-014-8500-9. [DOI] [PubMed] [Google Scholar]
- 28.Rudensky AY. Regulatory T cells and Foxp3. Immunol Rev. 2011;241:260–268. doi: 10.1111/j.1600-065X.2011.01018.x. [DOI] [PMC free article] [PubMed] [Google Scholar]
- 29.Godfrey DI, Kronenberg M. Going both ways: immune regulation via CD1d-dependent NKT cells. J Clin Invest. 2004;114:1379–1388. doi: 10.1172/JCI23594. [DOI] [PMC free article] [PubMed] [Google Scholar]
- 30.Kuylenstierna C, et al. NKG2D performs two functions in invariant NKT cells: direct TCR-independent activation of NK-like cytolysis and co-stimulation of activation by CD1d. Eur J Immunol. 2011;41:1913–1923. doi: 10.1002/eji.200940278. [DOI] [PMC free article] [PubMed] [Google Scholar]
- 31.Wirasinha RC, et al. GPR65 inhibits experimental autoimmune encephalomyelitis through CD4(+) T cell independent mechanisms that include effects on iNKT cells. Immunol Cell Biol. 2018;96:128–136. doi: 10.1111/imcb.1031. [DOI] [PubMed] [Google Scholar]
- 32.Lin YL, Lin SC. Analysis of the CD161-expressing cell quantities and CD161 expression levels in peripheral blood natural killer and T cells of systemic lupus erythematosus patients. Clin Exp Med. 2017;17:101–109. doi: 10.1007/s10238-015-0402-1. [DOI] [PubMed] [Google Scholar]
- 33.Mingari MC, Pietra G, Moretta L. Immune Checkpoint Inhibitors: Anti-NKG2A Antibodies on Board. Trends Immunol. 2019;40:83–85. doi: 10.1016/j.it.2018.12.009. [DOI] [PubMed] [Google Scholar]
- 34.De Simone M, et al. Transcriptional Landscape of Human Tissue Lymphocytes Unveils Uniqueness of Tumor-Infiltrating T Regulatory Cells. Immunity. 2016;45:1135–1147. doi: 10.1016/j.immuni.2016.10.021. [DOI] [PMC free article] [PubMed] [Google Scholar]
- 35.Schmidleithner L, et al. Enzymatic Activity of HPGD in Treg Cells Suppresses Tconv Cells to Maintain Adipose Tissue Homeostasis and Prevent Metabolic Dysfunction. Immunity. 2019;50:1232–1248.e14. doi: 10.1016/j.immuni.2019.03.014. [DOI] [PubMed] [Google Scholar]
- 36.Craig ME, Hattersley A, Donaghue KC. Definition, epidemiology and classification of diabetes in children and adolescents. Pediatr Diabetes. 2009;12:3–12. doi: 10.1111/j.1399-5448.2009.00568.x. [DOI] [PubMed] [Google Scholar]
- 37.Report of Working Group of European Society of Paediatric Gastroenterology and Nutrition. Revised criteria for diagnosis of coeliac disease. Arch Dis Child. 1990;65:909–911. doi: 10.1136/adc.65.8.909. [DOI] [PMC free article] [PubMed] [Google Scholar]
- 38.Hanley P, Lord K, Bauer AJ. Thyroid Disorders in Children and Adolescents: A Review. JAMA Pediatr. 2016;170:1008–1019. doi: 10.1001/jamapediatrics.2016.0486. [DOI] [PubMed] [Google Scholar]
- 39.Bruzzaniti S, et al. An immunometabolic pathomechanism for chronic obstructive pulmonary disease. Proc Natl Acad Sci USA. 2019;116:15625–15634. doi: 10.1073/pnas.1906303116. [DOI] [PMC free article] [PubMed] [Google Scholar]
- 40.McGinnes K, Chapman G, Marks R, Penny R. A fluorescence NK assay using flow cytometry. J Immunol Methods. 1986;86:7–15. doi: 10.1016/0022-1759(86)90258-9. [DOI] [PubMed] [Google Scholar]
- 41.Tallerico R, et al. Human NK cells selective targeting of colon cancer-initiating cells: a role for natural cytotoxicity receptors and MHC class I molecules. J Immunol. 2013;190:2381–2390. doi: 10.4049/jimmunol.1201542. [DOI] [PubMed] [Google Scholar]
- 42.Terrazzano G, et al. Differential involvement of CD40, CD80, and major histocompatibility complex class I molecules in cytotoxicity induction and interferon-gamma production by human natural killer effectors. J Leukoc Biol. 2002;72:305–311. [PubMed] [Google Scholar]
- 43.Sabbatini M, et al. Oscillatory mTOR inhibition and Treg increase in kidney transplantation. Clin Exp Immunol. 2015;182:230–240. doi: 10.1111/cei.12669. [DOI] [PMC free article] [PubMed] [Google Scholar]
- 44.Del Fabbro C, Scalabrin S, Morgante M, Giorgi FM. An extensive evaluation of read trimming effects on Illumina NGS data analysis. PLoS One. 2013;8:e85024. doi: 10.1371/journal.pone.0085024. [DOI] [PMC free article] [PubMed] [Google Scholar]
- 45.Martin M. Cutadapt removes adapter sequences from high-throughput sequencing reads. EMBnet journal. 2011;17:10–12. [Google Scholar]
- 46.Dobin A, et al. STAR: ultrafast universal RNA-seq aligner. Bioinformatics. 2013;29:15–21. doi: 10.1093/bioinformatics/bts635. [DOI] [PMC free article] [PubMed] [Google Scholar]
- 47.Pertea M, et al. StringTie enables improved reconstruction of a transcriptome from RNA-seq reads. Nat Biotechnol. 2015;33:290–295. doi: 10.1038/nbt.3122. [DOI] [PMC free article] [PubMed] [Google Scholar]
- 48.Anders S, Pyl PT, Huber W. HTSeq--a Python framework to work with high-throughput sequencing data. Bioinformatics. 2015;31:166–169. doi: 10.1093/bioinformatics/btu638. [DOI] [PMC free article] [PubMed] [Google Scholar]
- 49.Love MI, Huber W, Anders S. Moderated estimation of fold change and dispersion for RNA-seq data with DESeq2. Genome Biol. 2014;15:550. doi: 10.1186/s13059-014-0550-8. [DOI] [PMC free article] [PubMed] [Google Scholar]
- Anders S, Huber W. Differential expression analysis for sequence count data. Genome Biol. 2010;11:R106. doi: 10.1186/gb-2010-11-10-r106. [DOI] [PMC free article] [PubMed] [Google Scholar]
Associated Data
This section collects any data citations, data availability statements, or supplementary materials included in this article.