

Abstract
Salinity causes major reductions in cultivated land area, crop productivity, and crop quality, and salt-tolerant crops have been required to sustain agriculture in salinized areas. The annual C4 crop plant Sorghum bicolor (L.) Moench is salt tolerant, with large variation among accessions. Sorghum’s salt tolerance is often evaluated during early growth, but such evaluations are weakly related to overall performance. Here, we evaluated salt tolerance of 415 sorghum accessions grown in saline soil (0, 50, 100, and 150 mM NaCl) for 3 months. Some accessions produced up to 400 g per plant of biomass and showed no growth inhibition at 50 mM NaCl. Our analysis indicated that the genetic factors that affected biomass production under 100 mM salt stress were more different from those without salt stress, comparing to the differences between those under 50 mM and 100 mM salt stress. A genome-wide association study for salt tolerance identified two single-nucleotide polymorphisms (SNPs) that were significantly associated with biomass production, only at 50 mM NaCl. Additionally, two SNPs were significantly associated with salt tolerance index as an indicator for growth response of each accession to salt stress. Our results offer candidate genetic resources and SNP markers for breeding salt-tolerant sorghum.
Keywords: sorghum, salt tolerance, natural variation, biomass, genome-wide association study
Introduction
Loss of land available for crop cultivation has become a serious problem for agricultural sustainability (Shahbaz and Ashraf 2013). Salinity, one of the most important environmental stresses, has greatly reduced the area of arable land, along with crop productivity and quality (Shahbaz and Ashraf 2013, Yamaguchi and Blumwald 2005). Using salt-tolerant crops is an important strategy to mitigate this problem (Ashraf and Foolad 2013). In addition to salinity tolerance, tolerance to heat and drought stress is required, because much of the salinized area around the world is found in hot and dry regions. In cereals, including rice and wheat, many salt-tolerant cultivars have been developed and grown in saline areas. Sorghum (Sorghum bicolor (L.) Moench), the world’s fifth-most important cereal crop, was previously characterized as moderately salt tolerant (Igartua et al. 1995, Maas 1985). Sorghum crops are attractive in agriculture, since they are C4 plants and are therefore well adapted to hot, dry environments (Paterson et al. 2009, Sanchez et al. 2002). Moreover, sorghum biomass can satisfy demands for human food, livestock feed, fiber, and renewable energy.
Sequencing of the sorghum genome (Paterson et al. 2009) can accelerate breeding to promote salt tolerance. Several collections of sorghum genetic resources have been developed, including a mini core collection of sorghum at the International Crops Research Institute for the Semi-Arid Tropics (ICRISAT; Upadhyaya et al. 2009). Among the hundreds of available sorghum accessions, it is reasonable to assume that significant variation exists in salt tolerance. Indeed, some research has revealed wide variation in sorghum’s salt tolerance at the germination and seedling stages (Bafeel 2014, Kausar et al. 2012). Although such differences showed genotype-dependent growth performance during the seedling stage, this knowledge is insufficient to reveal salt-tolerant accessions with high crop yield or biomass in saline environments, because evaluations during the early stages of crop growth are not always strongly related to the overall performance at maturity under saline conditions.
In this study, we developed a greenhouse cultivation system capable of screening a large number of accessions for salinity tolerance. Using this system, we evaluated the salt tolerance of more than 415 sorghum accessions after cultivation for 3 months to reveal the effects at maturity. Accessions that produced high biomass per plant under salt stress were selected as highly salt-tolerant elites. We evaluated genetic correlations between their salt tolerance (i.e., biomass production) at different salinities using genome-wide markers, and looked for genetic characteristics responsible for salt tolerance. To increase the genetic information for salt tolerance, we performed genome-wide association analysis to associate variations in biomass production under salt stress with genomic markers.
Materials and Methods
Sorghum accessions
We tested 415 publicly available sorghum accessions from the ICRISAT sorghum collection, NARO Genebank, and United States Department of Agriculture (Supplemental Table 1). All seeds were provided by Earthnote (Okinawa, Japan). Seeds were germinated and grown for 3 weeks in a commercial soil (Hanasaki Monogatari, Takii Seed Co., Ltd., Kyoto, Japan) in 200-cell trays in a greenhouse under natural light in Okinawa, Japan. Seeds were sown in November (2015 winter test) and April (2016 summer test).
Experimental design
We built large planters (Supplemental Fig. 1A) measuring 1350 cm × 90 cm × 30 cm in a greenhouse. Three-week-old seedlings were transplanted into Okinawa Jaagaru soil (heavy clay soil) in the planters at a spacing of 30 cm × 9 cm. We used a randomized block design for planting in all planters and in all tests independently, with one plant of each accession assigned to one plot in a planter. Three planters were used to provide three biological replications for each NaCl treatment. The locations of the planters in the greenhouse were randomly assigned (Supplemental Fig. 1B). The planters were watered once with 300 L of salt solutions (0, 50, 100, or 150 mM NaCl) before transplanting, and then with 150 L each by means of drip irrigation at 2-day intervals (i.e., one application after 3 days). We dissolved a soluble fertilizer (Peters Professional 20-20-20; Everris NA Inc., Dublin, OH, USA) in the water at 0.3 g L–1. After cultivation for 15 days in 2015 and 30 days in 2016, we began the NaCl treatments. NaCl was added to the irrigation water at 50, 100, or 150 mM, but the volume and irrigation frequency were constant throughout the cultivation period. In total, 3 of the 12 planters were used for each NaCl treatment. Shoot fresh weight (biomass) per plant was measured after 3 months (89 to 90 days), and “NA” (not analyzed) was given to dead plants. Saline soil is defined as soil containing a high level of salts, with an electrical conductivity of ECe ≥4 dS m–1 (Munns 2005); this is equivalent to 40 mM NaCl. This means that the three salinity levels in our study cover a range from high to severe salt stress. The temperature in the greenhouse ranged in 12.7 to 44.1°C with a mean value of 23.4°C during cultivation in the 2015 test and 15.9 to 46.0°C with a mean value of 28.3°C in the 2016 test.
Conversion of the biomass data to Z-scores
We converted the mean biomass data (x) for each accession in the three replicates to Z-scores using the mean and standard deviation (SD) for all sorghum accessions in each treatment. Z-score is calculated as follows:
The means and SDs used were calculated only for accessions in which all three replicates were alive in both the 2015 winter and 2016 summer tests. Accessions with a Z-score of >1.64 were identified as salt-tolerant elites.
Genotyping
We generated a double-digest restriction site–associated DNA sequencing (RAD-seq) library (Baird et al. 2008) by means of BglII and MseI digestion of genomic DNA. RAD-seq was performed on an Illumina HiSeq 2000 sequencer (Illumina, Inc., San Diego, CA, USA) with 100-bp single-end reads. Adapter trimming and quality filtering were performed as described previously (Ohyanagi et al. 2015). The preprocessed reads were aligned with the reference genome sequences in Sbicolor-v3.1 (McCormick et al. 2018), which is available from Phytozome (phytozome.jgi.doe.gov), using the Burrows–Wheeler Aligner with default options (Li 2013). Aligned reads were locally realigned with the Genome Analysis Toolkit (GATK v. 3.5.0) IndelRealigner tool (McKenna et al. 2010). We used GATK UnifiedGenotyper (https://software.broadinstitute.org/gatk/documentation/tooldocs/3.8-0/org_broadinstitute_gatk_tools_walkers_genotyper_UnifiedGenotyper.php) to identify single-nucleotide polymorphisms (SNPs), with default parameter values. We used VCFtools v. 0.1.13 (Danecek et al. 2011) to identify variant sites, passing those with the parameters set at mapping quality >20, depth (3 to 100), max-missing >0.2, and MAF = 0.025. We developed a reference panel using whole-genome sequencing and used it to predict the sequences of used accessions. We used the BEAGLE v. 4.0 (Browning and Browning 2007) server to impute any missing SNPs. In total, we obtained data for more than 75 000 SNP markers for the 383 accessions. The accessions that were genotyped in our study are indicated in Supplemental Table 1.
Genetic analysis for sorghum biomass
Genetic correlations were estimated by fitting a multi-environment mixed model (Burgueño et al. 2012) to our biomass data. Let P be the number of environments (we treated each combination of salinity (0, 50, 100 mM NaCl) and year as one environment, thus P = 6), and N be the number of genotypes. The phenotypic values (averaged over the three replicates) can be represented as an N × P matrix Y, and we can develop similar matrices for genotypic values (U) and residuals (E). We also represented the environmental effects as a P-dimensional vector (β). The multi-environment mixed model can then be represented as:
| (1) |
| (2) |
| (3) |
where T represents the transposed vector; represents Kronecker product; up and ep are the p-th columns of U and E, respectively; 0 and 1 are vectors whose elements are all 0 and 1, respectively; IN is an N-dimensional identity matrix; and G is the additive relationship matrix among the genotypes. We calculated the G matrix by using the shrinkage estimation method proposed in (Endelman and Jannink 2012). Unknown parameters in this model are β, Vg, and Ve. The two V matrices are P × P variance–covariance matrices for the relationships among the environments; the former represents covariance of genotypic values, and the latter represents covariance of environmental effects among the environments. Because Vg is the variance–covariance matrix for genotypic values among the different environments, genetic correlations can be obtained from its values. The values of these unknown parameters can be estimated from the data by using the EMMREML v. 3.1 package for R statistical software (Akdemir and Godfrey 2015). Note that we removed genotypes with missing values (i.e., one or more dead plants) to fill in the Y matrix and also removed genotypes whose marker genotype was unknown. In total, we used 302 genotypes for fitting the model (Supplemental Table 1).
Genome-wide association analysis
We used the QK model (Yu et al. 2006) for the genome-wide association study (GWAS). We used the ADMIXTURE v. 1.30 clustering algorithm to investigate the population structure (Alexander et al. 2009) of the 391 accessions. ADMIXTURE identifies K genetic clusters, where K is specified by the user, from the provided SNP data. For each individual, ADMIXTURE estimates the probability of membership in each cluster. In our analysis, we used values of K ranging from 1 to 10. The smallest value of the cross-validation error was used in evaluating the most probable number of subpopulations among the accessions. In our data, this error reached its minimum when K = 9, so we applied K = 9 to the GWAS. GWAS was performed using a mixed linear model with a Q matrix and a K matrix as corrections for the population structure (QK model) (Yu et al. 2006). The number of SNPs used in the GWAS ranged from 76 535 to 77 476 (MAF > 0.025), depending on the accessions whose data were used for the GWAS. The genome-wide Bonferroni-corrected significance threshold for the GWAS was set to –log10P > 6.18 to 6.19 (with significance at p < 0.05 for n = 76 535 to 77 476) in this study. Genetic values for phenotypic data of each genotype were calculated in the ANOVA model described below and applied to GWAS.
where is the phenotypic value of biomass production for the ith accession in the kth block (replicate) within the jth year, μ is the intercept of the model, is the genetic value of the ith accession, is the effect of the jth year, is the effect of the kth block (replicate), and is the residual error.
Results
Variation of shoot biomass among the sorghum accessions
We grew plants in winter 2015 and summer 2016, with a total of 415 sorghum inbred accessions (338 used in both seasons). At 150 mM NaCl, approximately 70% of transplanted plants died in both tests, and as a result, most of the accessions lacked biological replication under severe salt stress (data not shown). Because it seems likely that 150 mM NaCl was too high to evaluate the variation of salt tolerance among our accessions, we did not analyze the biomass data from this treatment. Our obtained biomass data (e.g. fresh weight) of all cultivated accessions is shown in Supplemental Table 1.
At 50 and 100 mM NaCl, 94–99% of accessions survived compare to the control conditions, so we included those data in our analysis. There was wide variation in biomass production among the accessions (Fig. 1A, Table 1). In the control, the biomass per plant ranged from 10 g to 224 g, with a median value of 61 g in the winter test and ranged from 12 g to 387 g, with a median of 92 g, in the summer test. At 50 mM NaCl, the biomass ranged from 3 g to 175 g, with a median of 31 g, in the winter and ranged from 5 g to 395 g, with a median of 69 g, in the summer. At 100 mM NaCl, the biomass ranged from 1 g to 74 g, with a median value of 14 g, in the winter and ranged from 2 g to 324 g, with a median value of 22 g, in the summer. In both seasons, biomass decreased with increasing NaCl concentration. The correlations between the winter and summer biomass of the accessions were significantly positive in the control (r = 0.66, p < 0.001; Fig. 1B) and at 50 and 100 mM NaCl (r = 0.53 and 0.43, respectively; p < 0.001; Fig. 1B). Therefore, our data could be used to evaluate genotypic performance for biomass production. The ANOVA results (Table 2) showed significant effects (p < 0.05) for genotype, season, and replication at all salinity levels. This means that the phenotypic value (biomass) was affected not only by genetic differences, but also by experimental conditions such as season and replication. Thus, we should remove such effects before performing the GWAS.
Fig. 1.
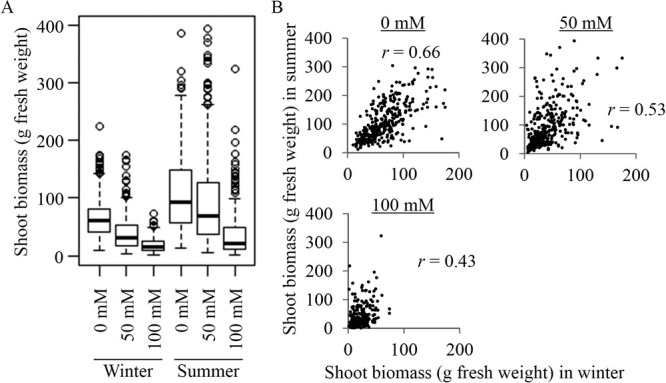
Shoot biomass production (fresh weight) of the sorghum accessions in the winter and summer cultivation tests. (A) Box plot of the distribution of biomass of the sorghum accessions under the three NaCl concentrations (Survival at 150 mM NaCl was low, so that treatment was excluded from the analysis). Thick horizontal lines represent the median value, boxes represent the 25th to the 75th percentiles, whiskers represent the 95% confidence interval, and circles represent outliers. (B) Scatterplots of the relationships between shoot biomass (g fresh weight) of the genotypes in the winter and summer cultivation tests.
Table 1.
Maximum, minimum, and median shoot biomass production in the winter and summer cultivation trials
| NaCl treatment | Cultivation test | ||||||
|---|---|---|---|---|---|---|---|
| 2015 winter | 2016 summer | ||||||
| 0 mM | 50 mM | 100 mM | 0 mM | 50 mM | 100 mM | ||
| No. of accessions | 371 | 370 | 358 | 382 | 382 | 379 | |
| Shoot fresh weight (g)a | |||||||
| Maximum | 224 | 175 | 74 | 387 | 395 | 324 | |
| Minimum | 10 | 3 | 1 | 12 | 5 | 2 | |
| Median | 61 | 31 | 14 | 92 | 69 | 22 | |
a The fresh weights represent the means of 1 to 3 replicates for each accession.
Table 2.
ANOVA results for biomass production of the sorghum accessions in the three NaCl treatments (Survival at 150 mM NaCl was low, so that treatment was excluded from the analysis)
| NaCl treatment | Source | Df | Sum Sq | Mean Sq | F value | P value |
|---|---|---|---|---|---|---|
| 0 mM | ||||||
| Genotype | 414 | 5104998 | 12331 | 6.2844 | <0.0001 | |
| Season | 1 | 883504 | 883504 | 450.2763 | <0.0001 | |
| Replication | 2 | 200449 | 100225 | 51.0793 | <0.0001 | |
| Residuals | 1826 | 3582865 | 1962 | |||
| 50 mM | ||||||
| Genotype | 414 | 5712310 | 13798 | 5.4834 | <0.0001 | |
| Season | 1 | 1260796 | 1260796 | 501.0544 | <0.0001 | |
| Replication | 2 | 18477 | 9238 | 3.6714 | 0.02564 | |
| Residuals | 1679 | 4224844 | 2516 | |||
| 100 mM | ||||||
| Genotype | 412 | 1022569 | 2482 | 2.9277 | <0.0001 | |
| Season | 1 | 103350 | 103350 | 121.9125 | <0.0001 | |
| Replication | 2 | 19046 | 9523 | 11.2336 | <0.0001 | |
| Residuals | 1206 | 1022376 | 848 |
Df, degrees of freedom; Sq, squares.
Selection of high-biomass accessions under salt treatments
To identify elite accessions with significantly higher biomass, we used Z-scores calculated from the biomass of each line (Fig. 2A). Since a Z-score of >1.64 means a significantly higher parameter value (p < 0.05 for a 1-sided test), we defined accessions that met this criterion in both the winter and summer tests as elite lines. Accessions for which at least 1 of the 3 plants survived in both the winter and summer tests totaled 337 at 50 mM NaCl and 324 at 100 mM; we identified elite accessions from within these populations. We identified 7 accessions that produced significantly higher biomass at 50 mM NaCl and 4 at 100 mM NaCl, 2 of them at both salinities (Fig. 2B), totaling 9 salt-tolerant elite accessions: IS11026, 87-9-21-3-1, IS26025, KOUCHI OUKAWA ZAIRAI, IS11473, IS8267, LIAOZA 1, IS23579, and FETERITA HARIG 2. From the control data, we also selected accessions with significantly higher biomass. Among the 338 accessions that were tested in both winter and summer, 10 produced significantly higher biomass (Fig. 2B). These were NYIRARUMOGO, SOR 1, IS5667, IS6421, IS24939, IS11026, 87-9-21-3-1, IS26025, KOUCHI OUKAWA ZAIRAI, IS11473. These 10 accessions only included 5 of the 9 salt-tolerant elites, but the other 4 (IS8267, LIAOZA 1, IS23579, and FETERITA HARIG 2) showed significantly higher growth only under the salt treatments. These results suggest that the degree of growth inhibition caused by salinity varied greatly among the accessions. Some of the elite accessions had biomass in NaCl treatments that was similar to or higher than that in the control (Fig. 3). IS11026, IS23579, IS8267, and Feterita harig 2 showed no growth inhibition at 50 mM NaCl compared with the control in both tests. These accessions may therefore be candidate resources to breed salt-tolerant sorghum.
Fig. 2.
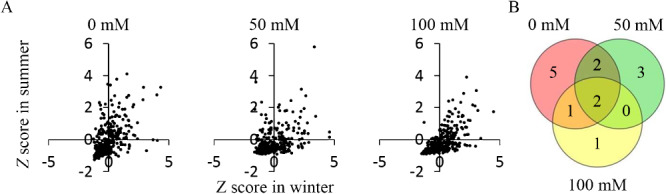
Selection of accessions that produced high shoot biomass under the NaCl treatments. Elite sorghum accessions were selected from the biomass data obtained in the winter and summer cultivation tests. (A) Scatterplots of the relationships between the Z-scores for the biomass in the two cultivation tests. (B) Venn diagram of the relationship among the numbers of accessions that produced high biomass in the three salt treatments (Survival at 150 mM NaCl was low, so that treatment was excluded from the analysis). Accessions with significantly higher biomass had Z > 1.64 (equivalent to p < 0.05, 1-sided test) in both the winter and summer tests.
Fig. 3.
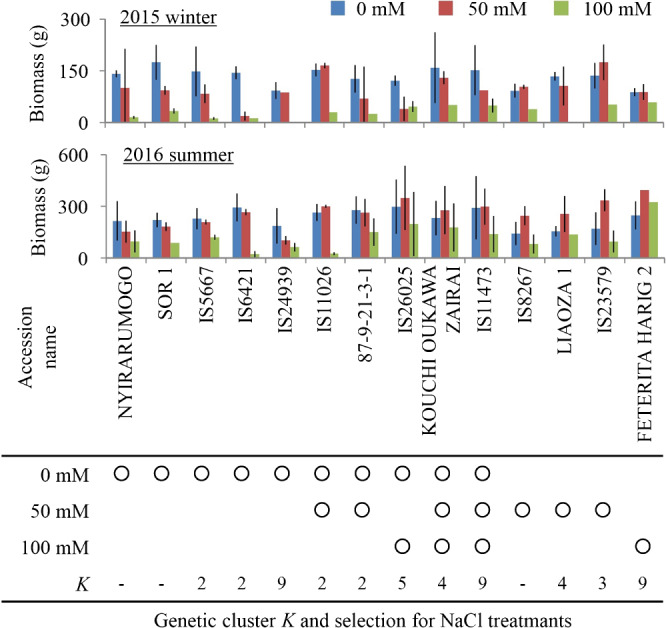
Shoot biomass of the elite accessions that produced significantly higher biomass under the NaCl treatments. Circles in the rows below the table indicate elites that produced significantly higher biomass under the indicated salinity level. K in the table indicates subpopulation IDs, where the elite accessions belong, identified by ADMIXTURE clustering algorithm. Values are means ± SDs (n = 1–3).
Genetic analysis of salt tolerance
Genetic and statistical analyses support a discussion of sorghum’s salt tolerance. We estimated the genetic correlations for biomass production among the three salt treatments and between the two seasons, using data from 302 accessions. The estimated genetic correlations between the control (0 mM) and severe salinity (100 mM) were 0.34 to 0.67, and were weaker than those between the two salt treatments (50 vs. 100 mM), at 0.41 to 0.90 (Table 3). Surprisingly, although the growth of plants differed greatly between the two seasons (Fig. 1A, Table 1), the genetic correlations with biomass for the same salt stresses in different seasons were relatively high, ranging from 0.60 to 0.80. These results suggest that although there are significant effects of season on biomass production (Table 2), similar genetic factors contributed to biomass production of sorghum under the same salt stress in both seasons.
Table 3.
Estimated genetic correlations for biomass production
| NaCl treatment (mM) | NaCl treatment (mM) | ||||||
|---|---|---|---|---|---|---|---|
| Winter | Summer | ||||||
| 0 | 50 | 100 | 0 | 50 | 100 | ||
| Winter | |||||||
| 0 | 0.86 | 0.67 | 0.80 | 0.67 | 0.34 | ||
| 50 | 0.90 | 0.66 | 0.60 | 0.41 | |||
| 100 | 0.63 | 0.66 | 0.71 | ||||
| Summer | |||||||
| 0 | 0.93 | 0.59 | |||||
| 50 | 0.79 | ||||||
| 100 | |||||||
Genome-wide association analysis for biomass production under salt stress
To separate the genetic performance for biomass production from the significant effects of replication and season, we estimated the genetic values of each genotype for biomass production in the ANOVA model (Table 2) and then applied this data to the GWA analysis with QK model. The SNP variants that were significantly associated with biomass production under the NaCl treatments should relate to sorghum’s salt tolerance. In the control, we found 1 SNP on chromosome 7 (SNP1 S7_25944316) that was significantly associated with biomass production (Fig. 4). At 50 mM NaCl, we found SNPs on chromosomes 2 and 5 (SNP2 S2_51947596 and SNP3 S5_22330218) that were significantly associated with biomass, but these were not significantly associated with biomass in the control (Fig. 4, –log10P = 2.01 and 4.13, respectively). Therefore, the polymorphisms at SNP2 S2_51947596 and SNP3 S5_22330218 might represent variants in salinity tolerance genes or alleles. In a comparison of biomass between the variants at these two SNPs, the minor allele groups (heterozygous reference/alternative or homozygous alternative/alternative) showed higher biomass than the major one (homozygous reference/reference) in all salinity conditions and control conditions (Supplemental Figs. 2–4). Here, “reference” refers to the same allele in the reference genome and “alternative” refers to a different allele.
Fig. 4.
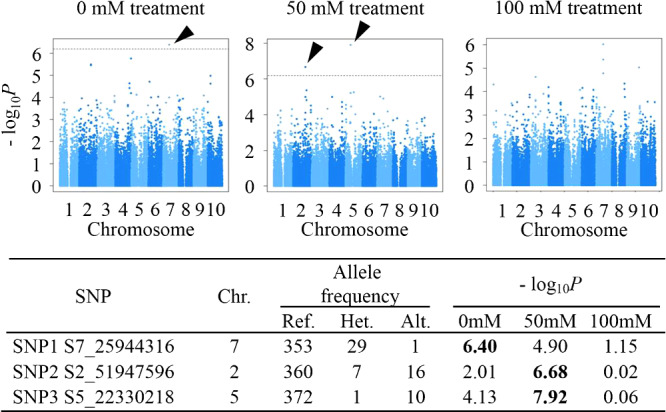
Genome-wide association study (GWAS) results for biomass production under the NaCl treatments. The genotypic values for biomass production in the ANOVA model were used for the GWAS, and the results are shown in these Manhattan plots. Dashed horizontal lines represent the threshold of the Bonferroni-corrected significance (–log10P = 6.19, p < 0.05). Arrowheads indicate the positions of single-nucleotide polymorphisms (SNPs) that were significantly associated with salinity tolerance. The marker information for these SNPs is summarized in the table below the graphs. “SNP” represents the genomic position, and Chr. represents the chromosome. Values under “Allele frequency” are the numbers of accessions in the following genotype groups for the SNPs: Ref., homozygous reference/reference; Het., heterozygous reference/alternative; and Alt., homozygous alternative/alternative types. Boldfaced values of –log10P indicate a statistically significant association with biomass production (p < 0.05).
To conduct further GWA analysis with QK model for responses of sorghum accessions to salt stress, we calculated salt tolerance index (STI50 and STI100) for 50 mM and 100 mM NaCl salt stresses for each accession, respectively, by dividing the genetic values under salt stress conditions by those under the control condition. The genetic values were estimated in the ANOVA model (Table 2) described above. Some small accessions, whose genetic values were estimated lower than 5 g under the control condition, showed higher STI50 than 3. These high values may be unreliable, and we gave 3 to these accessions with STI50 higher than 3 before GWA analysis. In the case of STI100, we also gave 3 to accessions with higher STI values than 3. As the results of GWA analysis, we found no SNP significantly associated with STI50 and two SNPs on chromosomes 1 (SNP4 S1_70003033) and 3 (SNP5 S3_388678) which were significantly associated with STI100 (Fig. 5, –log10P = 7.59 and 7.42, respectively). Actually 5 SNPs were detected on chromosome 1, and they were close to each other within 250 kb. Then, only the SNP with the highest –log10P value (SNP4 S1_70003033) was focused on.
Fig. 5.
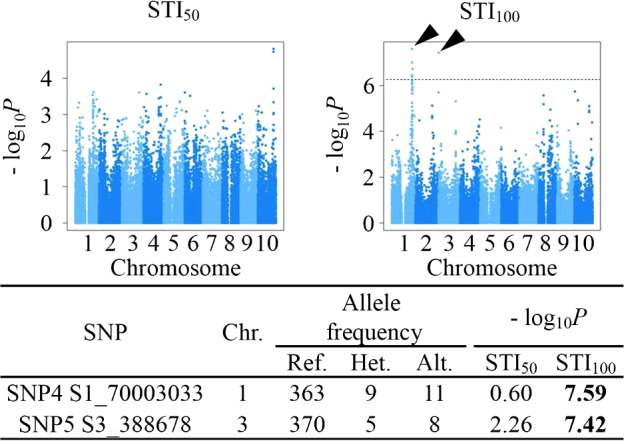
Genome-wide association study (GWAS) results for salt tolerance index. The salt tolerance index, STI50 and STI100, were calculated by dividing the genotypic values for biomass production under the 50 mM and 100 mM NaCl conditions in the ANOVA model by those under the control conditions, respectively. The GWAS results are shown in these Manhattan plots. Dashed horizontal lines represent the threshold of the Bonferroni-corrected significance (–log10P = 6.19, p < 0.05). Arrowheads indicate the positions of single-nucleotide polymorphisms (SNPs) that were significantly associated with STI. The marker information for these SNPs is summarized in the table below the graphs in the same way as Fig. 4.
Discussion
Salt tolerance can be evaluated from two aspects; (1) displaying high performance stably under any saline conditions (stability) and (2) minimizing reduction of performance caused by salinity responding to salt stress (stress response). Biomass production under salt stresses reflects the both aspects (stability + stress response). Actually, relative traits such as relative biomass under stress conditions to the control condition were used to directly evaluate the stress response (Lekklar et al. 2019, Liu et al. 2019). However, ratio of the two values is numerically unstable when the denominator includes small value. Additionally, to answer whether relative traits reflects stress tolerance, it would be required to examine whether the relative traits of accessions, which carry completely same genetic factors for stress tolerance but show different biomass under non-stress condition, are same or not. Therefore, we mainly focused on biomass production under salt stresses as salt tolerance in this study. This evaluation is suitable for practical breeding because salt-tolerant sorghum will be defined as ones to produce high biomass yields on salinity fields.
Under our study conditions, shoot biomass values reached a maximum of 395 g (Fig. 1, Table 1). This value was much larger than those between several tens of mg and g fresh weight per plant in previous reports of the salt tolerance of sorghum seedlings (Anil et al. 2016, Bafeel 2014, Kausar et al. 2012). Our data from 3-month cultivation let us detect salt-tolerant sorghum plants at maturity. We found 9 elite accessions with high salt tolerance (Figs. 2, 3). Importantly, some of them showed almost no growth inhibition at 50 mM NaCl (Fig. 3). In a previous study (Kausar et al. 2012), the salt-tolerant sorghum line with the lowest growth inhibition at 50 mM NaCl had a 16.5% decrease of shoot biomass. Of course, their experimental conditions differed from ours, but our results nonetheless suggest that 4 of our elite sorghum accessions (IS11026, IS8267, IS23579, and FETERITA HARIG 2) represent good candidate resources. Because the salt-tolerance and drought-tolerance mechanisms in plants overlap to some extent (Zhu 2002), our salt-tolerant elites might also yield more in dry fields. Our genotyped-accessions could be divided into 9 subpopulations (genetic clusters, K, see Materials and Methods), but there is no clear relationship between the salt tolerance of the elites and their subpopulations (Fig. 3).
Using the data obtained from different salinity levels and seasons, we analyzed the salt tolerance of the sorghum genotypes. We found low but significant phenotypic (biomass) correlations between the two seasons (Fig. 1C, r = 0.43 to 0.66), and the genetic correlations for a given salinity were significant but higher (r = 0.60 to 0.80; Table 3). These results suggest that our genetic analysis can estimate genetic performance for biomass production. The estimated genetic correlations for biomass production between the control (0 mM NaCl) and severe salinity (100 mM NaCl) were lower than those between the two salt treatments (50 vs. 100 mM NaCl), suggesting that in our sorghum population, the genetic factors that affect biomass production under salt stress differ to some extent from those that affect biomass in the absence of salt stress, and that the genetic factors responsible to salt tolerance at 100 mM NaCl are similar to those at 50 mM NaCl. Genetic correlations also show that the genetic factors affecting biomass production at 50 mM NaCl seem to be partly in common with those in the control as well as those at 100 mM NaCl, probably reflecting that 50 mM NaCl caused moderate stress between the control and 100 mM NaCl. Our salt-tolerant elites selected on the basis of biomass production therefore have genetic factors that increase biomass under salt stress.
Identification of SNPs associated with genetic factors that affect biomass production under salt stress should provide valuable genetic markers for use in breeding supported by marker-assisted-selection (MAS). We conducted GWA analysis for biomass production under salt stress, and identified two SNPs (SNP2 S2_51947596 and SNP3 S5_22330218, on chromosomes 2 and 5, respectively) that were significantly associated with biomass production at 50 mM NaCl, but neither in the control nor 100 mM NaCl (Fig. 4). On the other hand, the SNP effects on biomass production under all conditions seem to be similar (Supplemental Figs. 3, 4). These results mean that the SNPs are especially related to the tolerance to moderate salt stress among our sorghum population. The genetic correlation between the tolerances at 50 mM and 100 mM NaCl was not associated with the SNPs detected but would be associated with other loci of smaller effects. Among the accessions, only 10 to 16 showed salt-tolerant genotypes at the two SNPs (Supplemental Figs. 3, 4). We listed genes located within 500 kb of the SNPs using Phytozome database with annotations (Sbicolor_v3.1, http://www.phytozome.net/) as candidate causal genes for the GWAS results (Supplemental Tables 2, 3). Although it was possible that differences in maturating time among accessions influenced our evaluation of salt tolerance, the influence would be so small that genes near the SNPs detected by our GWA analysis do not contain known maturity genes. Among the candidate genes near SNP3 S5_22330218, Sobic.005G109400 and Sobic.005G109500 encode cycloartenol synthase. Cycloartenol is one of two important precursors for phytosterol biosynthesis in higher plants (Ohyama et al. 2009), and phytosterols play a role in stress tolerance (Kumar et al. 2015). Two widespread halophytes—Avicennia marina and Rhizophora stylosa, both mangrove species—increase their levels of cycloartenol synthase mRNA and phytosterol in their roots under salt stress (Basyuni et al. 2012). These previous studies suggest that cycloartenol or its phytosterol derivatives may play a role in salt tolerance of plants. Sobic.005G109400 and Sobic.005G109500 might therefore be gene candidates for salt tolerance in our sorghum population. Although their roles must be clarified, the two SNP markers we identified should be useful for MAS in a sorghum breeding program to develop salt-tolerant cultivars. Among the 8 salt-tolerant elites with genotype available, 2 accessions, 87-9-21-3-1 and LIAOZA 1, share the salt-tolerant alleles at the SNPs detected by GWA analysis (Supplemental Table 4). The other elites would have other genetic factors to cause their salt-tolerance, and the factors may be polygenic with small effects or a few causal genes with low minor allele frequencies not to be detected by our GWA analysis. Therefore, these elite accessions may be further improved for their biomass production under salt stress by MAS using our detected SNP markers. We also conducted GWA analysis for the responses toward salt stress using salt tolerance index, STI, and 2 SNPs on chromosome 1 and 3 were significantly associated with STI100 (Fig. 5). The minor alleles at these detected SNPs contributed to increase STI scores when the allele groups are homozygous alternative/alternative. These SNPs might also be useful for MAS to develop salt-tolerant cultivar (Supplemental Fig. 5). Among the 8 salt-tolerant elites with genotype available, all elites show allele groups with lower STI100 (Supplemental Table 4). To conclude the effects of the SNP4 S1_70003033 and SNP5 S3_388678, we examined the correlations between STI and genetic values under the control conditions, because some accessions with high STI50 or STI100 produced small biomass under the control condition. Then, both of STI50 and STI100 were negatively correlated with the genetic values (Supplemental Fig. S6, r = –0.20 and –0.40, respectively). This indicates a tendency where accessions showing higher STI produced smaller biomass under the control condition. Especially, negative correlation was more evident between STI100 and the genetic values under the control condition. Therefore, it is possible that in addition of salt tolerance, STI indicates smallness of biomass production. Thus, we cannot conclude the effects of SNP4 S1_70003033 and SNP5 S3_388678, which were significantly associated with STI100, on salt tolerance in sorghum.
As described above, although stability and stress response will be key factors to reveal stress tolerances in plants, discrimination of the two factors with biological traits such as relative traits remains unreliable. In order to discriminate these two factors with statistics, our used model (see Materials and Methods) can be extended to define the stability of accessions and the stress response (G × E interaction) in the model. Such an extended model might allow salt tolerance to be more suitably analyzed and therefore allow the estimation of the key factors to be more reliable. To reveal the complex nature of salt tolerance, both biological experiments and statistical approaches should be examined.
Author Contribution Statement
KYamazaki, JY, TK, HI, TK, TT, NT, and TF designed the study; KYamazaki, MI, HT, MF, JY, and RT cultivated and measured biomass data; HK-K, HT, and KYano prepared and analyzed the RAD-Seq data; KYamazaki analyzed phenotype date and GWAS with contribution from MI and HK-K; the other genetic analysis were performed by MI, HK-K, and RT. KYamazaki interpreted results and drafted the manuscript with the contributions from MI, HK-K, and RT. TT obtained funding for the study. TF supervised the study. All authors read and approved the final manuscript.
Supplementary Material
Acknowledgments
We thank the members of Earthnote Co. Ltd. for their support during our cultivation.
Literature Cited
- Akdemir, D. and O.U. Godfrey (2015) EMMREML: Fitting mixed models with known covariance structures. R package version 3.1. [Google Scholar]
- Alexander D.H., Novembre J. and Lange K. (2009) Fast model-based estimation of ancestry in unrelated individuals. Genome Res. 19: 1655–1664. [DOI] [PMC free article] [PubMed] [Google Scholar]
- Anil S., Ryan C., Yue W., Omar R., Larissa L.D., Steven D.W. and Jeffery A.D. (2016) Moisture and salt tolerance of a forage and grain sorghum hybrid during germination and establishment. J. Crop. Impro. 30: 668–683. [Google Scholar]
- Ashraf M. and Foolad M.R. (2013) Crop breeding for salt tolerance in the era of molecular markers and marker-assisted selection. Plant Breed. 132: 10–20. [Google Scholar]
- Bafeel S.O. (2014) Physiological parameters of salt tolerance during germination and seedling growth of Sorghum bicolor cultivars of the same subtropical origin. Saudi J. Biol. Sci. 21: 300–304. [DOI] [PMC free article] [PubMed] [Google Scholar]
- Baird N.A., Etter P.D., Atwood T.S., Currey M.C., Shiver A.L., Lewis Z.A., Selker E.U., Cresko W.A. and Johnson E.A. (2008) Rapid SNP discovery and genetic mapping using sequenced RAD markers. PLoS ONE 3: e3376. [DOI] [PMC free article] [PubMed] [Google Scholar]
- Basyuni M., Baba S., Kinjo Y. and Oku H. (2012) Salinity increases the triterpenoid content of a salt secretor and a non-salt secretor mangrove. Aquat. Bot. 97: 17–23. [Google Scholar]
- Browning S.R. and Browning B.L. (2007) Rapid and accurate haplotype phasing and missing-data inference for whole-genome association studies by use of localized haplotype clustering. Am. J. Hum. Genet. 81: 1084–1097. [DOI] [PMC free article] [PubMed] [Google Scholar]
- Burgueño J., de los Campos G., Weigel K. and Crossa J. (2012) Genomic prediction of breeding values when modeling genotype × environment interaction using pedigree and dense molecular markers. Crop Sci. 52: 707–719. [Google Scholar]
- Danecek P., Auton A., Abecasis G., Albers C.A., Banks E., DePristo M.A., Handsaker R.E., Lunter G., Marth G.T., Sherry S.T. et al. (2011) The variant call format and VCFtools. Bioinformatics 27: 2156–2158. [DOI] [PMC free article] [PubMed] [Google Scholar]
- Endelman J.B. and Jannink J.L. (2012) Shrinkage estimation of the realized relationship matrix. G3 (Bethesda) 2: 1405–1413. [DOI] [PMC free article] [PubMed] [Google Scholar]
- Igartua E., Gracia M.P. and Lasa J.M. (1995) Field responses of grain sorghum to a salinity gradient. Field Crops Res. 42: 15–25. [Google Scholar]
- Kausar A., Ashraf M.Y., Ali I., Niaz M. and Abbass Q. (2012) Evaluation of sorghum varieties/lines for salt tolerance using physiological indices as screening tool. Pak. J. Bot. 44: 47–52. [Google Scholar]
- Kumar M.S., Ali K., Dahuja A. and Tyagi A. (2015) Role of phytosterols in drought stress tolerance in rice. Plant Physiol. Biochem. 96: 83–89. [DOI] [PubMed] [Google Scholar]
- Lekklar C., Pongpanich M., Suriya-Arunroj D., Chinpongpanich A., Tsai H., Comai L., Chadchawan S. and Buaboocha T. (2019) Genome-wide association study for salinity tolerance at the flowering stage in a panel of rice accessions from Thailand. BMC Genomics 20: 76. [DOI] [PMC free article] [PubMed] [Google Scholar]
- Li, H. (2013) Aligning sequence reads, clone sequences and assembly contigs with BWA-MEM. arXiv; 1303.3997v2. [Google Scholar]
- Liu X.P., Hawkins C., Peel M.D. and Yu L.X. (2019) Genetic loci associated with salt tolerance in advanced breeding populations of tetraploid Alfalfa using genome-wide association studies. Plant Genome 12: 1–13. [DOI] [PubMed] [Google Scholar]
- Maas E.V. (1985) Crop tolerance to saline sprinkling water. Plant and Soil 89: 273–284. [Google Scholar]
- McCormick R.F., Truong S.K., Sreedasyam A., Jenkins J., Shu S., Sims D., Kennedy M., Amirebrahimi M., Weers B.D., McKinley B. et al. (2018) The Sorghum bicolor reference genome: improved assembly, gene annotations, a transcriptome atlas, and signatures of genome organization. Plant J. 93: 338–354. [DOI] [PubMed] [Google Scholar]
- McKenna A., Hanna M., Banks E., Sivachenko A., Cibulskis K., Kernytsky A., Garimella K., Altshuler D., Gabriel S., Daly M. et al. (2010) The Genome Analysis Toolkit: a MapReduce framework for analyzing next-generation DNA sequencing data. Genome Res. 20: 1297–1303. [DOI] [PMC free article] [PubMed] [Google Scholar]
- Munns R. (2005) Genes and salt tolerance: bringing them together. New Phytol. 167: 645–663. [DOI] [PubMed] [Google Scholar]
- Ohyama K., Suzuki M., Kikuchi J., Saito K. and Muranaka T. (2009) Dual biosynthetic pathways to phytosterol via cycloartenol and lanosterol in Arabidopsis. Proc. Natl. Acad. Sci. USA 106: 725–730. [DOI] [PMC free article] [PubMed] [Google Scholar]
- Ohyanagi H., Takano T., Terashima S., Kobayashi M., Kanno M., Morimoto K., Kanegae H., Sasaki Y., Saito M., Asano S. et al. (2015) Plant Omics Data Center: an integrated web repository for interspecies gene expression networks with NLP-based curation. Plant Cell Physiol. 56: e9. [DOI] [PMC free article] [PubMed] [Google Scholar]
- Paterson A.H., Bowers J.E., Bruggmann R., Dubchak I., Grimwood J., Gundlach H., Haberer G., Hellsten U., Mitros T., Poliakov A. et al. (2009) The Sorghum bicolor genome and the diversification of grasses. Nature 457: 551–556. [DOI] [PubMed] [Google Scholar]
- Sanchez A.C., Subudhi P.K., Rosenow D.T. and Nguyen H.T. (2002) Mapping QTLs associated with drought resistance in sorghum (Sorghum bicolor L. Moench). Plant Mol. Biol. 48: 713–726. [DOI] [PubMed] [Google Scholar]
- Shahbaz M. and Ashraf M. (2013) Improving salinity tolerance in cereals. CRC Crit. Rev. Plant Sci. 32: 237–249. [Google Scholar]
- Upadhyaya H.D., Pundir R.P.S., Dwivedi S.L., Gowda C.L.L., Reddy V.G. and Singh S. (2009) Developing a mini core collection of sorghum for diversified utilization of germplasm. Crop Sci. 49: 1769–1780. [Google Scholar]
- Yamaguchi T. and Blumwald E. (2005) Developing salt-tolerant crop plants: challenges and opportunities. Trends Plant Sci. 10: 615–620. [DOI] [PubMed] [Google Scholar]
- Yu J., Pressoir G., Briggs W.H., Bi I.V., Yamasaki M., Doebley J.F., McMullen M.D., Gaut B.S., Nielsen D.M., Holland J.B. et al. (2006) A unified mixed-model method for association mapping that accounts for multiple levels of relatedness. Nat. Genet. 38: 203–208. [DOI] [PubMed] [Google Scholar]
- Zhu J.K. (2002) Salt and drought stress signal transduction in plants. Annu. Rev. Plant Biol. 53: 247–273. [DOI] [PMC free article] [PubMed] [Google Scholar]
Associated Data
This section collects any data citations, data availability statements, or supplementary materials included in this article.