

Summary
Producing an accurate atomic model of biomolecule-ligand interactions from maps generated by cryo-electron microscopy (cryoEM) often presents challenges inherent to the methodology and the dynamic nature of ligand binding. Here we present GemSpot, an automated pipeline of computational chemistry methods that take into account EM map potentials, quantum mechanics energy calculations, and water molecule site prediction to generate candidate poses and provide a measure of the degree of confidence. The pipeline is validated through several published cryoEM structures of complexes in different resolution ranges and various types of ligands. In all cases, at least one identified pose produced both excellent interactions with the target and agreement with the map. GemSpot will be valuable for the robust identification of ligand poses and drug discovery efforts through cryoEM.
eTOC Blurb
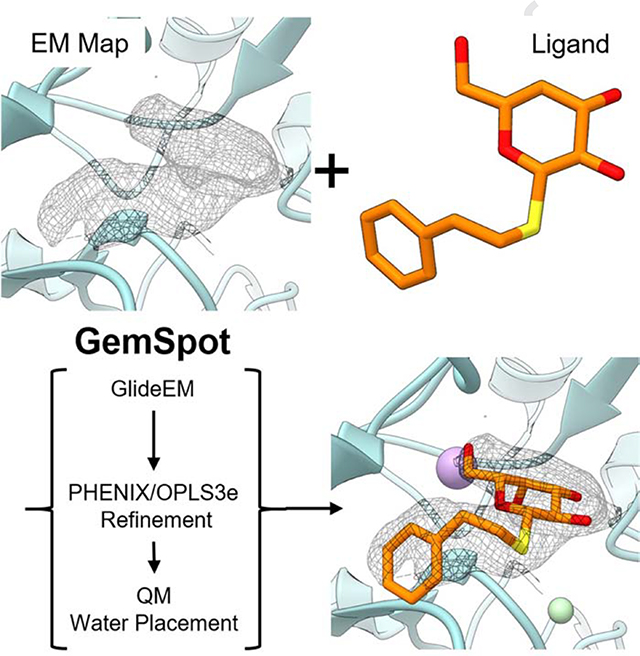
Robertson et al. develop GemSpot, an automated pipeline for modeling ligands in cryoEM maps. GemSpot incorporates GlideEM, a new tool for docking using map restraints, combined with refinement using the OPLS3e force field, quantum mechanics, and water prediction to provide a comprehensive platform for ligand modeling and evaluation.
Graphical Abstract
Introduction
CryoEM has emerged as a major methodology for structure determination of biological macromolecules. The number of deposited cryoEM structures in the PDB(Berman, 2003) with resolution better than 4 Å has increased from 48 in 2015 to over 2,000 at the end of 2019. These structures include many macromolecular complexes and membrane proteins that have generally proven very challenging for traditional structural techniques, particularly X-ray crystallography. As an example, cryoEM has propelled structural studies of the highly druggable class of G protein-coupled receptors (GPCRs) that have been historically limited by difficulties associated with their crystallization. Accordingly, cryoEM now allows for unprecedented opportunities in structure-based drug discovery on a large variety of targets that were up to recently intractable.
Structure-based drug discovery is a rational drug design approach that takes into account the three-dimensional structure of the biomolecular target(Jorgensen, 2009) and aims to predict the binding characteristics of candidate ligands. Structures with sufficiently high resolution (typically <2.5 Å) will facilitate the identification of the correct ligands poses and also bound water molecules, which can play crucial roles in drug design(de Beer, Vermeulen, & Oostenbrink, 2010). Given the recent remarkable progress of cryoEM, with continuous advancement in sample preparation(Jain, Sheehan, Crum, Carragher, & Potter, 2012), automated data collection(Mastronarde, 2005), and improved availability of microscopes capable of achieving high resolution, the methodology will become an invaluable tool for drug discovery efforts and will inevitably be employed in the lead optimization phase to obtain structures of intermediate compounds bound to their targets.
While the number of cryoEM maps of macromolecular complexes determined to date is relatively low, the existing structures suggest that there are some fundamental challenges associated with modeling protein-ligand complexes. Even with very high-resolution data for a biomolecule, the resolution of the map for a bound ligand is often significantly lower than its surrounding environment(Bartesaghi et al., 2018). Given that cryoEM structures derive from flash-frozen macromolecules in aqueous solution, it is perhaps not surprising to observe additional mobility for some ligands within protein active sites. In addition, cryoEM reconstructions determined with different software often yield noticeably different maps from the same dataset. This characteristic may arise from differences in projection angle assignments, in image defocus estimation and correction of the contrast transfer function at high resolution, as well as variability in masking and weighting schemes employed in different software platforms for processing cryoEM data. Collectively, these issues often present the modeler with the challenge of identifying the bound pose of a ligand even when the protein target can be accurately modeled.
Parallel to developments in cryoEM, computational chemistry methods for modeling protein-ligand complexes have improved significantly over time. Computational force fields have been successfully used for decades to describe the energy and forces of various conformations of proteins(Dauber-Osguthorpe & Hagler, 2019) and bound ligands(Harder et al., 2016; Roos et al., 2019). Such force fields, in conjunction with highly optimized sampling and refinement algorithms, enable the prediction of protein-ligand binding modes given only the conformation of the protein and the identity of the ligand(Pagadala, Syed, & Tuszynski, 2017). This molecular docking methodology has been extensively applied to both identify ligands that bind to specific proteins with high affinity and to predict their protein-ligand binding conformations(Kitchen, Decornez, Furr, & Bajorath, 2004). For structure-based drug design, significant emphasis has also been put on predicting the location of water molecules. Several approaches for predicting hydration sites, including grid-based approaches like JAWS(Michel, Tirado-Rives, & Jorgensen, 2009) and dynamics approaches like WATERMAP(Abel, Young, Farid, Berne, & Friesner, 2008), have been developed. Recent computational predictions yield impressive agreement with experimentally derived structures and further highlight the role of hydration in lead optimization(Luccarelli, Michel, Tirado-Rives, & Jorgensen, 2010). It should be noted however that, in the absence of experimental data, significant false positive and false negative rates can hamper purely computational methods.
It thus becomes apparent that employment of an array of well-established computational tools in combination with cryoEM data could address the challenge of modeling ligands into cryoEM maps. To this end, we have developed and validated ‘GemSpot’, a pipeline of computational chemistry methods that assists in obtaining the most probable bound ligand pose using a combination of ligand docking coupled with refinement, quantum mechanical (QM) calculations, automatic water placement and additional external information, all while taking into account the experimental cryoEM data. The GemSpot pipeline has been validated against a varied set of 19 cryoEM structures from 1.9–4.3 Å resolution, consisting of both protein and RNA (Table S1), together with a diverse selection of ligands that include small molecules and peptides (Scheme of all ligands in Fig. S1).
Results
Overview of the GemSpot Workflow
In the first step using GemSpot (see Fig.1), the ligand is docked with a new modification of the popular software GLIDE(Friesner et al., 2004) by employing a combination of the traditional GLIDE docking score function and a real space cross-correlation score to the map (full details of the implementation can be found in the online methods section). This software, called GlideEM, is only moderately more computationally expensive than traditional GLIDE while producing poses with a better average real space cross correlation and fewer poses with substantial disagreement with the EM map (timing and post-refinement cross correlation comparisons in Table S2). Several candidate poses for the ligand generated by GlideEM are subsequently subjected to real space refinement with PHENIX(Adams et al., 2010) including the state-of-the-art OPLS3e / VSGB2.1 force field(Roos et al., 2019),(Li et al., 2011). A combination of real space correlation coefficient and pre-refinement docking scores are then provided to assist the user in eliminating any poses that make little chemical sense or fit poorly into the experimental map.
Fig 1. Schematic of the GemSpot pipeline.

a, Example of a ligand with the potential to make several hydrophobic, hydrogen bonding (orange), and halogen bonding (yellow) interactions. b, The EM density for the ligand in its binding site is shown in wireframe. c, Examples of poses with and without favorable interactions (Good/Bad Score) and/or cross correlation (CC) to the EM map. d, Further support for the ligand pose based on water placement, quantum chemistry, and structure-activity relationship data.
Once the top poses are identified, further computational techniques can be used to generate enhanced confidence in the lead candidate pose, when necessary. For high-resolution EM maps, a free energy approach to hydrate the active site using JAWS(Michel et al., 2009) can be used to help differentiate potential water molecules from noise in the map and gain insight into ligand interactions. When there are still doubts about the conformation of the molecule, one can leverage quantum chemistry to examine the conformational strain associated with any bound poses, e.g. by using GAUSSIAN(Frisch et al., 2016) or Jaguar(Bochevarov et al., 2013). In situations where these computational methods alone may be unable to determine a single pose that unambiguously fits all of the data, it may be necessary to determine which of the top poses are also consistent with data from other experiments. Particularly valuable is a comparison to structure-activity relationship (SAR) data, i.e., whether the prospective pose can effectively explain the changes in binding affinity for analogues of that molecule(Wei et al., 2019). By combining the resulting data, a high degree of confidence can often be obtained even with a low resolution or problematic density for the ligand. GemSpot can be run in ‘pipeline mode’ where the only input is a prepared system file of the macromolecule with the ligand approximately placed in the binding site and the EM map in MRC format. The full pipeline mode will execute GlideEM, Phenix/OPLS3e refinement, and then run Jaguar QM on the resulting poses. A diagram of the process with the inputs used in each step is provided in Figure S6, along with commands for calling both the pipeline and the individual components. Users of the pipeline will need to specify parameters faceden and facrf to control how heavily the density is weighted (initial values of 1 and 1 are suggested) as well as the number of poses GemSpot will attempt to identify. GemSpot will also write out a ‘chopped’ pdb file carved around the ligand at a specified radius that can be used with Python scripts to automatically set up and run water prediction JAWS calculations.
Using GemSpot for beta-galactosidase
The case of beta-galactosidase bound to phenylethyl β-d-thiogalactoside (PETG) provides perhaps the most striking demonstration of modeling protein-ligand complexes using GemSpot. Two published structures, PDB:5A1A(Bartesaghi et al., 2015) and PDB:6CVM(Bartesaghi et al., 2018), have been derived from the same data set by using different software packages to determine the three-dimensional maps. A 2.2 Å map associated with the PDB:5A1A structure was obtained using TOMOCTFFIND(Fernández, Li, & Crowther, 2006) for defocus determination and FREALIGN for map refinement and reconstruction(Grigorieff, 2007), whereas a 1.9 Å map associated with the PDB:6CVM structure was obtained with CTFFIND4(Rohou & Grigorieff, 2015) and CisTEM(Grant, Rohou, & Grigorieff, 2018), including new tools for dose weighting and motion correction. Despite derivation from the same data set, the map densities corresponding to the ligand display different features and, as a result, a significant change to the ligand pose was introduced. Thus, a methodology that could predict the same, correct pose, despite differences in features of ligand densities would be highly desirable. To begin processing ligand modeling in beta-galactosidase, we subjected both protein models with all water and ligand molecules removed (metal ions were retained) to PHENIX real-space refinement prior to docking with GlideEM. Interestingly, docking to both structures/maps yielded ligand poses with the pyranose ring of PETG in the same orientation as shown in PDB:5A1A, which corresponds to the 2.2 Å map (Fig. 2a,b). The cross-correlation of the top real-space-refined docked poses against the 1.9 Å experimental map is actually higher than the associated PDB:6CVM deposited pose (0.73 compared to 0.71), further suggesting that the PDB:5A1A pose is the more probable one. Using traditional docking against the PDB:6CVM structure without the inclusion of the EM map also yielded this pose. However, docking against the PDB:5A1A structure without the map yielded predominantly poses with the ligand outside the corresponding EM density (Fig. S2), presumably due to subtle differences in the position of the sodium and magnesium ions, which can create steric issues in docking the best pose.
Fig 2: GemSpot results for PETG in beta-galactosidase.

a, PDB:5A1A with its associated map EMD:2984 (σ=2.0). The deposited PDB pose is shown in teal, and the best pose obtained from GlideEM is shown in orange. The green and purple spheres correspond to magnesium and sodium ions, respectively. b, PDB:6CVM with its associated map EMD:7770 (σ=3.0). In teal, the deposited PDB pose and in yellow the best pose from GlideEM. c, A comparison of the deposited poses from PDB:5A1A (blue) and PDB:6CVM (orange) with the overlaid QM optimized geometries (teal). The energies reported are the difference between that conformation optimized with the O-C-S-C dihedral angle fixed and that conformation optimized without any fixed dihedrals. d, e, Results of JAWS calculations performed on the best GlideEM pose for the PDB:6CVM structure. Predicted water sites from triplicate simulations are depicted as red spheres, while real-space refined waters based on those positions are presented as teal crosses, and the map shown is EMD:7770 (σ=3.0).
While no pose was obtained in any docking test that resembled the one deposited in PDB:6CVM, we performed quantum chemical optimizations on the conformation of PETG in the two structures. Both calculations converged to near-identical conformations (RMSD of 0.18 Å), presented in Fig. 2c. The optimized structure is very similar to that modeled in PDB:5A1A, with the exception of the phenyl group extending to a trans conformation. When the optimization began from the conformation deposited in PDB:6CVM, we observed a substantial shift in the saccharide ring, with the O-C-S-C dihedral angle shifting from −144 to −71 degrees, the same value as the one in the PDB:5A1A structure. Of note, conformer optimization while maintaining the O-C-S-C dihedral angle fixed at −143 degrees results in a configuration very similar to that of PDB:6CVM. However, this state is roughly 4 kcal/mol higher in energy than the unconstrained state, providing further evidence that the pose modeled in PDB:5A1A is the more physically probable state.
In the next step, we sought to determine water molecule positioning in the beta-galactosidase-PETG structure. For this purpose, we ran JAWS calculations on the pose modeled in Fig. 2b bound to the protein structure from PDB:6CVM, the results of which are presented in Fig. 2d. An octahedral model for magnesium was used to enforce proper coordination of the magnesium ion, given that this is the expected coordination of Mg2+ and consistent with the features in the density (Fig. 2d). This approach enabled us to predict with high confidence a bound water molecule interacting with PETG and histidine 391. Strikingly, this water molecule resides in part of the density region previously attributed to the ligand alone in PDB:6CVM (Fig. 2d). It thus appears that the observed continuous density may have been the product of close proximity between the ligand and the water molecule, giving rise to uncertainty in modeling that was effectively addressed with the GemSpot workflow. In addition, three sites of hydration were predicted near the sodium ion (Fig. S3), with the strongest map features corresponding to the most tightly predicted water site from the triplicate JAWS calculations. By contrast, little consensus was found in the JAWS calculations for the solvent accessible side of the ligand.
In the example of beta-galactosidase, high-resolution crystal structures of the protein in complex with analogous ligands can provide additional data for determining the correct PETG pose. Several of these compounds have the same saccharide moiety but differ from PETG in the thiol group. This provides a clear opportunity to examine how this saccharide ring should be correctly modeled in the active site. Comparing the poses from GemSpot, PDB:5A1A, PDB:6CVM, and the 1.6 Å crystal structure of 4-nitrophenyl-beta-D-galactosidase (PNPG) (Fig. 3) confirms the results of our modeling, which suggested that a pose much more similar to that of PDB:5A1A corresponds to the correct one. The high-resolution crystal structure also shows the presence of a water molecule, as predicted by our JAWS simulations, which is responsible for the aberrant map feature that led to the modeled ligand pose in PDB:6CVM. Thus, all the evidence points to the top-scoring GemSpot pose as the most probable bound ligand conformation.
Fig. 3: Comparison of the PETG poses from cryoEM and a high-resolution crystal structure of a PETG analogue.

All panels display map density from EMD:7770 (σ=3.0). Purple spheres, green spheres, and red crosses correspond to sodium ions, magnesium ions, and water molecules, respectively. a, PDB: 5A1A. b, Highest scoring GemSpot pose with PDB: 6CVM and EMD:7770 (σ=3.0). c, PDB: 6CVM. d, The high-resolution crystal structure of analogous compound PNPG (PDB:1JYW).
Using GemSpot with ~3.0 Å resolution maps
Beyond beta-galactosidase, we examined four other structures with a reported global resolution of 3.0 Å or better. At this resolution, in general, it is not uncommon for the human modeler to be able to discern the correct pose from the map alone. In the deposited structures for cannabinoid receptor 1 (CB1R)(Krishna Kumar et al., 2019), the eukaryotic voltage-gated sodium channel NavPaS(Shen et al., 2018), the small subunit of leishmania ribosome(Shalev-Benami et al., 2017) and the leishmania 20S proteasome(Wyllie et al., 2019) the modeled poses were in excellent agreement with our top calculated pose (Fig. S4, Table S2). Using JAWS calculations, we were able to not just recapitulate the single water modeled in the NavPaS structure but also suggest two additional hydration sites in the vicinity of the tetrodotoxin ligand that are in fact observable in the EM map (Fig. 4).
Fig. 4: Predicted water sites in the structure of tetrodotoxin bound to NavPaS.

The EM density map in wireframe corresponds to that of EMD:6995 (σ=11.0). Red spheres represent predicted sites of hydration from triplicate JAWS runs while teal crosses represent water molecule locations after real space refinement. a, The sodium ion (purple sphere) and its bound water molecule. b, Two additional probable sites of hydration.
The small subunit of the leishmania ribosome presents an interesting example where docking without the EM map yields predominantly poses that do not agree with the map density (Fig. 5). This is likely because the large number of positive charges on the paromomycin ligand can match well with the phosphodiester backbone in many locations, with every pose scoring well. However, this problem was resolved when the map densities are included in the docking using GlideEM. While these structures provide a valuable test for the whole pipeline, it is crucial to also examine performance for lower-resolution structures where a human modeler may be challenged to obtain an accurate pose based on the EM map alone.
Fig. 5: Comparison of paromomycin poses docked with and without the EM map.

a, PDB: 6AZ1 with its accompanying map EMD:7024 (σ=1.0). b, c, Two of the top GlideEM poses with generated from PDB:6AZ1 and EMD:7024 (σ=1.0). d-f, Top poses from traditional docking into PDB: 6AZ1, overlaid with the map EMD:7024 (σ=1.0).
Using GemSpot with 3.0–4.5 Å resolution maps
The bulk of the cryoEM maps of liganded complexes in the PDB at the time of this publication fall into the range of 3.0–4.5 Å. This is unsurprising, as it is still challenging to achieve sub-3.0 Å EM maps, whereas maps worse than 4.5 Å are unlikely to present interpretable densities for the ligand. It is also within this resolution range that we expect modelers to encounter the greatest difficulty placing ligands interactively. Using GlideEM we were able to identify candidate poses in this resolution range with cross correlations that were comparable to the deposited poses for all of the structures that we studied. For GABAA in complex with three different ligands(Masiulis et al., 2019), the M2 muscarinic acetylcholine receptor in complex with two different ligands(Maeda, Qu, Robertson, Skiniotis, & Kobilka, 2019), the sodium channel Nav1.7 with one ligand(Shen, Liu, Wu, Lei, & Yan, 2019), ATP citrate lyase with one ligand(Wei et al., 2019), and the serotonin transporter with two different ligands(Coleman et al., 2019) the poses we identified with GlideEM largely agreed with what was deposited in the PDB (Fig. S5) (although it should be noted that for the deposited structures of the M2 receptor and serotonin transporter the ligands were docked with the traditional version of Glide). At this resolution it is extremely unlikely to resolve water molecules. Accordingly, although our JAWS calculations predicted tightly bound water molecules in these structures, no such water molecules were located in the deposited maps.
In the example of the TRPM8 channel, the modeled pose for the ligand in 6NR3(Yin et al., 2019) agrees well with what we predicted by GlideEM, although this represents another example where docking without the EM map yields additional poses that fall elsewhere in the relatively large and open binding site. In contrast, the icilin/TRPM8 model in 6NR2(Yin et al., 2019) has significant strain energy in its ligand conformation. Using implicit solvent QM minimization, we found that the deposited conformation for icilin (Fig. 6a) is not a minimum energy conformation, but instead a much more linear conformation is energetically preferred (Fig. 6d). Comparison of the QM energy for the implicit solvent minimized ligand to that minimized with the strained dihedral fixed shows the restrained pose to be higher in energy by 5.2 kcal/mol. By employing GlideEM we were able to identify poses with significantly improved real-space cross correlations to the map (0.76–0.79, compared to 0.67 for the deposited pose) and without the heavily distorted dihedral (Fig. 6 b,c).
Fig. 6: Comparison of poses for icilin bound to TRPM8.

a, Deposited pose of icilin, PDB: 6NR3 with map EMD:0488 (σ=4.0). b, c, Two of the top docked GlideEM poses for icilin. d, The icilin conformation from the pose in 6NR3 in teal overlaid with its QM implicit solvent optimized pose in orange; both molecules are aligned to their central ring.
As the results with deposited structures in the 3.0–4.5 Å range were favorable, we wanted to explore the low resolution limits of cryoEM maps where the GemSpot pipeline would still confidently perform. To this end we focused on the leishmania ribosome system, where as mentioned previously, traditional docking does not find the correct ligand pose if the EM density is not used. By taking a random subset of 15,000; 5,000; and 2,500 particles we calculated, respectively, 3.6. 4.3, and 5.5 Å global resolution maps of the leishmania ribosome small subunit(Shalev-Benami et al., 2017). These lower resolution maps were then used to test the limits of the GlideEM method. With these maps, each pose was almost identical to its matched pose docked with the higher resolution map, with the exception of the most solvent exposed ring (Fig. 7), although at 5.5 Å some greater deviation in all rings was observed. It has been suggested previously that for methods of automatic protein model building with cryoEM maps, regions where there is greater divergence between automatically generated models may represent either regions of increased flexibility and/or greater uncertainty in the map, and this is most likely the case for our method(Herzik, Fraser, & Lander, 2019). Based on these results as well as the other systems studied in this work, it appears that the utility of GemSpot is limited largely by the confidence of modeling sidechain positions in the binding site.
Fig. 7: Comparison of poses for paromomycin bound to the leishmania ribosome in maps with global indicated resolutions of 2.6 Å, 3.6 Å, 4.3 Å, and 5.5 Å.

a, b, c Paromomycin pose from PDB: 6AZ1 with cryoEM maps at a, 2.6 Å b, 3.6 Å c, 4.3 Å d, 5.5 Å global resolution. e, i, The top two paromomycin poses from GlideEM using the original 2.7 Å map. f, j, The top two paromomycin poses from GlideEM using the 3.6 Å map from 15,000 particles. g, k, The top two paromomycin poses from GlideEM using the 4.3 Å map from 5,000 particles. h, l, The top two paromomycin poses from GlideEM using the 5.5 Å map from 2,500 particles. All maps are contoured at σ=1.0.
Using GemSpot with peptide ligands
With a thorough understanding of how GemSpot performs for maps of various resolutions, we wanted to ensure that the pipeline has good coverage of chemical space, not just for small molecule ligands but also peptidic ligands. Peptides often present a challenging class of ligands for computational docking because they have significantly more degrees of freedom than most small molecules and thus require specialized protocols. Similarly, the standard implementation of GlideEM does not perform well on these molecules, and we thus developed a variant of the GlideEM based on the Glide peptide docking variant(Tubert-Brohman, Sherman, Repasky, & Beuming, 2013) (details of the implementation are given in the methods). This methodology was applied to two liganded macromolecular complexes, that of the DAMGO (Tyr-D-Ala-Gly-NMePhe-Gly-ol) bound to the m-opioid receptor/Gi complex(Koehl et al., 2018) and that of JMV449 (Lysψ(CH2NH)Lys-Pro-Tyr-Ile-Leu-OH) bound to the neurotensin type 1 receptor/Gi complex(Kato et al., 2019) (Fig. 8). In both systems, we identified a pose nearly identical to the interactively modeled one, as well as other poses that are consistent with the EM map as assessed by cross-correlation. In the case of DAMGO, multiple very different poses were found that maximized the cross-correlation after refinement. However, SAR data across m-opioid ligands suggests a highly conserved protonated amine group that interacts with aspartate 3.32(Koehl et al., 2018). DAMGO also has a protonated amine, and of the three poses with high real-space cross correlations only one has a salt bridge with aspartate 3.32 (Figure 8b), as is the case in the deposited pose (Figure 8a). Thus, we would suggest this to be the most probable experimental pose for DAMGO even though it does not have the highest cross-correlation. While additional structures with larger peptides are necessary to more robustly validate GlideEM for peptides, this initial proof of concept provides a promising starting point.
Fig. 8: Results of docking peptidic ligands with GlideEM.

a, Deposited structure of the μ-opioid-DAMGO complex, PDB:6DDE, EMD:7868. b, c, The two top poses for DAMGO from GlideEM. d, Deposited structure for the neurotensin type 1 receptor-JMV449 complex, PDB:6OS9, EMD:20180. e, f, The two top poses for JMV449 from GlideEM.
Caveats and problematic cases
Although for most of ligand complex systems tested here the GemSpot pipeline works very well, some cases presented challenges that required special attention. While for the majority of structures the results were the same if the initial protein structure was refined with an empty ligand pocket or with some pose of the ligand present, in roughly 10% of systems an empty pocket would cause protein atoms to move into the map density corresponding to the ligand, thereby preventing a correct pose from being properly docked. One example of this was GABAA in complex with benzodiazepine ligands, where protein refinement with an empty ligand pocket leads to side chain atoms slipping into the ligand portion of the map during refinement (Fig. 9). It is thus important that the modeler checks the structure and map before using GlideEM to ensure the protein is modeled optimally. This could also perhaps be remedied with an induced-fit docking approach where protein motions are informed by the EM map, although this is beyond the scope of the current study.
Fig 9: Comparison of GABAA receptor refined with and without ligand present.

GABAA receptor structure PDB:6HUP shown in tan with Met 286 shown in red; the top GemSpot pose in orange, and the re-refined methionine in the absence of ligand is shown in blue. The map corresponds to the portion of EMD:0283 corresponding to the bound ligand.
Discussion
As cryoEM has started to provide near-atomic and even atomic level detail of macromolecular complexes that proved impenetrable to traditional structural biology, it is becoming increasingly important to develop new tools ensuring that the most accurate structures are modeled into the experimental maps. Here we have presented and validated GemSpot, an automated pipeline that combines computational chemistry methods with cryoEM maps to yield high-confidence models for the bound poses of ligands in macromolecular complexes. The novel GlideEM method will be made available in the newest version of the Schrödinger software package. We note, however, that the overall GemSpot approach described here should be implementable in any docking software package. We anticipate that GemSpot and its continuous evolvement will become an invaluable tool for the correct interpretation and modeling of ligand densities and will greatly aid in drug discovery efforts that are based on cryoEM.
STAR METHODS
RESOURCE AVAILABILITY
LEAD CONTACT
Further requests for resources and reagents should be directed to and will be fulfilled by the Lead Contact, Georgios Skiniotis (yiorgo@stanford.edu)
MATERIAL AVAILABILITY
No new reagents were generated in this study.
DATA AND CODE AVAILABILITY
All data generated in this work, including any of the models of protein-ligand complexes, is available by contacting the lead author. Scripts related to JAWS calculations can be found at https://github.com/mjrober101/GemSpot.
METHOD DETAILS
GlideEM
The GemSpot pipeline starts with preparing and refining structures and ligands, by loading each structure and ligand into Maestro where they are processed using the Protein Preparation Wizard panel(Madhavi Sastry, Adzhigirey, Day, Annabhimoju, & Sherman, 2013) with default options, i.e. missing side chain atoms and added hydrogens, and the hydrogen bonding network optimized. For peptides an additional sampling step was performed to create a diverse set of backbone conformations using the Peptide Docking panel in Maestro, outputting 1000 conformations(Tubert-Brohman et al., 2013). Next, the ligands were docked with GlideEM, a version of Glide that takes into account the cryoEM potential map.
Glide, similar to other docking algorithms(Trott & Olson, 2009; Verdonk, Cole, Hartshorn, Murray, & Taylor, 2003), starts by sampling the isolated ligand to determine an ensemble of low-energy conformations that could be biologically relevant. Each pose is rapidly scored on a grid with rewards for creating favorable protein-ligand interactions, such as hydrogen bonds and lipophilic interactions, and penalties for unfavorable ones, like steric clashes. Poses that score highly at this step are then refined by a combination of local sampling and minimization in a force field that includes ligand strain energy, as calculated by the force field, as well as protein-ligand interactions. For GlideEM we have added a simple real-space cross-correlation score used in both the sampling and refinement stages in order to help ensure that the docking function finds the correct binding mode given the experimental cryoEM data as follows.
The input cryoEM map is first normalized in the region around the binding site, by subtracting the mean and dividing by the standard deviation of intensities found over all voxels within a distance of 10 ångstroms plus the ligand’s radius of gyration, determined during the conformational sampling stage, from the center of the binding site. The normalized map is used in the sampling step by rewarding the placement of non-hydrogen atoms in areas with higher Coulombic potential in addition to its standard scoring function. During the refinement step, the protein-ligand energy function is augmented by the real space cross-correlation between the normalized map and a simple simulated potential map of the ligand where each atom is modeled as a single Gaussian function for computational efficiency. Each pose is ultimately ranked with a combination of the standard Glide energy function, the GlideScore, and the approximate fit to the experimental density, the DensScore, to determine the poses that will be evaluated with a more rigorous scoring function. Two parameters are exposed to the user to control the weight of scoring against the EM map, faceden and facrf. The facrf parameter controls the weight of the EM map during the initial sampling phase, and faceden during the refinement phase. While high values tend to increase the contribution of the EM map too much and generally lead to highly strained conformations of the ligand, at present there is an insufficient number of deposited structures to rigorously determine optimal parameters. Thus, both facrf and faceden were set to 1 for all systems studied in this work. As with traditional Glide, an Emodel is also provided for each pose. This value is the result of a scoring function designed to better rank different poses of the same compound, and may be useful in cases where Glide score and cross-correlation alone provide more than one equally ranked pose.
PHENIX/OPLS3e Refinement
The next step in the pipeline consists of refining top scoring poses generated by GlideEM. For small molecules the top 5 poses with the best GlideScore were chosen. For our peptide protocol, poses were selected based on the DensScore, starting with the best scoring pose and adding additional poses that have a heavy atom RMSD higher than 0.5 Å compared to already selected poses up to a total set of 100. The chosen poses were refined with PHENIX real space refinement using an adjusted protocol where the OPLS3e /VSGB2.1 force field is used to calculate ligand energies. Here the macromolecule was processed separately from the ligand of interest with phenix.ready_set (default parameters), and recombined with the ligand poses coming from GlideEM. CIF files for the ligands were created using the hetgrp_ffgen Schrödinger utility. Although the parameters of the ligands’ CIF files are unimportant for the energy model, they are essential for PHENIX to run correctly, and needed to provide the ligand’s topology for restrained B-factor refinement. During real space refinement with phenix.real_space_refine, the chemical energy components of the ligands were swapped with the OPLS3e / VSGB2.1 force field energies with a weight factor of 10 to place the forces on the same order of magnitude of the default PHENIX restrained model. Otherwise, default parameters were used during refinement. All real-space cross correlations were calculated with phenix.cryoem_validation. GlideEM, PHENIX/OPLS3e, and GemSpot scripts are available in the Schrodinger software package.
JAWS and Quantum Mechanics Calculations
The final steps in the GemSpot pipeline, after docking and refinement, consist of further analyzing the generated ligand conformations using quantum chemical calculations, water placement simulations, and including known SAR if available. Quantum chemical calculations were performed with the GAUSSIAN software(Frisch et al., 2016). Ligand structures were minimized with the ωB97-xd functional(Chai & Head-Gordon, 2008) and the 6–311+(2d,2p) basis set in SMD implicit water, optimizing all degrees of freedom.
JAWS Monte Carlo simulations(Michel et al., 2009) were set up as follows. The refined structures were culled at a 25 Å sphere centered around the ligand’s center of mass. The system was simulated in MCPRO(Jorgensen & Tirado-Rives, 2005) with the OPLS-AA/M(Robertson, Tirado-Rives, & Jorgensen, 2015) force field for the protein and OPLS-AA/CM1A for the ligands. The ligand was solvated with a 5 Å layer of TIP4P(Jorgensen, Chandrasekhar, Madura, Impey, & Klein, 1983) theta-water and a 25Å spherical cap of TIP4P water beyond that. Sidechains within 15Å of the ligand were allowed to sample flexibly. 5 million Monte Carlo steps were used for solvent equilibration, 10 million in hydration site identification, and 50 million for production. Three independent simulations were run for each system with the strong consensus water molecules (predicted binding affinity better than 3 kcal/mol) used to locate average positions for subsequent PHENIX real space refinement using the protocol outlined above.
Systems Studied
For this study, the systems chosen were phenethyl beta-d-thiogalactoside (PETG)/beta-galactosidase (PDB:5A1A, EMD:2984)(Bartesaghi et al., 2015); PETG/beta-galactosidase (PDB:6CVM, EMD:7770)(Bartesaghi et al., 2018); Tetrodotoxin/Voltage gated sodium channel NavPaS (PDB:6A95, EMD:6995)(Shen et al., 2018); Fubinaca/Cannabinoid receptor 1 (PDB:6N4B, EMD:0339)(Krishna Kumar et al., 2019); GSK 3494245/Leishmania 20S proteasome (PDB:6QM7, EMD:4590)(Wyllie et al., 2019); Paromomycin/Leishmania ribosome (PDB:6AZ1, EMD:7024)(Shalev-Benami et al., 2017); Menthol analogue WS-12/Ion channel TRPM8 (PDB:6NR2, EMD:0488)(Yin et al., 2019); Icilin/Ion channel TRPM8 (PDB:6NR3, EMD:0487)(Yin et al., 2019); LY2119620/M2R (PDB:6OIK, EMD:20079)(Maeda et al., 2019); Iperoxo/M2R (PDB:6OIK, EMD:20079)(Maeda et al., 2019); Saxitoxin/Nav1.7 (PDB: 6J8G, EMD:9781)(Shen et al., 2019); Biculine/GABAA (PDB:6HUK, EMD:0280)(Masiulis et al., 2019); Xanax/GABAA (PDB:6HUO, EMD:0282)(Masiulis et al., 2019); Valium, GABAA (PDB:6HUP, EMD:0283)(Masiulis et al., 2019); NDI-091143/ATP Citrate Lyase (PDB:6O0H, EMD:0567)(Wei et al., 2019); paroxetine/serotonin transporter (PDB:6DZW, EMD:8941)(Coleman et al., 2019); ibogaine/serotonin transporter (PDB:6DZZ, EMD:8943)(Coleman et al., 2019); ibogaine, serotonin transporter (PDB:6DZY,EMD:8942)(Coleman et al., 2019); DAMGO/Mu opioid receptor (PDB:6DDE, EMD:7868)(Koehl et al., 2018), and JMV449/Neurotensin receptor (PDB:6OS9, EMD:20180)(Kato et al., 2019).
QUANTIFICATION AND STATISTICAL ANALYSIS
Geometric mean was used to choose water positions from the triplicate JAWS calculations described in this work. No other statistical methods were used in this work.
Supplementary Material
KEY RESOURCES TABLE.
| REAGENT or RESOURCE | SOURCE | IDENTIFIER |
|---|---|---|
| Software and Algorithms | ||
| PHENIX v1.15 | Adams et al., 2001 | www.phenix-online.org |
| Maestro 2019–3, 2019–4 | Schrödinger | www.schrodinger.com |
| Schrödinger Suite 2019–3, 2019–4 | Schrödinger | www.schrodinger.com |
| Gaussian v16 | Frisch et al., 2009 | Gaussian.com |
| PyMol v2.3.0 | Schrödinger | www.schrodinger.com |
| MCPRO v2.3 | Jorgensen and Tirado-Rives, 2005 | Zarbi.chem.yale.edu |
| GlideEM v1.0 | This Study | www.schrodinger.com |
| GemSpot v1.0 | This Study | www.schrodinger.com |
| PDBtoZmat.py | This Study | https://github.com/mjrober101/GemSpot |
| ZmattoJAWS.py | This Study | https://github.com/mjrober101/GemSpot |
| Deposited Data Used | ||
| phenethyl beta-d-thiogalactoside (PETG)/beta-galactosidase | Bartesaghi et al., 2015 | PDB:5A1A, EMD:2984 |
| PETG/beta-galactosidase | Bartesaghi et al., 2018 | PDB:6CVM, EMD:7770 |
| Tetrodotoxin/Voltage gated sodium channel NavPaS | Shen et al., 2018 | PDB:6A95, EMD:6995 |
| Fubinaca/Cannabinoid receptor 1 | Krishna Kumar et al., 2019 | PDB:6N4B, EMD:0339 |
| GSK 3494245/Leishmania 20S proteasome | Wyllie et al., 2019 | PDB:6QM7, EMD:4590 |
| Paromomycin/Leishmania ribosome | Shalev-Benami et al., 2017 | PDB:6AZ1, EMD:7024 |
| Menthol analogue WS-12/Ion channel TRPM8 | Yin et al., 2019 | PDB:6NR2, EMD:0488 |
| cilin/Ion channel TRPM8 | Yin et al., 2019 | PDB:6NR3, EMD:0487 |
| LY2119620/M2R | Maeda et al., 2019 | PDB:6OIK, EMD:20079 |
| Iperoxo/M2R | Maeda et al., 2019 | PDB:6OIK, EMD:20079 |
| Saxitoxin/Nav1.7 | Shen et al., 2019 | PDB: 6J8G, EMD:9781 |
| Biculine/GABAA | Masiulis et al., 2019 | PDB:6HUK, EMD:0280 |
| Xanax/GABAA | Masiulis et al., 2019 | PDB:6HUO, EMD:0282 |
| Valium, GABAA | Masiulis et al., 2019 | PDB:6HUP, EMD:0283 |
| NDI-091143/ATP Citrate Lyase | Wei et al., 2019 | PDB:6O0H, EMD:0567 |
| paroxetine/serotonin transporter | Coleman et al., 2019 | PDB:6DZW, EMD:8941 |
| ibogaine/serotonin transporter | Coleman et al., 2019 | PDB:6DZZ, EMD:8943 |
| Ibogaine/serotonin transporter | Coleman et al., 2019 | PDB:6DZY,EMD:8942 |
| DAMGO/Mu opioid receptor | Koehl et al., 2018 | PDB:6DDE, EMD:7868 |
| JMV449/Neurotensin receptor | Kato et al., 2019 | PDB:6OS9, EMD:20180 |
Highlights.
GemSpot is a pipeline for automated modeling of ligands in cryoEM maps
GemSpot employs GlideEM, a new method for computational docking using map information
The GemSpot pipeline is validated using various existing cryoEM structures
The pipeline can handle diverse ligands including peptides
Acknowledgments
We would like to thank William Weis and Axel Brunger for comments on the manuscript. Financial support was provided by the National Institute of Health (grant R01 NS092695-06 to G. S.)
Footnotes
Declaration of Interests
G. C. P. v. Z. and K. B. are employees of Schrödinger and have a stake in the company.
Publisher's Disclaimer: This is a PDF file of an unedited manuscript that has been accepted for publication. As a service to our customers we are providing this early version of the manuscript. The manuscript will undergo copyediting, typesetting, and review of the resulting proof before it is published in its final form. Please note that during the production process errors may be discovered which could affect the content, and all legal disclaimers that apply to the journal pertain.
References
- Abel R, Young T, Farid R, Berne BJ, & Friesner RA (2008). Role of the active-site solvent in the thermodynamics of factor Xa ligand binding. Journal of the American Chemical Society, 130(9), 2817–2831. 10.1021/ja0771033 [DOI] [PMC free article] [PubMed] [Google Scholar]
- Adams PD, et al. (2010). PHENIX: A comprehensive Python-based system for macromolecular structure solution. Acta Crystallographica Section D: Biological Crystallography, 66(2), 213–221. 10.1107/S0907444909052925 [DOI] [PMC free article] [PubMed] [Google Scholar]
- Bartesaghi A, et al. (2018). Atomic Resolution Cryo-EM Structure of β-Galactosidase. Structure, 26(6), 848–856.e3. 10.1016/j.str.2018.04.004 [DOI] [PMC free article] [PubMed] [Google Scholar]
- Bartesaghi A, Merk A, Banerjee S, Matthies D, Wu X, Milne JLS, & Subramaniam S (2015). 2.2 å resolution cryo-EM structure of β-galactosidase in complex with a cell-permeant inhibitor. Science, 348(6239), 1147–1151. 10.1126/science.aab1576 [DOI] [PMC free article] [PubMed] [Google Scholar]
- Berman HM (2003). The Protein Data Bank. Methods of Biochemical Analysis, 44, 181–198. 10.4135/9781412994231.n75 [DOI] [PubMed] [Google Scholar]
- Bochevarov AD, et al. (2013). Jaguar: A high-performance quantum chemistry software program with strengths in life and materials sciences. International Journal of Quantum Chemistry, 113(18), 2110–2142. 10.1002/qua.24481 [DOI] [Google Scholar]
- Chai J. Da, & Head-Gordon M (2008). Long-range corrected hybrid density functionals with damped atom-atom dispersion corrections. Physical Chemistry Chemical Physics, 10(44), 6615–6620. 10.1039/b810189b [DOI] [PubMed] [Google Scholar]
- Coleman JA, Yang D, Zhao Z, Wen PC, Yoshioka C, Tajkhorshid E, & Gouaux E (2019). Serotonin transporter–ibogaine complexes illuminate mechanisms of inhibition and transport. Nature. 10.1038/s41586-019-1135-1 [DOI] [PMC free article] [PubMed] [Google Scholar]
- Dauber-Osguthorpe P, & Hagler AT (2019). Biomolecular force fields: where have we been, where are we now, where do we need to go and how do we get there? Journal of Computer-Aided Molecular Design. 10.1007/s10822-018-0111-4 [DOI] [PubMed] [Google Scholar]
- de Beer S, Vermeulen N, & Oostenbrink C (2010). The Role of Water Molecules in Computational Drug Design. Current Topics in Medicinal Chemistry, 10(1), 55–66. 10.2174/156802610790232288 [DOI] [PubMed] [Google Scholar]
- Fernández JJ, Li S, & Crowther RA (2006). CTF determination and correction in electron cryotomography. Ultramicroscopy, 106(7), 587–596. 10.1016/j.ultramic.2006.02.004 [DOI] [PubMed] [Google Scholar]
- Friesner RA, et al. (2004). Glide: A New Approach for Rapid, Accurate Docking and Scoring. 1. Method and Assessment of Docking Accuracy. Journal of Medicinal Chemistry, 47(7), 1739–1749. 10.1021/jm0306430 [DOI] [PubMed] [Google Scholar]
- Frisch MJ, et al. (2016). Gaussian 16. Gaussian, Inc, Wallingford CT,. [Google Scholar]
- Grant T, Rohou A, & Grigorieff N (2018). CisTEM, user-friendly software for single-particle image processing. ELife, 7 10.7554/eLife.35383 [DOI] [PMC free article] [PubMed] [Google Scholar]
- Grigorieff N (2007). FREALIGN: High-resolution refinement of single particle structures. Journal of Structural Biology, 157(1), 117–125. 10.1016/j.jsb.2006.05.004 [DOI] [PubMed] [Google Scholar]
- Harder E, et al. (2016). OPLS3: A Force Field Providing Broad Coverage of Drug-like Small Molecules and Proteins. Journal of Chemical Theory and Computation, 12(1), 281–296. 10.1021/acs.jctc.5b00864 [DOI] [PubMed] [Google Scholar]
- Herzik MA, Fraser JS, & Lander GC (2019). A Multi-model Approach to Assessing Local and Global Cryo-EM Map Quality. Structure, 27(2), 344–358.e3. 10.1016/j.str.2018.10.003 [DOI] [PMC free article] [PubMed] [Google Scholar]
- Jain T, Sheehan P, Crum J, Carragher B, & Potter CS (2012). Spotiton: A prototype for an integrated inkjet dispense and vitrification system for cryo-TEM. Journal of Structural Biology, 179(1), 68–75. 10.1016/j.jsb.2012.04.020 [DOI] [PMC free article] [PubMed] [Google Scholar]
- Jorgensen WL (2009). Efficient drug lead discovery and optimization. Accounts of Chemical Research, 42(6), 724–733. 10.1021/ar800236t [DOI] [PMC free article] [PubMed] [Google Scholar]
- Jorgensen WL, Chandrasekhar J, Madura JD, Impey RW, & Klein ML (1983). Comparison of simple potential functions for simulating liquid water. The Journal of Chemical Physics, 79(2), 926–935. 10.1063/1.445869 [DOI] [Google Scholar]
- Jorgensen WL, & Tirado-Rives J (2005). Molecular modeling of organic and biomolecular systems using BOSS and MCPRO. Journal of Computational Chemistry, 26(16), 1689–1700. 10.1002/jcc.20297 [DOI] [PubMed] [Google Scholar]
- Kato HE, et al. (2019). Conformational transitions of a neurotensin receptor 1–Gi1 complex. Nature, 572(7767), 80–85. 10.1038/s41586-019-1337-6 [DOI] [PMC free article] [PubMed] [Google Scholar]
- Kitchen DB, Decornez H, Furr JR, & Bajorath J (2004). Docking and scoring in virtual screening for drug discovery: Methods and applications. Nature Reviews Drug Discovery, 3(11), 935–949. 10.1038/nrd1549 [DOI] [PubMed] [Google Scholar]
- Koehl A, et al. (2018). Structure of the μ-opioid receptor-Gi protein complex. Nature, 558(7711), 547–552. 10.1038/s41586-018-0219-7 [DOI] [PMC free article] [PubMed] [Google Scholar]
- Krishna Kumar K, et al. (2019). Structure of a Signaling Cannabinoid Receptor 1-G Protein Complex. Cell, 176(3), 448–458.e12. 10.1016/j.cell.2018.11.040 [DOI] [PMC free article] [PubMed] [Google Scholar]
- Li J, Abel R, Zhu K, Cao Y, Zhao S, & Friesner RA (2011). The VSGB 2.0 model: A next generation energy model for high resolution protein structure modeling. Proteins: Structure, Function and Bioinformatics, 79(10), 2794–2812. 10.1002/prot.23106 [DOI] [PMC free article] [PubMed] [Google Scholar]
- Luccarelli J, Michel J, Tirado-Rives J, & Jorgensen WL (2010). Effects of water placement on predictions of binding affinities for p38R MAP kinase inhibitors. Journal of Chemical Theory and Computation, 6(12), 3850–3856. 10.1021/ct100504h [DOI] [PMC free article] [PubMed] [Google Scholar]
- Madhavi Sastry G, Adzhigirey M, Day T, Annabhimoju R, & Sherman W (2013). Protein and ligand preparation: Parameters, protocols, and influence on virtual screening enrichments. Journal of Computer-Aided Molecular Design, 27(3), 221–234. 10.1007/s10822-013-9644-8 [DOI] [PubMed] [Google Scholar]
- Maeda S, Qu Q, Robertson MJ, Skiniotis G, & Kobilka BK (2019). Structures of the M1 and M2 muscarinic acetylcholine receptor/G-protein complexes. Science, 364(6440), 552–557. 10.1126/science.aaw5188 [DOI] [PMC free article] [PubMed] [Google Scholar]
- Masiulis S, et al. (2019). GABAA receptor signalling mechanisms revealed by structural pharmacology. Nature, 565(7740), 454–459. 10.1038/s41586-018-0832-5 [DOI] [PMC free article] [PubMed] [Google Scholar]
- Mastronarde DN (2005). Automated electron microscope tomography using robust prediction of specimen movements. Journal of Structural Biology, 152(1), 36–51. 10.1016/j.jsb.2005.07.007 [DOI] [PubMed] [Google Scholar]
- Michel J, Tirado-Rives J, & Jorgensen WL (2009). Prediction of the water content in protein binding sites. Journal of Physical Chemistry B, 113(40), 13337–13346. 10.1021/jp9047456 [DOI] [PMC free article] [PubMed] [Google Scholar]
- Pagadala NS, Syed K, & Tuszynski J (2017). Software for molecular docking: a review. Biophysical Reviews. 10.1007/s12551-016-0247-1 [DOI] [PMC free article] [PubMed] [Google Scholar]
- Robertson MJ, Tirado-Rives J, & Jorgensen WL (2015). Improved Peptide and Protein Torsional Energetics with the OPLS-AA Force Field. Journal of Chemical Theory and Computation, 11(7), 3499–3509. 10.1021/acs.jctc.5b00356 [DOI] [PMC free article] [PubMed] [Google Scholar]
- Rohou A, & Grigorieff N (2015). CTFFIND4: Fast and accurate defocus estimation from electron micrographs. Journal of Structural Biology, 192(2), 216–221. 10.1016/j.jsb.2015.08.008 [DOI] [PMC free article] [PubMed] [Google Scholar]
- Roos K, et al. (2019). OPLS3e: Extending Force Field Coverage for Drug-Like Small Molecules. Journal of Chemical Theory and Computation, 15(3), 1863–1874. 10.1021/acs.jctc.8b01026 [DOI] [PubMed] [Google Scholar]
- Shalev-Benami M, et al. (2017). Atomic resolution snapshot of Leishmania ribosome inhibition by the aminoglycoside paromomycin. Nature Communications, 8(1). 10.1038/s41467-017-01664-4 [DOI] [PMC free article] [PubMed] [Google Scholar]
- Shen H, et al. (2018). Structural basis for the modulation of voltage-gated sodium channels by animal toxins. Science, 362(6412). 10.1126/science.aau2596 [DOI] [PubMed] [Google Scholar]
- Shen H, Liu D, Wu K, Lei J, & Yan N (2019). Structures of human Na v 1.7 channel in complex with auxiliary subunits and animal toxins. Science, 363(6433), 1303–1308. 10.1126/science.aaw2493 [DOI] [PubMed] [Google Scholar]
- Trott O, & Olson AJ (2009). AutoDock Vina: Improving the speed and accuracy of docking with a new scoring function, efficient optimization, and multithreading. Journal of Computational Chemistry, NA–NA. 10.1002/jcc.21334 [DOI] [PMC free article] [PubMed] [Google Scholar]
- Tubert-Brohman I, Sherman W, Repasky M, & Beuming T (2013). Improved docking of polypeptides with glide. Journal of Chemical Information and Modeling, 53(7), 1689–1699. 10.1021/ci400128m [DOI] [PubMed] [Google Scholar]
- Verdonk ML, Cole JC, Hartshorn MJ, Murray CW, & Taylor RD (2003). Improved protein-ligand docking using GOLD. Proteins: Structure, Function and Genetics, 52(4), 609–623. 10.1002/prot.10465 [DOI] [PubMed] [Google Scholar]
- Wei J, et al. (2019). An allosteric mechanism for potent inhibition of human ATP-citrate lyase. Nature. 10.1038/s41586-019-1094-6 [DOI] [PubMed] [Google Scholar]
- Wyllie S, et al. (2019). Preclinical candidate for the treatment of visceral leishmaniasis that acts through proteasome inhibition. Proceedings of the National Academy of Sciences of the United States of America, 116(19), 9318–9323. 10.1073/pnas.1820175116 [DOI] [PMC free article] [PubMed] [Google Scholar]
- Yin Y, Le SC, Hsu AL, Borgnia MJ, Yang H, & Lee SY (2019). Structural basis of cooling agent and lipid sensing by the cold-activated TRPM8 channel. Science, 363(6430). 10.1126/science.aav9334 [DOI] [PMC free article] [PubMed] [Google Scholar]
Associated Data
This section collects any data citations, data availability statements, or supplementary materials included in this article.
Supplementary Materials
Data Availability Statement
All data generated in this work, including any of the models of protein-ligand complexes, is available by contacting the lead author. Scripts related to JAWS calculations can be found at https://github.com/mjrober101/GemSpot.