

Abstract
Sulforaphane (SFN), a potent antioxidant and anti-inflammatory agent, has been shown to protect against cancers especially at early stages. However, how SFN affects UVB-mediated epigenome/DNA methylome and transcriptome changes in skin photodamage has not been fully assessed. Herein, we investigated the transcriptomic and DNA methylomic changes during tumor initiation, promotion, and progression and its impact and reversal by SFN using next-generation sequencing (NGS) technology. The results show that SFN reduced tumor incidence and tumor number. SFN's protective effects were more dramatic in the early stages than with later stages. Bioinformatic analysis of RNA-seq data shows differential expressed genes (DEGs) and identifies the top canonical pathways related to SFN treatment of UVB-induced different stages of epidermal carcinogenesis. These pathways include p53 signaling, cell cycle: G2/M DNA damage checkpoint regulation, Th1, and Th2 activation pathway, and PTEN signaling pathways. The top upstream regulators related to UVB and SFN treatment as time progressed include dextran sulfate, TP53, NFE2L2 (Nrf2), IFNB1 and IL10RA. Bioinformatic analysis of Methyl-seq data shows several differential methylation regions (DMRs) induced by UVB were attenuated by SFN. These include Notch1, Smad6, Gnai3, and Apc2. Integrative analysis of RNA-Seq and DNA-seq/CpG methylome yields a subgroup of genes associated with UVB and SFN treatment. The changes in gene expression were inversely correlated with promoter CpG methylation status. These genes include Pik3cd, Matk, and Adm2. In conclusion, our study provides novel insights on the impact of SFN on the transcriptomic and DNA methylomic of UVB-induced different stages of skin cancer in mice.
Keywords: sulforaphane, UVB, epigenome, transcriptome, carcinogenesis
Introduction
Excessive exposure to ultraviolet (UV) radiation can not only cause sunburn but also can lead to skin cancer. Both ultraviolet A (UVA) and ultraviolet B (UVB) exposure can induce oxidative stress and inflammation, which play a significant role in photodamage, including DNA damage, lipid peroxidation, apoptosis, protein oxidation and induce degradation of extracellular matrix components (1,2). Moreover, extensive exposure to UVB radiation can cause DNA damage, ensuing genetic changes and disrupt cell cycle at almost all stages of UVB-induced skin carcinogenesis (3,4). UVB exposure is a major contributor to non-melanoma skin cancers (NMSC), including squamous cell carcinomas and basal cell carcinomas (4,5). There is growing evidence that inflammation is associated with epigenetic changes, mediated by histone methylation, histone acetylation, DNA methylation, and microRNAs, which drive the activation of many inflammatory genes (6). Therefore, inflammation may be an important factor in the prevention of UVB-induced skin carcinogenesis. Despite advances in UVB-induced skin cancer research, the complex epigenomic signaling mechanisms that drive this process in different stages and potential therapeutic strategies have not been fully investigated.
Currently, a variety of natural compounds are receiving increasing attention for their potential chemoprevention of cancers. Several studies have shown that certain phytochemicals from fruits and vegetables have enormous potential to prevent cancers, including skin cancer (7-9). For instance, the topical application of caffeine or (−)-epigallocatechin gallate shows a great protective effect against UVB- induced skin cancer (10). More recently, we reported that triterpenoid ursolic acid (UA) can drive nuclear factor erythroid 2-related factor 2 (NRF2) and its antioxidant response element signaling pathway, anti-inflammatory, and cell cycle regulation genes, which may contribute to the overall chemopreventive effects of UVB-induced MNSC (11,12). Sulforaphane (SFN), an isothiocyanate derived from glucoraphanin, found abundantly in cruciferous vegetables, possesses strong cancer-preventing activity, which can be linked to induction of Phase 2 detoxifying/antioxidant enzymes, and cell proliferation targets including apoptosis and cell cycle arrest (13,14). The topical application of SFN in polyethylene glycol (PEG) base formulation can significantly reduce the activation of AP-1 in mouse skin after UV irradiation, indicating that SFN in this formulation is still effective (15). Moreover, the anticancer effect of SFN on TPA-induced skin cell transformation may involve epigenetic reprogramming of NRF2, causing epigenetic activation of Nrf2, and thus inducing downstream target genes involved in cellular protection (16). Our previous study found that SFN can effectively inhibit UVB-induced skin inflammation/photoprotection in Nrf2 WT and KO C57BL/6 mice (17), as well as inhibiting DMBA-induced skin tumorigenesis in Nrf2 wild-type but not in Nrf2 knockout C57BL/6 mice (18).
The purpose of this study was to explore the topical application of SFN to prevent UVB-induced skin carcinogenesis in SKH-1 hairless mice coupled with next-generation sequencing (NGS) to comprehensively analyze changes in RNA transcriptome and DNA methylome during tumor initiation, promotion, and progression. Our results show that the topical application of SFN after UVB stimulation decreases tumorigenesis and attenuates some of the UVB-induced alterations of RNA transcriptome and CpG methylome in different stages of UVB-induced skin carcinogenesis.
Materials and methods
Animal and reagents
Female SKH-1 hairless mice were obtained from Charles River Laboratories (Wilmington, MA, USA). D, L-Sulforaphane was obtained from Toronto Research Chemicals (S699115; Toronto, Ontario, Canada.) Acetone (HPLC grade) was obtained from Fisher Scientific (Hampton, NH, USA). UV lamps that emit UVB (280 – 320 nm; 75-80% of total energy) and UVA (320-375 nm; 20-25% of total energy) were used as described in our previous study (19). AllPrep DNA/RNA Mini Kit was obtained from Qiagen (Qiagen, Valencia, CA, USA). EZ DNA Methylation-Gold kit was obtained from Zymo Research (Zymo Research, Orange, CA). TruSeq RNA Library preparation kit was obtained from Illumina (Illumina, San Diego, CA, USA). SureSelect Mouse Methyl-Seq Target Enrichment Library Prep Kit was obtained from Agilent (Agilent Technologies, Santa Clara, CA).
Animal experimental design and sample collection
Mice were kept at the Rutgers Animal Facility with a 12/12 h light/dark cycle and offered ad libitum access to food and water. The animal protocol was approved by the Institutional Animal Care and Use Committee (IACUC). Female SKH-1 hairless mice at 6 weeks were randomly divided into 3 groups (n=20 in each group): (1) control group: 200 μL of acetone without UVB treatment, (2) UVB group: 200 μL of acetone with UVB irradiation, and (3) SFN group: 200 μL of 2 μmol SFN in acetone with UVB treatment. At 8 weeks of age, the mice in the UVB group and SFN group were exposed to UVB radiation of 60 mJ/cm2 two times per week. The UVB was given every 2 days. The mice were given a topical application of 200 μL of acetone with or without SFN after UVB exposure on the same day and the following day, respectively. The mice were sacrificed using CO2 asphyxiation and tissue samples were taken immediately at each treatment time point (2 weeks, 15 weeks and 25 weeks). Bodyweight and tumor growth were recorded every week. Only when the tumor diameter was larger than 2 mm, the tumor volume was calculated by the formula V = π/6 × Height ×Length × Width. Epigenome/transcriptome analysis was performed on epidermal tissues from UVB and SFN groups at weeks 2 and weeks 15. Since the whole skin tumor contains epidermis, dermis and subcutaneous layer, we selected the whole skin tissue in the control group at weeks 25 and prepared the sequencing library. The separation of the epidermis from the dermis was done as described previously (20).
RNA-Seq and Computational analyses
This RNA-seq assay was performed by RUCDR and as described previously (11,19,21). Briefly, RNA was extracted from each group using the AllPrep DNA/RNA Mini Kit. Illumina TruSeq RNA library preparation kit was used to construct the library. The samples were sequenced with 75 bp paired-end reads on the Illumina NextSeq 500 instrument, with a minimum depth of 25–30 million reads per sample. The reads were compared with the mouse genome (mm10) by HISAT2 and analyzed by DEGSeq.
Ingenuity pathway analysis (IPA)
To examine the signaling pathways of gene expression, the gene expression levels with ∣log2 fold changes∣ ≥ 1 and with a p-value less than 0.05 were investigated by Ingenuity Pathway Analysis Software. The canonical pathways, downstream effects, potential upstream regulators, and diseases and disorders related to UVB and SFN treatment were identified.
Methyl-Seq and Computational analyses
The Methyl-Seq was carried out as previously described (11,19,21). Briefly, the Methyl-seq library was prepared by the Agilent SureSelect mouse Methyl-seq kit following the manufacturer's protocol. The captured methyl-seq library was converted to bisulfite using the EZ DNA Methylation-Gold kit following the manufacturer's protocol. The methyl-seq library was sequenced on an Illumina HiSeq 2000 platform with 75 bp single-end reads to a minimum sequencing depth of 40 to 50 million reads per sample. This methyl-seq was performed by RUCDR. The reads were aligned to the in silico bisulfite-converted mouse genome (mm10) with the Bismark (version 0.15.0) alignment algorithm (22). After alignment, DMRfinder (23) was used to extract methylation counts and identify differentially methylated regions (DMRs) with each DMR containing at least three CpG sites. Genomic annotation was performed with ChIPseeker in R. DNA methylation level was calculated by methyl cytosine/(methyl cytosine + unmethyl cytosine). We then measured DNA methylation difference by subtracting the individual CpG methylation values in the UVB group from the control group, while subtracting the individual CpG methylation values in SFN group from the UVB group.
Statistical analysis
Statistical significance was calculated by the Student's t-test between two groups. p-value less than 0.05 was considered statistically significant.
Results
Non-melanoma skin carcinogenesis by UVB irradiation
To evaluate the potential anticancer effect of SFN, we employed the UVB-induced photodamage model in female SKH-1 hairless mouse and topical administration of SFN. During the UVB exposure, the tumor was observed in both SFN and non-SFN groups after 14 weeks of UVB treatment. However, compared with the UVB group, the tumor incidence (Fig. 1A), as well as the tumor number (Fig. 1B), were decreased in the SFN group. Interestingly, SFN appears to have better cancer-protective effects in earlier time points (weeks 14 and 20) than later time point (week 24). The average tumor volume in the SFN group was smaller than that in the UVB group (Fig. 1C). At weeks 20, SFN had significantly fewer tumors with decreased total tumor volume and tumor number (p-value < 0.05).
Fig. 1.
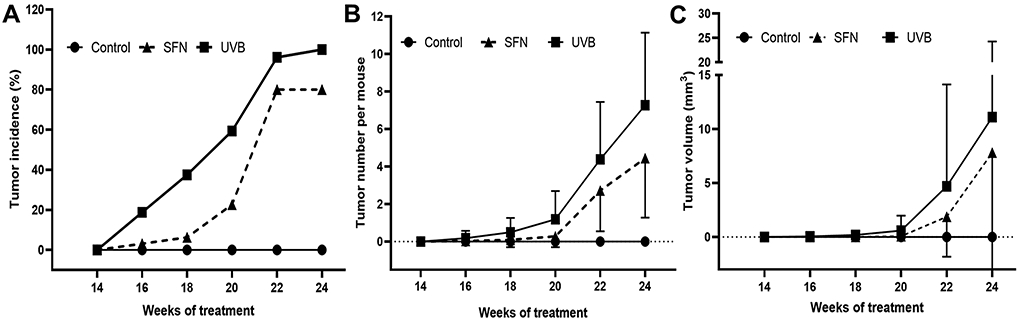
UVB-irradiation induces skin carcinogenesis. (A) Tumor incidence after UVB exposure. (B) Tumor number per mouse during UVB exposure. (C) Average tumor volume per mouse. The data are presented as the mean ± standard deviation.
Transcriptomic changes in UVB irradiation and SFN treatment in different stages of carcinogenesis
To examine the potential effect of UVB and SFN on the gene expression profiles, total RNA was extracted from the early stage (weeks 2), middle stage (weeks 15) and later stage (25 weeks) of skin samples in each group. After 2 weeks of UVB treatment in epidermal tissue, as shown in Fig. 2A, Euclidean distance clustering showed the effect caused by UVB exposure and SFN treatment. The result showed that there was a significant separation between the control untreated group and the other groups. To further evaluate clustering characteristics, we measured principal component analysis (PCA) from epidermis samples at week 2. The result showed that the characteristics of the control group and the UVB treated groups were different (Fig. 2B). Next, as shown in MA plots in Fig. 2C and 2D, the difference between the UVB group and the control group was significantly more than that between the SFN group and the UVB group. To further measure the effects of UVB versus SFN, we compared the gene expression profiles of the UVB versus control groups as well as the SFN versus UVB groups. Cutoff threshold ∣log2 fold change∣ ≥ 1 with p-value < 0.05 was used to select a subset of differentially expressed genes (DEGs). Compared with the control group, 1202 genes were downregulated by UVB and 792 were upregulated by UVB. Comparing the SFN group versus the UVB group, 156 genes were downregulated by SFN and 77 genes were upregulated by SFN. As shown in Fig. 2E and 2F, 100 genes that were significantly upregulated by UVB (100/792) were downregulated after SFN treatment (100/156). Also, 38 genes that were downregulated by UVB (38/1202) were upregulated after SFN treatment (38/77). To further explore the potential protective effects of SFN, IPA software was used to obtain signaling pathway information. Gene expression that showed a ∣log2 fold change∣ ≥ 1 with p-value ≤ 0.05 was used from the UVB vs. control group and SFN vs. UVB group to identify pathways and upstream regulators. From the integrative analysis of RNA-seq data, the top 5 canonical pathways and top 5 upstream regulators were presented in Table 1. These canonical pathways include cell cycle: G2/M DNA damage checkpoint regulation, p53 signaling, Role of BRCA1 in DNA Damage Response and Role of CHK Proteins in Cell Cycle Checkpoint Control (Table 1a). The upstream regulators include TP53, ERBB2, CDKN1A, and dextran sulfate (Table 1b).
Fig. 2.
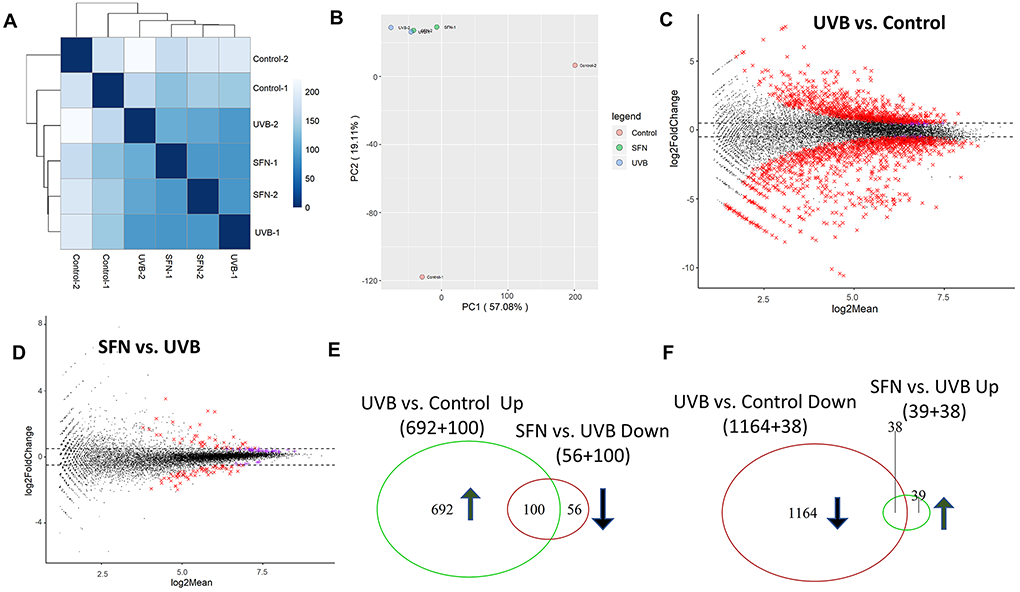
Global gene expression pattern induced by UVB and SFN on week 2 after UVB exposure in mouse epidermal tissue. (A) Euclidean distance clustering between pairs of the 3 groups. (B) PCA for RNA-seq analysis in the 3 groups. MA plots for differential expression analysis of UVB vs. Control (C) and SFN vs. UVB (D). (E, F) Venn diagrams of up-regulated genes, and down-regulated genes in UVB versus control and UVB versus SFN.
Table 1.
Top 5 canonical pathways (a), upstream regulators (b), and diseases and disorders, and molecular and cellular functions (c) determined using IPA in comparison of UVB vs. Control and SFN vs. UVB.
| a. Top 5 canonical pathways | |||||
|---|---|---|---|---|---|
| Canonical Pathways | p-value | Overlap | |||
| Week 2 (epidermis) | UVB vs. Control | Hepatic Fibrosis / Hepatic Stellate Cell Activation | 2.96E-09 | 21.5 % | 40/186 |
| GP6 Signaling Pathway | 1.42E-06 | 21.7 % | 26/120 | ||
| Role of BRCA1 in DNA Damage Response | 2.24E-06 | 25.0 % | 20/80 | ||
| Hereditary Breast Cancer Signaling | 3.06E-06 | 20.0 % | 28/140 | ||
| p53 Signaling | 4.87E-06 | 22.4 % | 22/98 | ||
| SFN vs. UVB | Mitotic Roles of Polo-Like Kinase | 1.83E-07 | 12.1 % | 8/66 | |
| ATM Signaling | 3.54E-05 | 7.2 % | 7/97 | ||
| Cell Cycle: G2/M DNA Damage Checkpoint Regulation | 9.25E-05 | 10.2 % | 5/49 | ||
| TR/RXR Activation | 1.46E-04 | 7.1 % | 6/85 | ||
| Role of CHK Proteins in Cell Cycle Checkpoint Control | 1.91E-04 | 8.8 % | 5/57 | ||
| Week 15 (epidermis) | UVB vs. Control | Th1 and Th2 Activation Pathway | 8.58E-08 | 16.8 % | 29/173 |
| Th1 Pathway | 9.82E-07 | 17.9 % | 22/123 | ||
| Glucocorticoid Receptor Signaling | 1.91E-06 | 12.2 % | 41/337 | ||
| Th2 Pathway | 2.01E-06 | 16.7 % | 23/138 | ||
| Hepatic Fibrosis / Hepatic Stellate Cell Activation | 4.24E-06 | 14.5 % | 27/186 | ||
| SFN vs. UVB | Atherosclerosis Signaling | 4.88E-05 | 4.8 % | 6/124 | |
| Synaptic Long Term Depression | 3.06E-03 | 2.7 % | 5/187 | ||
| Mitotic Roles of Polo-Like Kinase | 5.03E-03 | 4.5 % | 3/66 | ||
| Sperm Motility | 6.18E-03 | 2.3 % | 5/221 | ||
| Role of MAPK Signaling in the Pathogenesis of Influenza | 8.00E-03 | 3.8 % | 3/78 | ||
| Week 25 (tumor/whole skin) | UVB vs. Control | Granulocyte Adhesion and Diapedesis | 3.97E-16 | 19.0 % | 34/179 |
| Agranulocyte Adhesion and Diapedesis | 1.35E-13 | 16.7 % | 32/192 | ||
| Role of Pattern Recognition Receptors in Recognition of Bacteria and Viruses | 3.86E-09 | 14.8 % | 23/155 | ||
| Hepatic Fibrosis / Hepatic Stellate Cell Activation | 6.57E-09 | 13.4 % | 25/186 | ||
| Th1 and Th2 Activation Pathway | 6.01E-07 | 12.1 % | 21/173 | ||
| SFN vs. UVB | Granulocyte Adhesion and Diapedesis | 3.88E-03 | 3.4 % | 6/179 | |
| Agranulocyte Adhesion and Diapedesis | 5.45E-03 | 3.1 % | 6/192 | ||
| MSP-RON Signaling Pathway | 1.30E-02 | 5.1 % | 3/59 | ||
| Neuroprotective Role of THOP1 in Alzheimer's Disease | 1.60E-02 | 3.4 % | 4/116 | ||
| PTEN Signaling | 2.10E-02 | 3.2 % | 4/126 | ||
| b. Top 5 Upstream Regulators | ||||||
|---|---|---|---|---|---|---|
| Week 2 (epidermis) | Week 15 (epidermis) | Week 25 (tumor/whole skin) | ||||
| Name | p-value | Name | p-value | Name | p-value | |
| UVB vs. Control | dextran sulfate | 2.26E-34 | dextran sulfate | 5.91E-31 | IFNG | 5.94E-29 |
| TP53 | 1.80E-31 | IFNG | 1.27E-29 | lipopolysaccharide | 7.07E-27 | |
| ERBB2 | 1.15E-29 | lipopolysaccharide | 1.07E-28 | TNF | 1.05E-25 | |
| CDKN1A | 1.21E-25 | STAT1 | 1.62E-28 | IFNAR1 | 4.90E-22 | |
| PLA2G10 | 2.31E-25 | IFNB1 | 6.91E-28 | IL10RA | 2.55E-21 | |
| SFN vs. UVB | ZBTB17 | 2.40E-18 | GSTZ1 | 3.11E-05 | tetradecanoylphorbol acetate | 1.26E-05 |
| dextran sulfate | 4.53E-18 | ZNF219 | 9.30E-05 | RXRA | 2.93E-04 | |
| PTGER2 | 8.72E-18 | AR | 1.07E-04 | GATA4 | 3.96E-04 | |
| RABL6 | 1.43E-15 | NFE2L2 | 1.53E-04 | KLK5 | 4.06E-04 | |
| CDKN1A | 3.57E-15 | RNF6 | 1.85E-04 | IL10RA | 4.33E-04 | |
| c. Diseases and Disorders, and Molecular and Cellular Functions at Week 25 (tumor/whole skin) | ||||||
| Top 5 Diseases and Disorders |
p-value range | # Molecules |
Top 5 Molecular and Cellular Functions |
p-value range | # Molecules |
|
| UVB vs. Control | Inflammatory Response | 1.62E-06 - 4.95E-25 | 299 | Cellular Movement | 1.62E-06 - 1.89E-24 | 230 |
| Connective Tissue Disorders | 8.98E-07 - 6.91E-25 | 160 | Cell-To-Cell Signaling and Interaction | 1.14E-06 - 4.76E-19 | 175 | |
| Inflammatory Disease | 9.22E-07 - 6.91E-25 | 245 | Cellular Function and Maintenance | 1.22E-06 - 1.00E-17 | 197 | |
| Organismal Injury and abnormalities | 1.56E-06 - 6.91E-25 | 721 | Protein Synthesis | 2.42E-07 - 1.86E-15 | 102 | |
| Skeletal and Muscular Disorders | 8.98E-07 - 6.91E-25 | 181 | Cellular Growth and Proliferation | 1.61E-06 - 5.45E-14 | 181 | |
| SFN vs. UVB | Inflammatory Response | 1.65E-02 - 5.45E-06 | 60 | Cellular Movement | 1.65E-02 - 7.24E-06 | 55 |
| Infectious Diseases | 1.65E-02 - 6.86E-05 | 6 | Cellular Assembly and Organization | 1.47E-02 - 1.92E-05 | 32 | |
| Antimicrobial Response | 5.67E-03 - 8.55E-05 | 14 | Cellular Development | 1.45E-02 - 1.92E-05 | 55 | |
| Cancer | 1.62E-02 - 1.43E-04 | 154 | Cellular Growth and Proliferation | 1.55E-02 - 1.92E-05 | 55 | |
| Dermatological Diseases and Conditions | 8.30E-03 - 1.43E-04 | 107 | Molecular Transport | 1.34E-02 - 2.48E-05 | 44 | |
Similarly, after 15 weeks of UVB treatment in epidermal tissue, the results showed that the Euclidean distance clustering (Fig. 3A) and PCA (Fig. 3B) also showed clear separation. The MA plots showed that the difference between the UVB group and the control group was significantly more than that between the SFN group versus the UVB group (Fig. 3C and 3D). Compared with the control group, 642 genes were downregulated by UVB and 805 genes were upregulated by UVB. Compared with the UVB group, 108 genes were downregulated by SFN and 36 genes were upregulated by SFN. As shown in Fig. 3E and 3F, 35 genes that were significantly upregulated by UVB (35/805) but were downregulated after SFN treatment (35/108). Also, 11 genes that were downregulated by UVB (11/642) were upregulated after SFN treatment (11/36). The top pathways from IPA results include the Th1 and Th2 activation pathway, glucocorticoid receptor signaling and mitotic roles of Polo-Like kinase (Table 1a), and these upstream regulators include IFNG, NFE2L2 (Nrf2), and GSTZ1 (Table 1b).
Fig. 3.
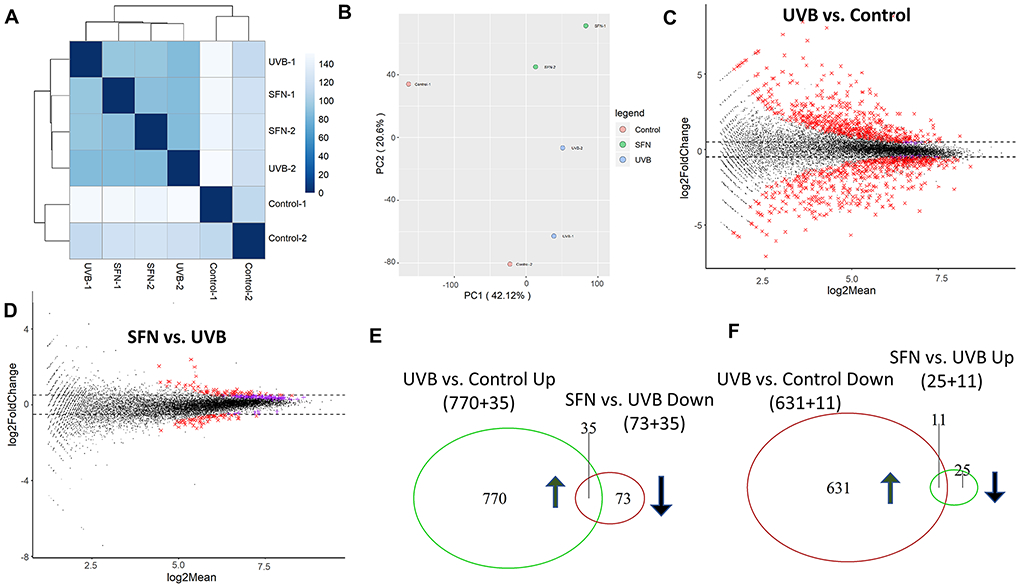
Global gene expression pattern induced by UVB and SFN on week 15 after UVB exposure in mouse epidermal tissue. (A) Euclidean distance clustering between pairs of the 3 groups. (B) PCA for RNA-seq analysis in the 3 groups. MA plots for differential expression analysis of UVB vs. Control (C) and SFN vs. UVB (D). (E, F) Venn diagrams of up-regulated genes, and down-regulated genes in UVB versus control and UVB versus SFN.
After 25 weeks of UVB treatment in the tumor/whole skin tissue, UVB groups are clustered separately from the control group and SFN group by Euclidean distance clustering (Fig. 4A) and PCA (Fig. 4B). The MA plots showed that the DEGs between the UVB group versus the control group was significantly more than that between the SFN group versus the UVB group (Fig. 4C and 4D). Compared with the control group, 520 genes were downregulated by UVB and 375 genes were upregulated by UVB. Compared with the UVB group, 103 genes were downregulated by SFN and 115 genes were upregulated by SFN. As shown in Fig. 4E and 4F, 18 genes that were significantly upregulated by UVB (18/375) were downregulated after SFN treatment (18/103). Besides, 6 genes that were downregulated by UVB (6/520) but were upregulated after SFN treatment (6/115). IPA identified several signaling pathways in these DEGs. The top 5 canonical pathways and upstream regulators are shown in Table 1. These pathways included granulocyte adhesion and diapedesis, PTEN signaling, agranulocyte adhesion, and diapedesis (Table 1a) and these upstream regulators include TNF, IL10RA, IFNG, and RXRA (Table 1b). Next, the IPA analysis showed that the top 5 different diseases and disorders and the top 5 molecular and cellular functions were significantly correlated with our gene set and treatment (Table 1c). Out of those diseases and disorders, such as inflammatory disease, connective tissue disorders, organismal injury and abnormalities, and cancer are shown at the top. Out of those molecular and cellular functions, such as cellular growth and proliferation, cellular movement, cellular assembly and organization, and protein synthesis are among the top.
Fig. 4.
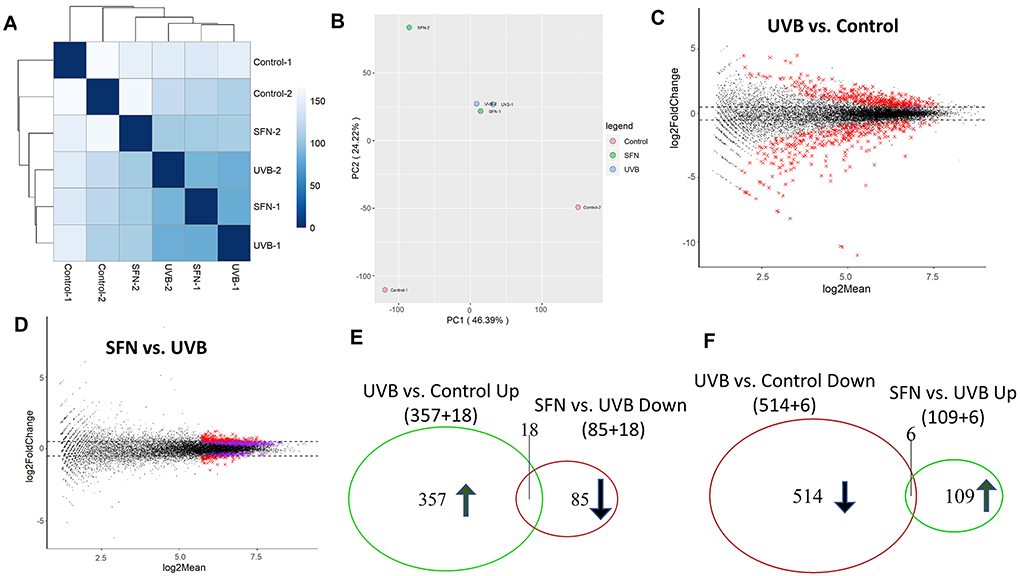
Global gene expression pattern induced by UVB and SFN on week 25 after UVB exposure in mouse tumor/whole skin sample. (A) Euclidean distance clustering between pairs of the 3 groups. (B) PCA for RNA-seq analysis in the 3 groups. MA plots for differential expression analysis of UVB vs. Control (C) and SFN vs. UVB (D). (E, F) Venn diagrams of up-regulated genes and down-regulated genes were compared between UVB versus control and UVB versus SFN.
DNA methylome alterations in UVB irradiation and SFN treatment in different stages of carcinogenesis
Next, Methyl-Seq assay was used to analyze the DNA methylation profile of the UVB group and the control group as well as between the SFN group and the UVB group from the early stage (weeks 2), middle stage (weeks 15) and later stage (25 weeks). Cutoff threshold DNA methylation differences > 0.2 with p-value at 0.01 was used to select a subgroup of DMRs. After 2 weeks of UVB treatment in epidermal tissue, 555 DMRs were found between the UVB group and the control group, comprising 433 hypomethylated DMRs and 122 hypermethylated DMRs associated with UVB in the promoter region (Fig. 5A and 5B). 198 DMRs between the SFN group and the UVB group, comprising 99 DMRs hypomethylated and 99 DMRs hypermethylated in response to SFN in the promoter region (Fig. 5A and 5B). In SFN-regulated DMRs, a total of 37 DMRs were found to have opposite methylation directions. Particularly, 23 DMRs that were hypomethylated by UVB (23/433) were hypermethylated by SFN treatment (23/99). 14 DMRs that were hypermethylated by UVB (14/122) were hypomethylated by SFN treatment (14/99). Genes with differential methylation between the two comparisons were shown in Fig. 5C. These genes include Notch1, Hspd1, and Smad6.
Fig. 5.
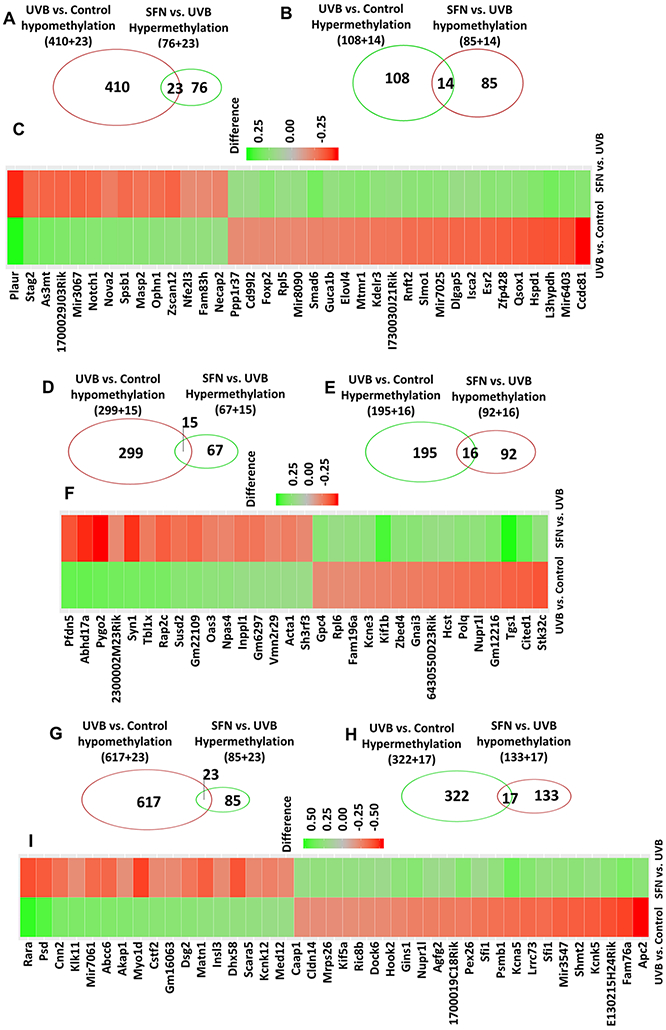
Promoter methylation changes at 2, 15, and 25 weeks of exposure to UVB and SFN. The Venn diagram showed DMRs in the promoter region were significantly hypermethylated/ hypomethylated by UVB but hypomethylated/hypermethylated by SFN treatment using a cutoff threshold DNA methylation difference greater than 0.2 with p-value < 0.01. Heatmap of the overlapping DMRs between the two comparisons. The color of the heatmap is equal to the methylation difference in each comparison.
After 15 weeks of UVB treatment in epidermal tissue, 190 DMRs between the SFN group and the UVB group, comprising 82 DMRs hypermethylated and 108 DMRs hypomethylated in response to SFN in the promoter region (Fig. 5D and E). In SFN-regulated DMRs, a total of 31 DMRs were found to have opposite methylation directions. Particularly, 15 DMRs that were hypomethylated by UVB (15/314) were hypermethylated by SFN treatment (15/82). 16 DMRs that were hypermethylated by UVB (16/211) were hypomethylated by SFN treatment (16/108). Genes with differential methylation between the two comparisons were shown in Fig. 5F. These genes include Rap2c, Acta1, and Gnai3.
After 25 weeks of UVB treatment in the tumor/whole skin tissue, 258 DMRs between the UVB with the SFN group and the UVB group, comprising 108 DMRs hypermethylated and 150 DMRs hypomethylated associated with SFN in the promoter region (Fig. 5G and H). In SFN-regulated DMRs, a total of 40 DMRs were found to have opposite methylation directions. Particularly, 23 DMRs that were hypomethylated by UVB (23/640) were hypermethylated by SFN treatment (23/108). 17 DMRs that were hypermethylated by UVB (17/339) were hypomethylated by SFN treatment (17/150). Genes with differential methylation between the two comparisons were shown in Fig. 5I. These genes include Cstf2, Kcnk5, and Apc2.
Correlation between DNA methylation and Transcription
Next, the correlation between gene expression profiles and DNA methylation profiles at the promoter region was studied to understand the link between DNA methylation and gene expression from tumor initiation, promotion, to the late tumor progression. Genes were filtered by DNA methylation difference and gene expression ∣log2 (Fold Change)∣ ≥ 1. After 2 weeks of UVB treatment of the epidermal tissue, comparing the control group versus UVB group, a total of 18 DMRS in the promoter regions were negatively correlated with the expression of corresponding genes in the epidermal tissues (Fig. 6A). Comparing the UVB group versus SFN group, 5 DMR in the promoter regions of the SFN group was negatively correlated with the expression of corresponding genes (Fig. 6B). These DMRs-related genes include Pik3cd, nudt7, and Ahsg.
Fig. 6.
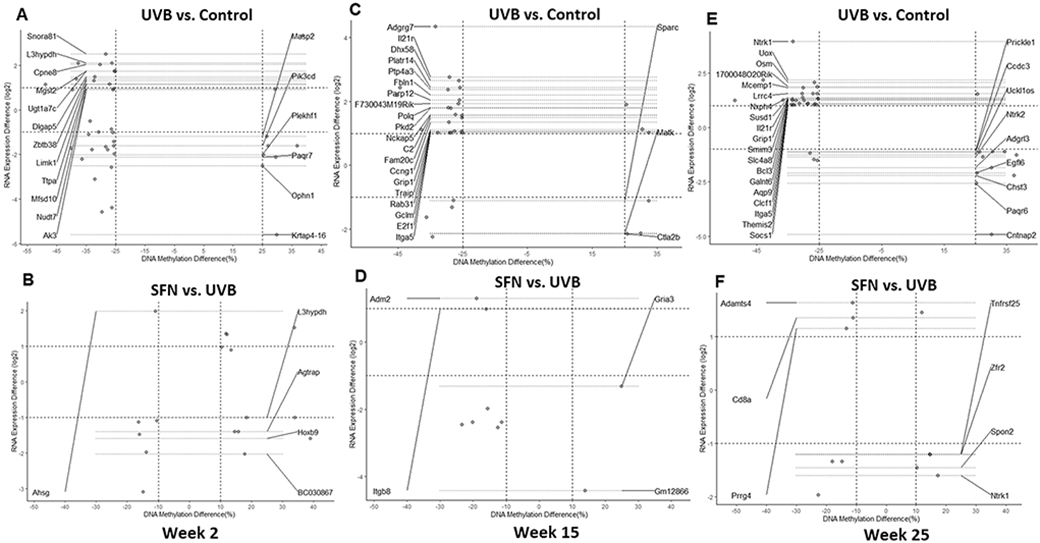
Correlation between gene expression and DNA methylation. Correlations between gene expression and DNA CpG methylation in the promoter at 2 (A, B), 15 (C, D), and 25 (E, F) weeks. The annotated genes had at least one CpG cluster in the promoter region with a change in methylation level negatively correlated with the change in RNA expression.
Similarly, after 15 weeks of UVB treatment, comparing the UVB exposed epidermal tissue versus the control (Fig. 6C), a total of 23 DMRs at the promoter regions displayed inverse correlations with differential expression of the corresponding genes in the UVB group. Compared with the UVB group, 4 DMRs in the promoter regions of the SFN group was negatively correlated with the expression of corresponding genes (Fig. 6D). These DMRs-related genes include Adgrg7, Matk, and Adm2.
After 25 weeks of UVB treatment, comparing the UVB exposed tumor/whole skin tissue versus the control, as shown in Fig. 6E, 28 DMRs at the promoter regions of the UVB group displayed inverse correlations with differential expression of the corresponding genes. Compared with the UVB group, 7 DMRs in the promoter regions of the SFN group was negatively correlated with the expression of corresponding genes (Fig. 6F). These DMRs-related genes include Ntrk1, Bcl3, and Spon2.
Discussion
UVB-induced damage remains a common risk factor for skin carcinogenesis. The production of ROS and inflammation are closely linked to UVB-induced carcinogenesis (24). Studies have shown that SFN protects skin cells from UVB-induced damage mainly through promoting anti-inflammatory, antioxidative and anticancer pathways (17,25). Here, we designed this study to determine the effect of topical application of SFN after UVB exposure in female SKH-1 hairless mice using multi-omics RNA-seq and DNA methyl-seq technologies. Our results show that the topical application of SFN after UVB irradiation decreases tumorigenesis and attenuates some of the UVB-induced alterations of RNA transcriptome and CpG methylome in the different stages of tumorigenesis. These results may provide potential molecular markers and targets for the prevention and treatment of UVB-induced skin carcinogenesis especially at early stages in humans.
UVB-induced skin carcinogenesis is a complex multistage process involving three general stages: tumor initiation, promotion, and progression, mediated by various cellular, biochemical and molecular changes (2). In this study, we observed the changes after 2, 15 and 25 weeks of UVB exposure, which would represent the three different stages of skin cancer development. After 2 weeks of UVB exposure, we did not observe any obvious tumors in the UVB group. But after 15 weeks of UVB exposure, some obvious tumors were observed in the skin (Fig. 1A). Interestingly, SFN treatment effectively blocked the occurrence of the skin tumorigenesis in the earlier time points after UVB exposure (Fig. 1), suggesting its potential cancer chemopreventive effect. Previously, a study has shown that topical application of SFN-containing broccoli sprout extracts has a protective effect on skin cancer induced by UVB through various biological activities of SFN, including antioxidant activity, antiproliferative and anti-inflammatory effects (26). Another study shows that sulforaphane inhibits UVB-induced AP-1 activation by blocking c-fos binding to AP-1 DNA binding site (27). In our current study, we found that the top signaling pathways including p53 Signaling and Cell Cycle: G2/M DNA Damage Checkpoint Regulation and the top upstream regulators including TP53, dextran sulfate, ERBB2, and CDKN1A were identified in the early stage (weeks 2). The previous report has described that the p53 gene plays a role in early events of precancerous lesions in the UVB carcinogenesis of human and mouse skin and is involved in tumorigenesis by clonal expansion (28). For the upstream regulator of Erbb2, UVB-induced Erbb2 activation increases the occurrence of skin tumors through inhibiting Chk1 phosphorylation, maintenance of Cdc25a and suppression of S-phase arrest by the PI3K/Akt-dependent mechanism (29). Moreover, the upstream regulators of IFNG are involved in biomarkers of tumor immune response and melanoma patients (30). Therefore, in our current study, identification of the top pathways and the top upstream regulators (Table 1) after UVB irradiation corroborated with these previous findings. The top 5 regulators with SFN treatment during the initiation, promotion, and late progression stages are shown in Table 1b. Interestingly, other top related signaling pathways, including mitotic roles of Polo-Like kinase, Th1 and Th2 Activation Pathway, and granulocyte Adhesion and Diapedesis, and PTEN signaling are also identified. These pathways and regulators may also have important roles in UVB-induced NMSC carcinogenesis and chemoprevention by dietary phytochemicals including SFN.
DNA CpG methylation is one of the important hallmarks of epigenetic modification in mammals, which involves the regulation of gene expression (31). Moreover, promoter methylation has been shown to inhibit gene transcription (32). We have previously reported that UVB irradiation can cause alterations in DNA CpG methylation in epidermis samples of SKH-1 hairless mice (19,33). In our current study, SFN was found to alter UVB-induced alterations of DNA methylation profiles, and importantly SFN treatment can attenuate some of these DNA methylation changes. It was previously reported that SFN directly down-regulated histone deacetylase (HDAC) activity and indirectly changed gene promoter methylation, thereby regulating gene promoter activity (34). It would be interesting to compare the DNA methylation profile between SFN and other well-known HDAC inhibitors such as Trichostatin A (TSA) and suberanilohydroxamic acid (SAHA).
Examining the relationship between DNA methylation and gene expression, an important subgroup of genes related to SFN in UVB-induced skin carcinogenesis was found as shown in Fig. 6. This result showed that some of the alterations of the CpG methylation by SFN may not results in gene expression changes and conversely, some of the gene expression changes induced by SFN may not be mediated by CpG methylation. Nevertheless, since some of the DNA methylation changes can be used as potential biomarkers for diagnosis, prognosis, and prediction of treatment response (35,36), our results suggest that the SFN’s DNA methylation effects on UVB-induced DNA methylation may be used as potential biomarkers or targets in patients clinically.
In conclusion, this study showed that SFN plays a highly regulatory role in various signaling pathways during UVB irradiation, these pathways including p53 signaling, cell cycle: G2/M DNA damage checkpoint regulation, Th1, and Th2 activation pathway, and PTEN signaling. SFN impacts UVB-induced alterations of DNA methylation profiles, and importantly SFN treatment attenuates some of these DNA methylation changes. Furthermore, by integrating RNA-seq and DNA Methyl-seq data, we found a subset of genes associated with SFN treatment, and the relevant changes in gene expression may be driven by promoter CpG methylation status. The findings of this study suggest that these pathways and genes may contribute to the overall chemopreventive effects of SFN and may provide potential therapeutic markers/targets and strategies for UVB-induced skin carcinogenesis in humans.
Acknowledgments
This study was supported by R01CA200129 from the National Cancer Institute (NCI) and R01AT009152 from the National Center for Complementary & Alternative Medicine (NCCAM). The authors appreciate all the members of Dr. Kong’s laboratory for their invaluable support and technical assistance.
Footnotes
Disclosure of potential conflicts of Interest
The authors have no potential conflicts of interest to disclose.
References
- 1.Rittié L, Fisher GJ. UV-light-induced signal cascades and skin aging. Ageing research reviews 2002;1(4):705–20. [DOI] [PubMed] [Google Scholar]
- 2.Sander CS, Chang H, Hamm F, Elsner P, Thiele JJ. Role of oxidative stress and the antioxidant network in cutaneous carcinogenesis. International journal of dermatology 2004;43(5):326–35. [DOI] [PubMed] [Google Scholar]
- 3.Katiyar SK, Matsui MS, Mukhtar H. Kinetics of UV light–induced cyclobutane pyrimidine dimers in human skin in vivo: an immunohistochemical analysis of both epidermis and dermis. Photochemistry and Photobiology 2000;72(6):788–93. [DOI] [PubMed] [Google Scholar]
- 4.de Gruijl FR, van Kranen HJ, Mullenders LH. UV-induced DNA damage, repair, mutations and oncogenic pathways in skin cancer. Journal of Photochemistry and Photobiology B: Biology 2001;63(1-3):19–27. [DOI] [PubMed] [Google Scholar]
- 5.Seebode C, Lehmann J, Emmert S. Photocarcinogenesis and skin cancer prevention strategies. Anticancer research 2016;36(3):1371–8. [PubMed] [Google Scholar]
- 6.Bayarsaihan D Epigenetic mechanisms in inflammation. Journal of dental research 2011;90(1):9–17. [DOI] [PMC free article] [PubMed] [Google Scholar]
- 7.Greenwald P, Clifford C, Milner J. Diet and cancer prevention. European journal of cancer 2001;37(8):948–65. [DOI] [PubMed] [Google Scholar]
- 8.Banikazemi Z, Haji HA, Mohammadi M, Taheripak G, Iranifar E, Poursadeghiyan M, et al. Diet and cancer prevention: Dietary compounds, dietary MicroRNAs, and dietary exosomes. Journal of cellular biochemistry 2018;119(1):185–96. [DOI] [PubMed] [Google Scholar]
- 9.Katta R, Brown DN. Diet and skin cancer: The potential role of dietary antioxidants in nonmelanoma skin cancer prevention. Journal of skin cancer 2015;2015. [DOI] [PMC free article] [PubMed] [Google Scholar]
- 10.Lu YP, Lou YR, Xie JG, Peng QY, Liao J, Yang CS, et al. Topical applications of caffeine or (−)-epigallocatechin gallate (EGCG) inhibit carcinogenesis and selectively increase apoptosis in UVB-induced skin tumors in mice. Proceedings of the National Academy of Sciences of the United States of America 2002;99(19):12455–60 doi 10.1073/pnas.182429899. [DOI] [PMC free article] [PubMed] [Google Scholar]
- 11.Yang Y, Yin R, Wu R, Ramirez CN, Sargsyan D, Li S, et al. DNA methylome and transcriptome alterations and cancer prevention by triterpenoid ursolic acid in UVB-induced skin tumor in mice. Mol Carcinog 2019. doi 10.1002/mc.23046. [DOI] [PMC free article] [PubMed] [Google Scholar]
- 12.Kim H, Ramirez CN, Su ZY, Kong AN. Epigenetic modifications of triterpenoid ursolic acid in activating Nrf2 and blocking cellular transformation of mouse epidermal cells. The Journal of nutritional biochemistry 2016;33:54–62 doi 10.1016/j.jnutbio.2015.09.014. [DOI] [PMC free article] [PubMed] [Google Scholar]
- 13.Thimmulappa RK, Mai KH, Srisuma S, Kensler TW, Yamamoto M, Biswal S. Identification of Nrf2-regulated genes induced by the chemopreventive agent sulforaphane by oligonucleotide microarray. Cancer research 2002;62(18):5196–203. [PubMed] [Google Scholar]
- 14.Russo M, Spagnuolo C, Russo GL, Skalicka-Woźniak K, Daglia M, Sobarzo-Sánchez E, et al. Nrf2 targeting by sulforaphane: A potential therapy for cancer treatment. Critical reviews in food science and nutrition 2018;58(8):1391–405. [DOI] [PubMed] [Google Scholar]
- 15.Franklin SJ, Dickinson SE, Karlage KL, Bowden GT, Myrdal PB. Stability of sulforaphane for topical formulation. Drug development and industrial pharmacy 2014;40(4):494–502. [DOI] [PMC free article] [PubMed] [Google Scholar]
- 16.Su Z-Y, Zhang C, Lee JH, Shu L, Wu T-Y, Khor TO, et al. Requirement and epigenetics reprogramming of Nrf2 in suppression of tumor promoter TPA-induced mouse skin cell transformation by sulforaphane. Cancer prevention research 2014;7(3):319–29. [DOI] [PubMed] [Google Scholar]
- 17.Saw CL, Huang MT, Liu Y, Khor TO, Conney AH, Kong AN. Impact of Nrf2 on UVB-induced skin inflammation/photoprotection and photoprotective effect of sulforaphane. Molecular carcinogenesis 2011;50(6):479–86. [DOI] [PubMed] [Google Scholar]
- 18.Xu C, Huang M-T, Shen G, Yuan X, Lin W, Khor TO, et al. Inhibition of 7, 12-dimethylbenz (a) anthracene-induced skin tumorigenesis in C57BL/6 mice by sulforaphane is mediated by nuclear factor E2–related factor 2. Cancer research 2006;66(16):8293–6. [DOI] [PubMed] [Google Scholar]
- 19.Yang Y, Wu R, Sargsyan D, Yin R, Kuo H-C, Yang I, et al. UVB drives different stages of epigenome alterations during progression of skin cancer. Cancer letters 2019;449:20–30. [DOI] [PMC free article] [PubMed] [Google Scholar]
- 20.Lu Y-P, Lou Y-R, Yen P, Mitchell D, Huang M-T, Conney AH. Time course for early adaptive responses to ultraviolet B light in the epidermis of SKH-1 mice. Cancer research 1999;59(18):4591–602. [PubMed] [Google Scholar]
- 21.Wang C, Wu R, Sargsyan D, Zheng M, Li S, Yin R, et al. CpG methyl-seq and RNA-seq epigenomic and transcriptomic studies on the preventive effects of Moringa isothiocyanate in mouse epidermal JB6 cells induced by the tumor promoter TPA. The Journal of nutritional biochemistry 2019;68:69–78 doi 10.1016/j.jnutbio.2019.03.011. [DOI] [PMC free article] [PubMed] [Google Scholar]
- 22.Krueger F, Andrews SR. Bismark: a flexible aligner and methylation caller for Bisulfite-Seq applications. Bioinformatics 2011;27(11):1571–2 doi 10.1093/bioinformatics/btr167. [DOI] [PMC free article] [PubMed] [Google Scholar]
- 23.Gaspar JM, Hart RP. DMRfinder: efficiently identifying differentially methylated regions from MethylC-seq data. BMC bioinformatics 2017;18(1):528 doi 10.1186/s12859-017-1909-0. [DOI] [PMC free article] [PubMed] [Google Scholar]
- 24.Bickers DR, Athar M. Oxidative stress in the pathogenesis of skin disease. Journal of Investigative Dermatology 2006;126(12):2565–75. [DOI] [PubMed] [Google Scholar]
- 25.Alyoussef A, Taha M. Antitumor activity of sulforaphane in mice model of skin cancer via blocking sulfatase-2. Experimental dermatology 2019;28(1):28–34 doi 10.1111/exd.13802. [DOI] [PubMed] [Google Scholar]
- 26.Dinkova-Kostova AT, Jenkins SN, Fahey JW, Ye L, Wehage SL, Liby KT, et al. Protection against UV-light-induced skin carcinogenesis in SKH-1 high-risk mice by sulforaphane-containing broccoli sprout extracts. Cancer letters 2006;240(2):243–52. [DOI] [PubMed] [Google Scholar]
- 27.Dickinson SE, Melton TF, Olson ER, Zhang J, Saboda K, Bowden GT. Inhibition of activator protein-1 by sulforaphane involves interaction with cysteine in the cFos DNA-binding domain: implications for chemoprevention of UVB-induced skin cancer. Cancer research 2009;69(17):7103–10. [DOI] [PMC free article] [PubMed] [Google Scholar]
- 28.Benjamin CL, Ananthaswamy HN. p53 and the pathogenesis of skin cancer. Toxicology and applied pharmacology 2007;224(3):241–8. [DOI] [PMC free article] [PubMed] [Google Scholar]
- 29.Madson JG, Lynch DT, Svoboda J, Ophardt R, Yanagida J, Putta SK, et al. Erbb2 suppresses DNA damage-induced checkpoint activation and UV-induced mouse skin tumorigenesis. The American journal of pathology 2009;174(6):2357–66 doi 10.2353/ajpath.2009.080638. [DOI] [PMC free article] [PubMed] [Google Scholar]
- 30.Fang S, Xu T, Xiong M, Zhou X, Wang Y, Haydu LE, et al. Role of Immune Response, Inflammation, and Tumor Immune Response-Related Cytokines/Chemokines in Melanoma Progression. The Journal of investigative dermatology 2019. doi 10.1016/j.jid.2019.03.1158. [DOI] [PMC free article] [PubMed] [Google Scholar]
- 31.Kulis M, Esteller M. DNA methylation and cancer Advances in genetics. Volume 70: Elsevier; 2010. p 27–56. [DOI] [PubMed] [Google Scholar]
- 32.Jones PA. Functions of DNA methylation: islands, start sites, gene bodies and beyond. Nature Reviews Genetics 2012;13(7):484. [DOI] [PubMed] [Google Scholar]
- 33.Yang AY, Lee JH, Shu L, Zhang C, Su Z-Y, Lu Y, et al. Genome-wide analysis of DNA methylation in UVB-and DMBA/TPA-induced mouse skin cancer models. Life sciences 2014;113(1-2):45–54. [DOI] [PMC free article] [PubMed] [Google Scholar]
- 34.Kaufman-Szymczyk A, Majewski G, Lubecka-Pietruszewska K, Fabianowska-Majewska K. The Role of Sulforaphane in Epigenetic Mechanisms, Including Interdependence between Histone Modification and DNA Methylation. International journal of molecular sciences 2015;16(12):29732–43 doi 10.3390/ijms161226195. [DOI] [PMC free article] [PubMed] [Google Scholar]
- 35.Heyn H, Esteller M. DNA methylation profiling in the clinic: applications and challenges. Nature reviews Genetics 2012;13(10):679–92 doi 10.1038/nrg3270. [DOI] [PubMed] [Google Scholar]
- 36.Kit AH, Nielsen HM, Tost J. DNA methylation based biomarkers: practical considerations and applications. Biochimie 2012;94(11):2314–37. [DOI] [PubMed] [Google Scholar]