

Abstract
This paper estimates the magnitude of an informational friction limiting credit reallocation to firms during the 2007‐2009 financial crisis. Because lenders rely on private information when deciding which relationship to end, borrowers looking for a new lender are adversely selected. I show how to identify private information separately from information common to all lenders but unobservable to the econometrician by using bank shocks within a discrete choice model of relationships. Quantitatively, these informational frictions seem too small to explain the credit crunch in the U.S. syndicated corporate loan market.
Keywords: COVID‐19, epidemiological characteristics, multivariate logistic regression, warning score
1. INTRODUCTION
COVID‐19 is a respiratory infectious disease caused by a novel coronavirus, mainly presenting with pulmonary inflammatory lesions. It leads to damage in the digestive, nervous, and cardiovascular system, and even death from multiple organ failure. 1 Despite the high number of cases being reported globally, estimates of severity and fatality rate of the disease still remains very uncertain. A study conducted in China has estimated that the majority (81%) are mild (ie, nonpneumonia or mild pneumonia), 14% are severe (eg, with dyspnea), and 5% are in a critical condition (ie, respiratory failure, septic shock, and/or multiple organ dysfunction/failure), with a fatality of 2.3%. 2 In the European Union/European Economic Area (EU/EEA), the first three confirmed cases were reported by France on 24 January 2020 in the persons who had recently traveled to Wuhan, Hubei Province, China. 3 As of 15 March 2020, COVID‐19 had been detected in all 30 EU/EEA countries and the United Kingdom, 4 whereby since 31 December 2019, 39 768 cases and 1727 deaths had been reported, including 17 750 cases and 1441 deaths from Italy. High incidence of severe COVID‐19, long duration, and high cost of treatment have extremely adverse effects on human health and socioeconomic development.
However, how and why COVID‐19 becomes severe, still remains unclear. Therefore, it is important to understand its risk factors and prevent the development of severe COVID‐19. Many articles of COVID‐19 revealed the risk factors of COVID‐19, but there is no early warning study to help early identification of critical COVID‐19 patients and early intervention to reduce the incidence of critical illness. An early warning model based on risk factors is capable of accurately predicting the severity of the disease. Thus, through retrospective analysis of clinical data of 133 COVID‐19 patients in Chongqing, we investigated the risk factors of COVID‐19 patients. Then, we established a warning model (including independent risk factors). Furthermore, taking advantage of the model, we can also provide scientific reference for early judgment, early intervention, and prevention of deterioration of severe COVID‐19.
2. MATERIALS AND METHODS
This was a retrospective cohort study including 133 patients with novel coronavirus infection admitted to Chongqing Public Health Center and Three Gorges Center Hospital of Chongqing University from January to March, 2020. All COVID‐19 patients met the following criteria: (a) epidemiology history, (b) fever or other respiratory symptoms, (c) typical computed tomography (CT) image abnormities of viral pneumonia, and (d) positive result of a reverse transcription‐polymerase chain reaction for SARS‐CoV‐2 RNA. 5 According to the guidance, 5 we assigned all patients to mild group (65 cases, including the mild type and ordinary type) and severe group (68 cases, including the severe type and critical type) as shown in Table 1. The clinical data of the 133 patients were collected as follows: sex, age, the first generation of patients, smoking, duration of symptoms before treatment, underlying diseases (hypertension, diabetes, heart disease, viral hepatitis, chronic obstructive pulmonary disease, tumor, fatty liver, and chronic kidney disease), clinical manifestations (fever, dry cough, expectoration, shortness of breath, myalgia, headache, and diarrhea), laboratory examinations (white blood cells, the proportion of neutrophil, proportion of lymphocyte, prealbumin, alanine aminotransferase [ALT], aspartate aminotransferase [AST], lactic dehydrogenase [LDH], total protein, albumin, total bilirubin, urea nitrogen, creatinine (Cr), C‐reactive protein [CRP], procalcitonin [PCT], CD4 count, CD4/CD8), and CT scan (initial lesion range). The study was conducted in accordance with the principles of the Helsinki Declaration and its protocol was approved by the ethics committee of the Chongqing Public Health Center (2020‐025‐KY). Since this is a retrospective study, informed consent was waived.
Table 1.
Clinical classification of COVID‐19
| Classification | Clinical manifestations | Imaging manifestations |
|---|---|---|
| Mild | Mild clinical symptoms | No pneumonia manifestation |
| Common | Fever, respiratory tract, and other symptoms | Pneumonia manifestation |
| Severe (Meet any of the following manifestations) |
|
With >50% lesions progression within 24 to 48 h in pulmonary imaging |
| Critical (Meet any of the following manifestations) |
Respiratory failure requiring mechanical ventilation; shock; other organ failure requiring an intensive care unit monitoring and treatment |
Data were analyzed by the research team and the bilateral check was carried out by two physicians. The observed value with missing values greater than 20% was removed. Measurement data were tested for normality and homogeneity of variance. Variables with normal distribution and homogeneity of variance were expressed as mean±standard deviation and an independent‐sample t test was used for univariate analysis. Those that did not comply with the normal distribution or uneven of variance were expressed as median (quartile) (m [QL, QU]) and the Wilcoxon rank‐sum test was used for comparison between groups. Counting data were analyzed by the χ 2 test. The variables with statistical significance in univariate analysis were incorporated into the multivariate Logistic regression model, with an inclusion criterion of 0.1 and an exclusion criterion of 0.15, to screen the independent risk factors of severe COVID‐19. Approximate values of β were taken as variable score and their sum was calculated as the early warning score of severe COVID‐19. Statistical analysis was performed with SAS 9.2 statistical software, and the receiver operating characteristic (ROC) curve was drawn by R3.6.3 software. The ROC curve of the early warning model was drawn to calculate the area under the curve (AUC) and to determine the optimal boundary value of the model and its corresponding sensitivity and specificity. Inspection level = 0.05.
3. RESULTS
Of the 133 hospitalized patients with COVID‐19, 72 were men, including 32 mild (24.06%) and 40 severe (30.08%) cases; 61 were women, including 33 mild (24.81%) and 28 severe (21.05%) cases (Figure 1). The age range of 133 COVID‐19 patients was from 2 to 82 years. The average age in the mild group was significantly younger than that in the severe group (41.22 ± 17.549 vs 59.97 ± 14.126 years; P < .05). The age distribution chart illustrated that the mild group had mainly youths, while the severe one mainly composed of middle‐aged and elderly patients (Figure 2). It seems that the older the COVID‐19 patients, the greater is the risk of severe disease. Among the 133 COVID‐19 patients, 29 were first‐generation patients (21.8%), of whom 17 were mild (58.62% of first‐generation cases) and 12 were severe (41.38% of first‐generation cases). The other 104 were non–first‐generation patients (78.2%), including 56 mild cases (53.85% of non–first‐generation cases), and 48 severe cases (46.15% of non–first‐generation cases). No significant difference is found between the two groups according to the epidemiological history (Figure 1).
Figure 1.
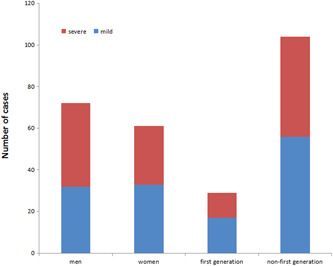
Epidemiological characteristics of COVID‐19 patients in Chongqing. No significant difference was found between the two groups according to the epidemiological history
Figure 2.
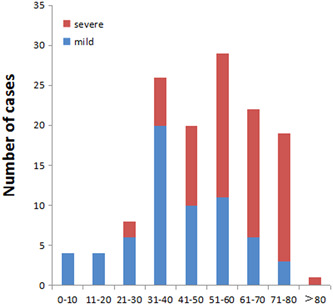
Age distribution of COVID‐19 patients in Chongqing. The age distribution chart illustrated that the mild group had mainly youths, while the severe one was mainly composed of middle‐aged and elderly patients. It showed that the proportion of severe cases increased with age
There was no significant differences in duration of symptoms before treatment (5 [2‐8] vs 5 [3.5‐8.5]; P = .2493), nor in sex, smoking, hypertension, viral hepatitis, tumor, fatty liver, chronic kidney disease, expectoration, headache, or diarrhea between the two groups.
Significant differences were found in diabetes, cardiovascular disease, chronic obstructive pulmonary disease, as well as fever, dry cough, shortness of breath, myalgia between the two groups. The severe group and mild group mostly started with bilateral lung and unilateral lung lesions, respectively, with significant differences (Table 2).
Table 2.
Demographics and baseline characteristics of COVID‐19 patients in Chongqing
| Factors | Mild (N = 65) | Severe (N = 68) | χ 2 | P value* | ||
|---|---|---|---|---|---|---|
| No. | % | No. | % | |||
| Sex | 32 | 46.15 | 40 | 58.82 | 2.943 | .2296 |
| 33 | 52.13 | 28 | 41.18 | |||
| First‐generation | 17 | 26.15 | 12 | 17.65 | 1.4105 | .235 |
| 48 | 73.85 | 56 | 82.35 | |||
| Smoking | 58 | 89.23 | 61 | 89.71 | 0.008 | .9289 |
| 7 | 10.77 | 7 | 10.29 | |||
| Hypertension | 60 | 92.31 | 57 | 83.82 | 2.2604 | .1327 |
| 5 | 7.69 | 11 | 16.18 | |||
| Diabetes | 62 | 95.38 | 49 | 72.06 | 13.0979 | .0003 |
| 3 | 4.62 | 19 | 27.94 | |||
| Cardiovascular disease | 65 | 100 | 62 | 91.18 | 8.321 | .016 |
| 0 | 0 | 6 | 8.82 | |||
| Viral hepatitis | 62 | 95.38 | 66 | 97.06 | 0.2575 | .6119 |
| 3 | 4.62 | 2 | 2.94 | |||
| COPD | 65 | 100 | 64 | 94.12 | 3.9421 | .0471 |
| 0 | 0 | 4 | 5.88 | |||
| Tumor | 65 | 100 | 67 | 98.53 | 0.9631 | .3264 |
| 0 | 0 | 1 | 1.47 | |||
| Fatty liver | 64 | 98.46 | 68 | 100 | 1.0541 | .3046 |
| 1 | 1.54 | 0 | 0 | |||
| Chronic kidney disease | 65 | 100 | 66 | 98.53 | 0.9631 | .3264 |
| 0 | 0 | 2 | 1.47 | |||
| Signs and symptoms | ||||||
| Fever | 51 | 78.46 | 40 | 58.82 | 5.9317 | .0149 |
| 14 | 21.54 | 28 | 41.18 | |||
| Dry cough | 39 | 60 | 29 | 42.65 | 4.005 | .0454 |
| 26 | 40 | 39 | 57.35 | |||
| Expectoration | 51 | 78.46 | 46 | 67.65 | 1.9688 | .1606 |
| 14 | 21.54 | 22 | 32.35 | |||
| Shortness of breath | 59 | 90.77 | 29 | 42.65 | 34.3771 | <.0001 |
| 6 | 9.23 | 39 | 57.35 | |||
| Myalgia | 57 | 87.69 | 48 | 70.59 | 5.8496 | .0156 |
| 8 | 12.31 | 20 | 29.41 | |||
| Headache | 62 | 95.38 | 62 | 91.18 | 0.9328 | .3341 |
| 3 | 4.62 | 6 | 8.82 | |||
| Diarrhea | 54 | 83.08 | 63 | 92.65 | 2.8761 | .0899 |
| 11 | 16.92 | 5 | 7.35 | |||
| Initial lung lesions | 10 | 7.52 | 2 | 1.5 | 28.8716 | <.0001 |
| 25 | 18.8 | 2 | 1.5 | |||
| 30 | 22.56 | 64 | 48.12 | |||
Abbreviation: COPD, chronic obstructive pulmonary disease.
P value indicates the differences between mild and severe COVID‐19 patients. P < .05 is considered as statistically significant.
Of all patients, there were many typically abnormal laboratory findings, including absolute counts of lymphocytes (0 [Interquartile ratio {QR}, 0‐0.85]), prealbumin (70 [IQR, 0‐141]), LDH (307.5 [IQR, 248.5‐402.5]), and C‐reactive protein (CRP) (61.85 [IQR, 22.59‐120]) (Table 2).
Furthermore, we found that the proportion of neutrophils (76.6 [IQR, 45.3‐97] vs 58.1 [IQR, 18‐83.2]), PCT level (0.07 [IQR, 0.02‐0.14] vs 0.02 [IQR, 0.02‐0.04]), ALT level (28.6 [20.9‐45.5] vs 17 [13–28]), AST level (35 [26‐47.6] vs 23 [19–28]), LDH level (307.5 [248.5‐402.5] vs 190 [156‐227]), Cr (4.2 [IQR, 3.05‐5.4] vs 3.53 [2.76‐4.73]), and CRP (61.85 [22.59‐120] vs 3.55 [2.13‐9.32]) were significantly higher in the severe group compared with the mild group. Besides, the absolute count of lymphocytes (0 [IQR, 0‐0.85] vs 1.56 [1.16‐1.94]), lymphocyte proportion (14.25 [IQR, 10.5‐21.5] vs 31.5 [24.2‐38.5]), hemoglobin level (0 [IQR, 0‐124.5] vs 135 [118‐145]), the levels of activated partial thromboplastin time (APTT) (31.6 [IQR, 27.8‐38.9] vs 39.6 [34.3‐43.1]), prealbumin (70 [IQR, 0‐141] vs 210 [183‐260]), total albumin level (64 [IQR, 60.25‐68.5] vs 68.5 [64.1‐73.3]), albumin level (36 [IQR, 32.7‐39.8] vs 42.6 [40‐44.5]), and CD4 count (234.5 [IQR, 155.5‐353.5] vs 478 [326‐571]) were significantly lower in the severe group (Table 3). These findings showed that the COVID‐19 patients were at higher risk of excessive uncontrolled inflammation responses.
Table 3.
Comparison in laboratory findings between severe and mild COVID‐19 patients in Chongqing
| Factors | Mild (N = 65) | Severe (N = 68) | |||||
|---|---|---|---|---|---|---|---|
| M | QL, QU | M | QL, QU | Z value | P value* | ||
| WBC, ×109/L | 5.05 | 4.14, 6.03 | 5.47 | 4.34, 7.45 | −1.9671 | .0492 | |
| Proportion of neutrophils, % | 58.1 | 18, 83.2 | 76.6 | 45.3, 97 | 1.21 | .4459 | |
| Lymphocytes, ×109/L | 1.56 | 1.16, 1.94 | 0 | 0, 0.85 | 7.9884 | <.0001 | |
| Proportion of lymphocytes, % | 31.5 | 24.2, 38.5 | 14.25 | 10.5, 21.5 | 7.3507 | <.0001 | |
| Hemoglobin, g/L | 135 | 118, 145 | 0 | 0, 124.5 | 6.8777 | <.0001 | |
| Platelet, ×109/L | 186 | 143, 236 | 164 | 120.5, 236.5 | 1.2897 | .1972 | |
| PCT, ng/ml | 0.02 | 0.02, 0.04 | 0.07 | 0.04, 0.12 | −6.0860 | <.0001 | |
| PT, s | 11.8 | 11.1, 12.4 | 11.5 | 11.1, 12.2 | 0.5857 | .5581 | |
| APTT, s | 39.6 | 34.3, 43.1 | 31.6 | 27.8, 38.9 | 3.0880 | .002 | |
| Prealbumin, g/L | 210 | 183, 260 | 70 | 0, 141 | 7.9412 | <.0001 | |
| ALT, U/L | 17 | 13, 28 | 28.6 | 20.9, 45.5 | −3.0821 | .0021 | |
| AST, U/L | 23 | 19, 28 | 35 | 26, 47.6 | −4.9969 | <.0001 | |
| LDH, U/L | 190 | 156, 227 | 307.5 | 248.5, 402.5 | −6.9704 | <.0001 | |
| Total protein, g/L | 68.5 | 64.1, 73.3 | 64 | 60.25, 68.5 | 3.3131 | .0009 | |
| Albumin, g/L | 42.6 | 40, 44.5 | 36 | 32.7, 39.8 | 6.1694 | <.0001 | |
| Total bilirubin, μmol/L | 12.9 | 9, 18.5 | 11.95 | 8.55, 18 | 0.9295 | .3514 | |
| BUN, mmol/L | 3.53 | 2.76, 4.73 | 4.2 | 3.05, 5.4 | −2.0167 | .0219 | |
| Cr, μmol/L | 61.8 | 51.4, 73.1 | 63.8 | 50, 75 | −0.2858 | .775 | |
| CRP, mg/L | 3.55 | 2.13, 9.32 | 61.85 | 22.59, 120 | −7.6908 | <.0001 | |
| CD4 count, ×106/L | 478 | 326, 571 | 234.5 | 155.5, 353.5 | 3.5036 | .0002 | |
| CD4/CD8 | 1.23 | 0, 1.68 | 1.42 | 1, 2.02 | 0.23 | .8181 | |
Abbreviations: ALT, alanine aminotransferase; APTT, activated partial thromboplastin time; AST, aspartate aminotransferase; BUN, urea nitrogen; COPD, chronic obstructive pulmonary disease; Cr, creatinine; CRP, C‐reactive protein; LDH, lactic dehydrogenase; PCT, procalcitonin; PT, prothrombin time; QL, lower quartile; QU, upper quartile.
P value indicates the differences between severe and mild patients. P < .05 is considered as statistically significant.
As shown in Tables 2 and 3, the multivariate logistic regression analysis indicates that age, shortness of breath, lymphocyte count, the levels of PCT, APTT, LDH, and CRP are the independent predictors of severe COVID‐19. On the basis of the above results, the warning model probability is calculated by the following formula: P = 1/(1 + exp[−9.1744 + 0.1232 × X2 + 3.1825 × X17 − 2.3652 × X23 + 46.8309 × X27−0.1297 × X29 + 0.0294 × X33 − 0.0654 × X39]) (Tables 4 and 5). The AUC of severe COVID‐19 was predicted to be 0.8842 by early warning score. When the cutoff value was 0.6317, the sensitivity, specificity, and Jordan index were 84.33%, 96.89%, and 0.812%, respectively (Figure 3).
Table 4.
Variable assignment
| Variable a | Data recorded as |
|---|---|
| Dependent variable | |
| Severity classification | 1 = Mild, 2 = severe |
| Independent variable | |
| Sex (X1) | 1 = Male, 2 = female |
| Age (X2) | Continuity variable, y |
| 1st‐generation (X3) | 1 = Yes, 0 = no |
| Smoking (X4) | 1 = Yes, 0 = no |
| Duration of symptoms before treatment (X5) | Continuity variable, d |
| Hypertension (X6) | 1 = Yes, 0 = no |
| Diabetes (X7) | 1 = Yes, 0 = no |
| Cardiovascular disease (X8) | 1 = Yes, 0 = no |
| Viral hepatitis (X9) | 1 = Yes, 0 = no |
| COPD (X10) | 1 = Yes, 0 = no |
| Tumor (X11) | 1 = Yes, 0 = no |
| Fatty liver (X12) | 1 = Yes, 0 = no |
| Chronic kidney (X13) | 1 = Yes, 0 = no |
| Fever (X14) | 1 = Yes, 0 = no |
| Dry cough (X15) | 1 = Yes, 0 = no |
| Expectoration (X16) | 1 = Yes, 0 = no |
| Shortness of breath (X17) | 1 = Yes, 0 = no |
| Myalgia (X18) | 1 = Yes, 0 = no |
| Headache (X19) | 1 = Yes, 0 = no |
| Diarrhea (X20) | 1 = Yes, 0 = no |
| WBC (X21) | Continuous variable, ×109/L |
| Proportion of neutrophils (X22) | Continuous variable, % |
| Lymphocytes (X23) | Continuous variable, ×109/L |
| Proportion of lymphocytes (X24) | Continuous variable, % |
| Hemoglobin (X25) | Continuous variable, g/L |
| Platelet (X26) | Continuous variable, ×109/L |
| PCT (X27) | Continuous variable, ng/ml |
| PT (X28) | Continuous variable, s |
| APTT (29) | Continuous variable, s |
| Prealbumin (30) | Continuous variable, g/L |
| ALT (X31) | Continuous variable, U/L |
| AST (X32) | Continuous variable, U/L |
| LDH (X33) | Continuous variable, U/L |
| Total protein (X34) | Continuous variable, g/L |
| Albumin (X35) | Continuous variable, g/L |
| Total bilirubin (X36) | Continuous variable, μmol/L |
| BUN (X37) | Continuous variable, mmol/L |
| Scr (X38) | Continuous variable, μmol/L |
| CRP (X39) | Continuous variable, mg/L |
| CD4 count (X40) | Continuous variable, ×106/L |
| CD4/CD8 (X41) | Continuous variable |
| Initial lung lesions (X42) | 0 = None, 1 = unilateral, 2 = bilateral |
Abbreviations: ALT, alanine aminotransferase; APTT, activated partial thromboplastin time; AST, aspartate aminotransferase; BUN, urea nitrogen; COPD, chronic obstructive pulmonary disease; Cr, creatinine; CRP, C‐reactive protein; LDH, lactic dehydrogenase; PCT, procalcitonin; PT, prothrombin time.
X1, X2, and so forth are designated as the variables used in the multiple regression analysis.
Table 5.
Risk factors related to severe COVID‐19 patients: Multivariate logistic regression analysis
| Variable | Estimate | Standard error | Wals χ 2 | Statistical significance | Odds ratio (95% confidence interval) |
|---|---|---|---|---|---|
| Constant | −9.1744 | 4.7394 | 3.7472 | .0529 | ⋯ |
| X2 | 0.1232 | 0.0539 | 5.2238 | .0223 | 1.131 (1.018, 1.257) |
| X17 | 3.1825 | 1.0391 | 9.3805 | .0022 | 0.002 (<0.001, 0.101) |
| X23 | −2.3652 | 0.9444 | 6.2722 | .0123 | 0.094 (0.015, 0.598) |
| X27 | 46.8309 | 18.9974 | 6.0768 | .0137 | >999.999 (>999.999, >999.999) |
| X29 | −0.1297 | 0.0764 | 2.8816 | .0896 | 0.878 (0.756, 1.02) |
| X33 | 0.0294 | 0.0105 | 7.7848 | .0053 | 1.03 (1.009, 1.051) |
| X39 | 0.0654 | 0.0316 | 4.2827 | .0385 | 1.068 (1.003, 1.136) |
Figure 3.
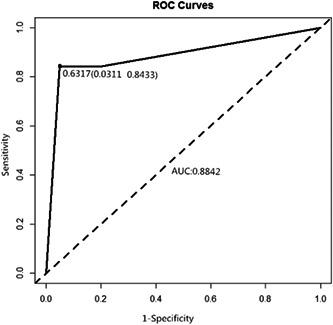
Receiver operating characteristic (ROC) curves for early warning system of severe COVID‐19 patients.The warning model was calculated by independent risk factors. It had an excellent discriminatory power to predict severe COVID‐19 (area under the curve is88%)
4. DISCUSSION
Novel coronavirus transmits through respiratory droplets and close contacts, mainly involving respiratory system. It is still challenging to treat severe COVID‐19, which may have large cost and high mortality. 6 , 7 , 8 , 9 From January to March 2020, a total of 576 COVID‐19 patients were admitted in our city, Chongqing, with six deaths and a mortality of 1.04%, which was lower than the national one. 10 Nearly 133 COVID‐19 patients were admitted to Chongqing Public Health Center and Three Gorges Center Hospital of Chongqing University. There was no significant difference in sex between the severe and mild cases (P > .05). Data show that most COVID‐19 patients in provinces and cities except Hubei are clustered cases. 11 Our study indicates that the first‐generation COVID‐19 cases accounts for 21.8%, which is consistent with the national proportion. Of all the cases, the first generation of the mild and severe cases accounts for 26.15% and 17.65%, respectively, without significant difference (P > .05). Thus, close contact with the COVID‐19 patients in Wuhan is confirmed not directly related to the severity of the disease.
The age range of 133 COVID‐19 patients is from 2 to 82 years, and the severe group is significantly older than the mild group (P < .05). The age distribution chart (Figure 2) illustrated that the mild group and severe group are mainly distributed in the age range of 30 to 60 years and 50 to 80 years, respectively. The older the age, the greater the proportion of severe COVID‐19. Multivariate regression analysis also proves that age is an independent risk factor for severe COVID‐19 (P = .0223), which may be related to immune dysfunction and presence of underlying diseases in elderly patients. 12 , 13 In this study, five children aged 0 to 14 years admitted to hospital did not progress to severe disease, which is consistent with the findings of Fang et al 14 The reason may be related to the relatively low expression of ACE2 receptor in children, which leads to the restriction of virus invasion pathway. 15 However, the specific mechanism has to be confirmed by further study.
Univariate analysis shows significant differences in underlying diseases (diabetes, cardiovascular disease, and COPD) and clinical manifestations (fever, dry cough, shortness of breath, and myalgia) between the two groups (P < .05). In terms of etiology, diabetes mellitus may result in immune dysfunction, virus susceptibility, and progression to severe condition. For COPD, basic pulmonary function impairment combined with infection and exudation leads to further deterioration of pulmonary function and increase the risk of acute respiratory distress syndrome (ARDS). Due to infection, hypoxia of cardiovascular patients aggravates the burden on the heart, leading to high risk of pulmonary interstitial edema, and then to progression of ARDS.
Regression analysis shows that the underlying disease is not an independent risk factor of severe COVID‐19. Reanalysis of the data indicates 18, 7, and 4 patients in the severe group with one (26.47%), two (10.29%), and (5.88%) three underlying diseases. In the mild group, six and two patients had one (9.23%) and two (3.08%) underlying diseases, respectively, but none with three. Due to limited sample size, young age of mild cases, and few underlying disease, there may be some selection bias.
Shortness of breath is one of the clinical symptoms to distinguish upper respiratory tract infection from pneumonia. The presence of shortness of breath indicates that the lung lesions are more serious. Zhang et al 16 have found that shortness of breath is an independent risk factor of death in H1N1 adult patients with diabetes mellitus. Our research also proved that it was an independent risk factor for predicting the severity of COVID‐19 (Table 5).
The level of leukocyte count, PCT, ALT, AST, LDH, Cr, and CRP in the severe group was significantly higher than those in the mild group, which is related to the damage of organ function caused by the release of inflammatory mediators. Multivariate regression suggests that LDH is an independent risk factor for severe COVID‐19 (odds ratio = 1.030, 95% confidence interval: 1.009‐1.051). Reyes et al 17 have proved that LDH is an independent risk factor of influenza A (H1N1) death. A study including 2151 Chinese patients with influenza A (H1N1) in 2009 also showed that LDH level is an independent predictor of death in healthy adults, and also a risk factor of death in patients with cardiovascular diseases. 15 LDH level has been proved to reflect the degree of virus damage to tissues and the severity of disease, and LDH level and heart disease are both risk factors of influenza death, which may be associated with the direct damage to myocardial cells after influenza virus infection. In addition, influenza virus infection can also lead to deterioration of the original heart disease. 18 , 19
Lymphocytes count, proportion of lymphocytes, hemoglobin, APTT, prealbumin, total protein, albumin, and CD4 count in the severe group were significantly lower than those in the mild group. Immune function is declined, lymphocyte count and lymphocyte ratio is reduced in patients with COVID‐19, and CD4 count is also significantly reduced accordingly, which is consistent with the diagnosis and treatment guidelines proposed by Jin et al. 20 This indicates that the novel coronavirus mainly may attack lymphocytes in the body, which reduces CD4+ T lymphocyte count, results in a declined immune function leading to infection, and progresses into severe pneumonia. 21 , 22
In the severe group, the onset of double lung disease is more common, while in the mild group, single lung disease is more common, with significant difference. Bilateral lung lesions are more likely to progress to severe COVID‐19. This conclusion is consistent with the analysis of imaging changes of COVID‐19 by Chung et al. 23 This study confirmed that most severe COVID‐19 patients initially presented with bilateral lung infiltration and the wider the focus, the more severe is the disease. However, regression analysis does not confirm that the range of initial focus is an independent risk factor for severe COVID‐19. In this study, the imaging changes of COVID‐19 were roughly divided into three variables: nonfocus, unilateral focus, and bilateral focus. In the future study, the proportion of focus will be calculated by computer simulation technology to quantify the range and compare the differences between the two groups. Regression analysis will be used to determine whether the focus range is an independent risk factor of severe COVID‐19.
According to the regression analysis, β‐coefficients of the independent risk factors were used to establish the early warning model. The final score has an excellent discriminatory power to predict the outcome (AUC of 88%; Figure 3).
Our study also has some limitations. This is not a randomized controlled study, so selection bias is inevitable. The sample size of the mild group is small, so we did not detect the underlying diseases that are independent risk factors of COVID‐19. Although the initial focus was to identify the risk factor of severe disease, we did not accurately calculate the initial focus range, which resulted in biased analysis. In addition, the retrospective study was conducted only in Chongqing, we do not know whether the warning model is applicable for other countries or cities. A larger sample from multiple hospitals is required to confirm our findings.
5. CONCLUSION
In Chongqing, severe COVID‐19 patients were older. There was no direct correlation between epidemiological history and disease severity. Our study proves that an early warning model can be used to accurately identify severe patients at early stages, which can enable an early intervention in high‐risk patients and reduce the risk of severe COVID‐19.
CONFLICT OF INTERESTS
The authors declare that there are no conflict of interests.
AUTHOR CONTRIBUTION
AZ, GY, and YC conceived and designed the experiments. YS performed the experiments. PW analyzed the data. PY contributed to the writing of the manuscript.
ACKNOWLEDGMENTS
This study was supported by Chongqing Special Research Project for Prevention and Control of Novel Coronavirus Pneumonia (No. cstc2020jscx‐fyzx0103).
Yang P, Wang P, Song Y, Zhang A, Yuan G, Cui Y. A retrospective study on the epidemiological characteristics and establishment of early warning system of severe COVID‐19 patients. J Med Virol. 2020;92:2173–2180. 10.1002/jmv.26022
Ping Yang, Pengfei Wang, and Yuyan Song contributed equally to this study.
Contributor Information
An Zhang, Email: zhangan@hospital.cqmu.edu.cn.
Guodan Yuan, Email: 71502294@qq.com.
Yong Cui, Email: 754605155@qq.com.
REFERENCES
- 1. National Health Commission of the People's Republic of China . COVID‐19 protocol (trial version 6). 2020. [DOI] [PMC free article] [PubMed]
- 2. The Novel Coronavirus Pneumonia Emergency Response Epidemiology Team . Vital surveillances: the epidemiological characteristics of an outbreak of 2019 novel coronavirus diseases (COVID‐19)‐China, 2020. China CDC Weekly. 2020;2(8):113‐122. [PMC free article] [PubMed] [Google Scholar]
- 3. Bernard Stoecklin S, Rolland P, Silue Y, et al. First cases of coronavirus disease 2019 (COVID‐19) in France: surveillance, investigations and control measures, January 2020. Euro Surveill. 2020;25(6):1‐7. [DOI] [PMC free article] [PubMed] [Google Scholar]
- 4. European Centre for Disease Prevention and Control . Situation update as of 15 March 2020, 08:00. Distribution of COVID‐19 cases worldwide, as of 15 March 2020.
- 5. Liang XF, Feng ZJ, Li LM. Guidance for Corona Virus Disease 2019: Prevention, Control, Diagnosis and Management. BeiJing, China: People's Medical Publishing House; 2020:14‐17. [Google Scholar]
- 6. Zhou M, Guojun C, Ming G. Research status and progress of human coronavirus. Intl J Lab Med. 2020:1‐9. [Google Scholar]
- 7. Xiao SY, Wu Y, Liu H. Evolving status of the 2019 novel coronavirus infection: proposal of conventional serologic assays for disease diagnosis and infection monitoring. J Med Viral. 2020;92:464‐467. [DOI] [PMC free article] [PubMed] [Google Scholar]
- 8. Li Q, Guan X, Wu P, et al. Early transmission dynamics in Wuhan, China, of novel coronavirus infected pneumonia. N Engl J Med. 2020;382:1199‐1207. [DOI] [PMC free article] [PubMed] [Google Scholar]
- 9. Huang C, Wang Y, Li X, et al. Clinical features of patients infected with 2019 novel coronavirus in Wuhan, China. Lancet. 2020;395(10223):497‐506. [DOI] [PMC free article] [PubMed] [Google Scholar]
- 10. Health Emergency Office of National Health Commission of the PRC . Update on the epidemic of novel coronavirus (2019‐nCoV) infected pneumonia as at 24:00 on 24 March 2020.
- 11. Chan JFW, Yuan S, Kok KH, et al. A familial cluster of pneumonia associated with the 2019 novel coronavirus indicating person‐to‐person transmission: a study of a family cluster. Lancet. 2020;S0140‐S6736(20):30154‐30159. [DOI] [PMC free article] [PubMed] [Google Scholar]
- 12. Chen N, Zhou M, Dong X, et al. Epidemiological and clinical characteristics of 99 cases of 2019 novel coronavirus pneumonia in Wuhan, China: a descriptive study. Lancet. 2020;395(10223):507‐513. [DOI] [PMC free article] [PubMed] [Google Scholar]
- 13. Wang D, Hu B, Hu C, et al. Clinical characteristics of 138 hospitalized patients with 2019 novel coronavirus‐infected pneumonia in Wuhan, China. JAMA. 2020;323:1061. [DOI] [PMC free article] [PubMed] [Google Scholar]
- 14. Fang F, Luo XP. Facing the major epidemic of new corona‐virus infection in 2019: thinking of pediatricians. Chin J Pediatr. 2020;58(2):81‐85. [DOI] [PubMed] [Google Scholar]
- 15. Heurich A, Hofmann‐Winkler H, Gierer S, Liepold T, Jahn O, Pohlmann S. TMPRSS2 and ADAM17 Cleave ACE2 differentially and only proteolysis by TMPRSS2 augment sentry driven by the severe acute respiratory syndrome coronavirus spike protein. J Virol. 2014;88(2):1293‐1307. [DOI] [PMC free article] [PubMed] [Google Scholar]
- 16. Zhang PJ, Cao B, Liang XL, et al. Risk factors for adult death due to 2009 pandemic influenza A(H1N1)VIRUS infection: a 2151 severe and critical cases analysis. Chin Med J (Engl). 2013;126(12):2222‐2228. [PubMed] [Google Scholar]
- 17. Reyes S, Montull B, Martínez R, et al. Risk factors of A/H1N1 etiology in pneumonia and its impact on mortality. Respir Med. 2011;105(9):1404‐1411. [DOI] [PubMed] [Google Scholar]
- 18. Mamas MA, Fraser D, Neyses L. Cardiovascular manifestations associated with influenza virus infection. Int J Cardiol. 2008;130(3):304‐309. [DOI] [PubMed] [Google Scholar]
- 19. Warren‐Gash C, Smeeth L, Hayward AC. Influenza as a trigger for acute myocardial infarction or death from cardiovascular disease: a systematic review. Lancet Infect Dis. 2009;9(10):601‐610. [DOI] [PubMed] [Google Scholar]
- 20. Jin YH, Lin Cai, Cheng ZS, et al. Rapid recommendations for the diagnosis and treatment of novel coronavirus (2019‐nCoV) pneumonia. PLA Med J. 2020;45(1):1‐20. [Google Scholar]
- 21. Guan W, Ni Z, Hu Y, et al. Clinical characteristics of coronavirus disease 2019 in China. N Engl J Med. 2020;382:1708‐1720. [DOI] [PMC free article] [PubMed] [Google Scholar]
- 22. Huang C, Wang Y, Li X, et al. Clinical features of patients infected with 2019 novel coronavirus in Wuhan, China. Lancet. 2020;395(10223):497‐506. [DOI] [PMC free article] [PubMed] [Google Scholar]
- 23. Chung M, Bernheim A, Mei X, et al. CT imaging features of 2019 novel coronavirus (2019‐nCoV). Radiology. 2020;295:202‐207. [DOI] [PMC free article] [PubMed] [Google Scholar]