

Abstract
On 30th January 2020, an outbreak of atypical pneumonia caused by a novel betacoronavirus, named severe acute respiratory syndrome coronavirus 2 (SARS‐CoV‐2), was declared a public health emergency of international concern by the World Health Organization. For this reason, a detailed evolutionary analysis of SARS‐CoV‐2 strains currently circulating in different geographic regions of the world was performed. A compositional analysis as well as a Bayesian coalescent analysis of complete genome sequences of SARS‐CoV‐2 strains recently isolated in Europe, North America, South America, and Asia was performed. The results of these studies revealed a diversification of SARS‐CoV‐2 strains in three different genetic clades. Co‐circulation of different clades in different countries, as well as different genetic lineages within different clades were observed. The time of the most recent common ancestor was established to be around 1st November 2019. A mean rate of evolution of 6.57 × 10⁻⁴ substitutions per site per year was found. A significant migration rate per genetic lineage per year from Europe to South America was also observed. The results of these studies revealed an increasing diversification of SARS‐CoV‐2 strains. High evolutionary rates and fast population growth characterizes the population dynamics of SARS‐CoV‐2 strains.
Keywords: coalescent, coronavirus, evolution, SARS‐CoV‐2
Highlights
A phylogenetic analysis of SARS‐CoV‐2 strains isolated in four different geographic regions was performed.
Diversification of SARS‐CoV‐2 strains in three different genetic clades was observed.
Co‐circulation of different clades in different countries was also found.
Different genetic lineages were observed within different clades.
A significant migration rate per genetic lineage per year from Europe to South America was found.
1. INTRODUCTION
The family Coronaviridae consists of four genera, namely, alphacoronavirus, Betacoronavirus (βCoV), Gammacoronavirus, and deltacoronavirus. 1 Coronaviruses (CoVs) possess a single stranded, positive‐sense RNA genome ranging from 26 to 32 kilobases in length. 2 CoVs can infect humans and many different animal species, including swine, cattle, horses, camels, cats, dogs, rodents, birds, bats, rabbits, ferrets, and other wildlife animals. Although several CoVs can infect humans, many CoVs infections are subclinical. 2 Nevertheless, members of this family, like severe acute respiratory syndrome coronavirus (SARS‐CoV), a novel βCoV that emerged in southern China in 2002 3 and Middle East respiratory syndrome coronavirus, which was first detected in Saudi Arabia in 2012 4 are zoonotic pathogens that can cause severe respiratory disease in humans.
By December of 2019, in Wuhan, the capital city of Hubei province of the People's Republic of China, an outbreak of atypical pneumonia caused by a novel coronavirus (SARS‐CoV‐2) started. The outbreak appears to be related to a zoonotic transmission at a market in Wuhan where animals and meat were sold. 5
The World Health Organization declare this outbreak as a public health emergency of international concern on 30th January 2020 6 and the disease caused by this specific virus species have recently been designated as coronavirus disease 2019 (COVID‐19). 7 The coronavirus study group of the International Committee on Taxonomy of Viruses, formally recognized this virus as a relative to severe acute respiratory syndrome SARS‐CoVs and designated it as severe acute respiratory syndrome coronavirus 2: SARS‐CoV‐2. 8 As 12th April 2020, there have been more than 1.5 million confirmed cases and the global deaths of SARS‐CoV‐2 disease surpasses 100 000. 6
To gain insight into the emergence, spread, and evolution of SARS‐CoV‐2 populations, a Bayesian coalescent Markov Chain Monte Carlo analysis of complete genome sequences of SARS‐CoV‐2 strains recently isolated in different regions of the world (Europe, North America, South America, and South East Asia) was performed.
2. MATERIALS AND METHODS
2.1. Sequences
Available complete genome sequences of 64 SARS‐CoV‐2 strains recently isolated from 30th December 2019 to 9th March 2020 in Europe (including Netherland, Luxembourg, Switzerland, Ireland, France, Italy, Germany, Portugal, and England), North America (including USA, Canada and Mexico), South America (including Chile and Brazil), and South East Asia (including Hong Kong, Singapore, Japan, South Korea, Taiwan and China) were obtained from the Global Initiative on Sharing Avian Influenza Data (GISAID) database. For accession number, country of origin and date of isolation, see the Supplementary Material Table 1.
Table 1.
Bayesian coalescent inference of SARS‐CoV‐2 strains
| Groupa | Parameter | Valueb | HPD | ESS |
|---|---|---|---|---|
| SARS‐CoV‐2 full‐length | Posterior | −41307.31 | −41323.78 to −41219.28 | 1603.08 |
| Genome sequences | Prior | 171.88 | 118.75 to 218.29 | 248.06 |
| Likelihood | −41479.20 | −41471.57 to −41427.82 | 56639.35 | |
| tMRCAc | 128.11 | 83.11 to 195.64 | 363.69 | |
| 11/01/2019 | 08/26/1029 to 12/20/2019 | |||
| Mean rated | 6.57 × 10⁻⁴ | 9.23 × 10⁻⁴ to 2.47 × 10⁻⁴ | 57979.28 | |
| R 0 – Europee | 1.313 | 0.884 to 1.837 | 316.16 | |
| R 0 – North America | 1.133 | 0.890 to 1.450 | 350.11 | |
| R 0 – South America | 1.226 | 0.425 to 1.842 | 1632.04 | |
| R 0 – South East Asia | 1.136 | 0.998 to 1.334 | 409.58 | |
| Recovery ratef | 24.484 | 4.568 to 43.544 | 527.91 | |
| Europe‐North Americag | 0.550 | 2.04 × 10⁻⁴ to 1.679 | 1787.90 | |
| Europe‐South America | 1.821 | 1.83 × 10⁻³ to 4.344 | 2458.63 | |
| Europe‐South East Asia | 0.870 | 1.11 × 10⁻³ to 2.476 | 1331.36 | |
| North America‐Europe | 0.902 | 1.56 × 10⁻⁴ to 2.746 | 1748.09 | |
| North America‐South America | 0.872 | 3.88 × 10⁻⁵ to 2.675 | 1502.71 | |
| North America‐South East Asia | 0.880 | 1.03 × 10⁻³ to 2.663 | 776.87 | |
| South America‐Europe | 1.196 | 4.28 × 10⁻⁴ to 3.309 | 1138.00 | |
| South America‐North America | 0.719 | 2.84 × 10⁻⁵ to 2.332 | 1071.86 | |
| South America‐South East Asia | 0.838 | 1.28 × 10⁻⁴ to 2.573 | 1649.77 | |
| South East Asia‐Europe | 1.300 | 7.92 × 10⁻⁴ to 3.089 | 687.31 | |
| South East Asia‐North America | 1.319 | 9.01 × 10⁻⁴ to 3.105 | 798.09 | |
| South East Asia‐South America | 0.687 | 1.13 × 10⁻⁵ to 2.220 | 816.90 |
Abbreviations: ESS, effective sample size; HPD, highest posterior density; SARS‐CoV‐2, severe acute respiratory syndrome cor onvirus 2; tMRCA, time of the most recent common ancestor.
See the Supplementary Material Table 1 for strains included in this analysis.
In all cases, the mean values are shown.
tMRCA, shown in days. The date estimated for the tMRCA is indicated bellow.
Mean rate was calculated in substitutions per site per year.
The basic reproduction numbers for Europe, North America, South America, and South East Asia are shown, respectively.
The rates of recovery for a person with SARS‐CoV‐2 in any of the locations studied, in days.
Migration rate per lineage per year from one region to another.
2.2. Data analysis
Base composition of the 64 SARS‐CoV‐2 genomes were calculated using the MEGA‐X program. 9 The relationship between compositional variables and samples was obtained using multivariate statistical analyses. Principal component analysis (PCA) is a type of multivariate analysis that allows a dimensionality reduction. Singular value decomposition method was used to calculate PCA. Unit variance was used as scaling method. This means that all variables are scaled so that they will be equally important (variance = 1) when finding the components. As a result, a difference of one means that the values are one standard deviation away from each other. PCA analysis was done using the ClustVis program. 10
2.3. Bayesian coalescent Markov chain Monte Carlo analysis
To investigate the patterns of evolution of SARS‐CoV‐2 strains recently isolated in Europe, North America, South America, and South East Asia a Bayesian Markov Chain Monte Carlo (MCMC) approach was used as implemented in the BEAST package v2.5.2. 11 First, sequences were aligned using MAFFT version 7 program. 12 Then, the evolutionary model that best fit the sequence dataset was determined using MEGA‐X program. 13 Bayesian information criterion, Akaike information criterion, and the log of the likelihood, indicated that the HKY model was the most suitable model. Recent studies have demonstrated that the choose of the tree prior can upwardly bias the inferred clock rate and Bayesian phylogenetic analysis. 14 These studies also revealed that tree priors allowing for population structure lead to better estimates of emearging virus populations evolution. 14 For these reasons, we considered a population structured model using the multi‐type birth‐death model in these studies. Statistical uncertainty in the data was reflected by the 95% highest posterior density (HPD) values. Results were assessed using the TRACER program v1.6. 15 One hundred million generations were used after a burn‐in of 10 million steps, which were enough to acquire a suitable sample for the posterior, assessed by effective sample sizes with values over 200. The results were visualized using the DensiTree program. 16 DensiTree draws all the trees in the dataset simultaneously, but instead of using opaque lines, transparency is used when drawing the trees. For this reason, in areas where a lot of the trees agree on the topology and branch length there will be many lines drawn and the screen will show a densely colored area. 17
3. RESULTS
To gain insight into the composition and genetic heterogeneity among the 64 complete genomes of SARS‐CoV‐2 strains isolated all over the world, the nucleotide frequencies were determined for all of them. Mean values of 32.10%, 18.37%, 29.86%, and 19.65% were found for U, C, A, and G, respectively. Then, PCA was performed on nucleotide compositions frequencies for all strains enrolled in this analysis. The results of this study are shown in Figure 1. Positions of the strains in the plane conformed by PC1 and PC2 revealed that SARS‐CoV‐2 strains cluster separately in different positions in the plane. These results suggest a different genome composition among strains enrolled in this analysis (see Figure 1). In fact, PC1 tended to separate the red and blue clades (see Figure 1). This result also revealed a degree of heterogeneity among genomic composition of SARS‐CoV‐2 strains.
Figure 1.
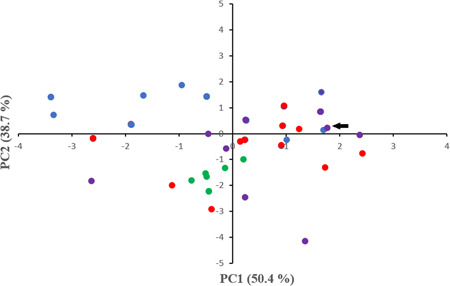
PCA of A, U, C, and G nucleotide frequencies in SARS‐CoV‐2 genomes. Position of the strains in the plane conformed by the first two major axes of PCA is shown. SVD was used to calculate principal components and unit variance was applied. The proportion of variance explained by each axis is shown between parentheses. Strain Wuhan/WH01/2019, isolated 26th December 2019 is indicated by a black arrow. Strains isolated in Europe, North America, South America, and South East Asia are shown in red, blue, green, and violet, respectively. N = 64 datapoints. PCA, principal component analysis; SARS‐CoV‐2, severe acute respiratory syndrome coronvirus 2; SVD, singular value decomposition
To address the degree of genetic variability and mode of evolution of the SARS‐CoV‐2 strains recently isolated in four different geographic regions of the world, a Bayesian MCMC approach was employed. 11 The results shown in Table 1 are the outcome of 100 million steps of the MCMC, using the HKY model, a relaxed molecular clock and a structured birth‐death model. The date of the most common recent ancestor to all SARS‐CoV‐2 strains was estimated around 1 November 2019 (95% HPD late‐August to late‐December 2019). A mean rate of evolution of 6.57 × 10⁻⁴ substitutions per site per year (s/s/y) was found for SARS‐CoV‐2 sequences included in these studies (95% HPD: 9.23 × 10⁻⁴ to 2.47 × 10⁻⁴ s/s/y). This is in agreement with very recent estimations performed at the beginning of the pandemic (7.8 × 10⁻⁴ s/s/y, 95% HPD: 1.1 × 10⁻⁴ to 15 × 10−4 s/s/y). 17
Evolutionary models recently developed permits to estimate epidemiological parameters based in the phylogeny of virus strains isolated in different geographic regions. Using a structured birth‐death population model it was possible to estimate the basic reproduction number (R 0) of SARS‐CoV‐2 strains for the four geographic regions studied (see Table 1). When a mean incubation period of 5 days and a recovery period of 14 days was considered (7), 95% HPD credible internals of R 0 of 0.88 to 1.83, 0.89 to 1.45, 0.42 to 1.84, and 0.99 to 1.33 were obtained for Europe, North America, South America, and South East Asia, respectively (Table 1). Comparison between the sampled population size marginal posterior distributions for the populations studied revealed no significant differences in R 0 among the four regions (see Figure 2). Upper 95% HPD values range from 1.33 to 1.83, revealing a mean R 0 of 1.58. The rate of recovery for a patient with SARS‐CoV‐2 was established in a mean of 23.48 days for any of the regions studied (Table 1).
Figure 2.
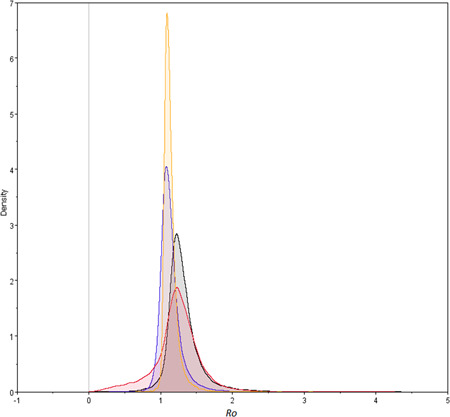
Marginal probability distribution of R 0 values. The marginal probability distribution for Europe, North America, South America, and South East Asia are shown in gray, blue, red, and yellow, respectively
The phylogenetic relationship among SARS‐CoV‐2 strains recently isolated in the four geographic regions of the world studied were explored and summarized in Figure 3. When the complete genome sequences of SARS‐CoV‐2 genomes were analyzed, three distinct genetic clades were found (see Figure 3). This result revealed a significant degree of genetic diversification of SARS‐CoV‐2 strains. Moreover, co‐circulation of strains from different genetic clades was observed in different countries (Figure 3).
Figure 3.
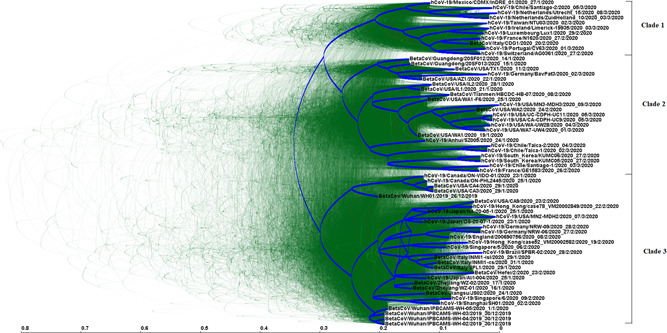
DensiTree analysis of complete genome sequences of SARS‐CoV‐2 strains recently isolated in four different geographic regions of the world. The results obtained using the HKY model, a relaxed exponential clock and a structured coalescent population model is shown. 5000 trees were drawn, shown in green. Root channel is shown in blue. The scale at the bottom is in units of evolutionary time and represents the years before the last sampling date. Strains in the tree are shown by name, followed by date of isolation (day/month/year). SARS‐C oV‐2, severe acute respiratory syndrome coronvirus 2
To study the circulation of virus lineages among the different geographic regions studied, the migration rate per genetic lineage per year was calculated for all regions (Table 1). As it can be seen, a significant rate of migration from Europe to South America was observed (Table 1).
To gain insight into the degree of genetic variation among the SARS‐CoV‐2 genetic clades observed, a detailed analysis of substitutions found throughout SARS‐CoV‐2 complete genome was performed. The results of these studies are shown in Table 2.
Table 2.
Substitutions in parsimony informative sites in SARS‐CoV‐2 genomesa
| Genomic region (ORF) | Nucleotide substitutions | Amino acid substitutions | Clade No.c | |||||
|---|---|---|---|---|---|---|---|---|
| Site | No.b | Type | Site | Type | Geographic location of isolation | |||
| 5‐Non coding region | 216 | 11 | c → t | ⋯d | ⋯ | Netherlands, Luxembourg, Switzerland, France, Portugal, Italy, Chile, Mexico, Taiwan | 1 | |
| 589 | 2 | g → a | 117 | A → T | USA | |||
| 1415 | 2 | g → a | 392 | G → D | Germany | |||
| 2886 | 2 | g → a | 876 | A → T | Germany | |||
| 3012 | 11 | c → t | ⋯ | ⋯ | Netherlands, Luxembourg, Switzerland, Ireland, France, Portugal, Italy, Chile, Mexico, Taiwan | 1 | ||
| 3021 | 2 | a → g | ⋯ | ⋯ | USA | |||
| 1a | 4377 | 2 | t → c | ⋯ | ⋯ | South Korea | ||
| 5037 | 2 | g → c | 1599 | L → F | South Korea | |||
| 5059 | 4 | a → c | 1607 | I → V | Canada, USA | |||
| 8757 | 22 | c → t | ⋯ | ⋯ | France, Germany, Chile, USA, South Korea, China | 2 | ||
| 9452 | 2 | t → a | 3071 | F → Y | France, Chile | |||
| 11058 | 6 | g → t | 3606 | L → F | Italy, Brazil, USA, Hong Kong | 3 | ||
| 14383 | 11 | c → t | 314 | P → L | Netherlands, Luxembourg, Switzerland, Ireland, France, Portugal, Italy, Chile, Mexico, Taiwan | |||
| 14780 | 3 | c → t | ⋯ | ⋯ | France, Brazil, Chile | |||
| 16442 | 2 | a → g | ⋯ | ⋯ | USA | |||
| 1b | 16950 | 2 | g → t | 1170 | V → F | USA | ||
| 17445 | 2 | c → t | ⋯ | ⋯ | Chile | |||
| 17722 | 6 | c → t | 1427 | P → L | USA | |||
| 17833 | 6 | a → g | 1464 | Y → C | USA | |||
| 18035 | 8 | c → t | ⋯ | ⋯ | USA | |||
| 23160 | 2 | c → t | ⋯ | ⋯ | USA | |||
| S | 23378 | 11 | a → g | 614 | D → G | Netherlands, Luxembourg, Switzerland, Ireland, France, Portugal, Italy, Chile, Mexico, Taiwan | 1 | (G) |
| 3a | 25954 | 2 | g → t | 196 | G → V | France, Chile | ||
| 26063 | 2 | c → t | ⋯ | ⋯ | Chile | |||
| 26119 | 6 | g → t | 251 | G → V | Italy, Brazil, Hong Kong, Singapore | 3 | (V) | |
| M | 27021 | 2 | c → t | 175 | T → M | Netherlands | ||
| 8 | 28119 | 24 | t → c | 84 | L → S | France, Germany, Chile, USA, South Korea, China | 2 | (S) |
| 28555 | 2 | g → t | 103 | D → Y | Chile | |||
| N | 28829 | 2 | c → t | ⋯ | ⋯ | France, Chile | ||
| 28838 | 5 | c → t | 194 | S → L | Canada, USA | 3 | ||
| N | 28838 | 2 | c → t | 197 | S → L | France, Chile | ||
| 28856‐8 4 | ggg→acc | 203‐204 RG → KR | Netherlands, Chile, Mexico | |||||
Abbreviations: GISAID, Global Initiative on Sharing Avian Influenza Data; ORF, Open reading frame; SARS‐CoV‐2, severe acute respiratory syndrome coronvirus 2.
Substitutions found in relation to SARS‐CoV‐2 strain βCov/Wuhan/WH01/2019 genome (accession number GISAID: EPI_ISL_406798).
No. refers to the number of strains carrying that substitution in the alignment.
Clade assignment is indicated when substitution is present in more than four or more strains in the alignment. S, G, an V clade names assignment by GISAID, accordingly to amino acid substitutions found in Orf 8, S, and 3a, respectively.
A synonymous substitution is shown by a dotted line (⋯).
The alignment of 64 complete genomes from SARS‐CoV‐2 strains isolated in four geographic regions of the world revealed 103 variable sites among all strains by comparison with SARS‐CoV‐2 strain BetaCov/Wuhan/WH01/2019 (accession number GISAID: EPI_ISL_406798), isolated in 26th December 2019. From these 103 sites, 32 of them were found to be parsimony informative. Substitutions were found in different genome regions (5′‐non coding region, 1a, 1b, S, 3a, M, 8, and N).
Clade 1 strains share the same substitutions in 5′‐non coding region, 1a, 1b, and S genes; while clade 2 strains share the same substitutions in 1a and 8 genes and clade 3 share the same substitutions in 1a and 3a genes (see Figure 3 and Table 2). While some substitutions are synonymous, others revealed amino acid changes (Table 2). Several other substitutions were observed in strains circulating in a particular country and co‐circulation of different variants in the same country was observed. Some of these particular substitutions were present in European and South American strains, suggesting a close genetic relation among themselves (see Table 2).
4. DISCUSSION
On 30th January 2020, the World Health Organization declared the current SARS‐CoV‐2 outbreak a public health emergency of international concern. 7
The rapid availability of research data on internet platforms, such as the GISAID permitted to perform detailed phylogenetic reconstruction of the origin, spread and evolution of SARS‐CoV‐2.
The results of this work revealed that SARS‐CoV‐2 viruses evolved from ancestors circulating around 1 November 2019, several weeks before the first cases were diagnosed (Table 1). This is in agreement with recent results establishing that the pandemic originated between October and November of 2019. 17 As many early cases of COVID‐19 were linked to the Huanan market in Wuhan, 18 it is possible that an animal source was present at this location. This is also in agreement with very recent estimations establishing the MCRA on 9 November 2019 19 and is consistent with the earliest retrospectively confirmed cases. 20 Taking all together, these studies revealed a period of unrecognized transmission in humans from the initial zoonotic event. 21 More studies will be needed to determine the extent of prior human exposure to SARS‐CoV‐2. 21
The evolutionary rate of SARS‐CoV‐2 strains enrolled in these studies was estimated to be 6.57 × 10⁻⁴ s/s/y (Table 1). This is in agreement with recent estimations at the beginning of the pandemic of 7.8 × 10⁻⁴ s/s/y. 17
Previous estimations by the WHO at the initial stage of the pandemic revealed a R 0 of 1.4 to 2.5. 22 Li and colleagues have estimated slightly higher values ranging from 1.4 to 3.9. 23 Very recent studies, assuming that SARS‐CoV‐2 would cause more mild‐to‐moderate cases than the ones produced by SARS virus, established a R 0 value of 2.0 for the former (95% HPD: 1.4‐2.3). 22 Since the R 0 values found in this study were estimated phylogenetically using 64 complete genomes of SARS‐CoV‐2 strains isolated in different regions of the world during a short sampling period (26th December 2019‐9th March 2020), the 95% HPD intervals are wider from the previous estimates. In addition, most countries implemented strategies to combat the virus, including quarantine and/or social isolation, which probably influenced in the R 0 values obtained at this stage of the pandemic. Nevertheless, the marginal probability distribution of R 0 values found for all regions studied cover the 95% HPD values of previous estimations. Moreover, no significant differences in R 0 among the four regions studied was found (Figure 2). Higher 95% HPD values revealed a mean of 1.58. Recent studies revealed that the majority of scenarios with an R 0 of 1.5 were controllable with less than 50% of contacts successfully traced. 24
Recent studies have provided evidence of the genetic diversity and rapid evolution of SARS‐CoV‐2 strains 25 and others have permitted to observe some clades sharing particular amino acid substitutions, like clade S (Orf 8, L84S); clade G (Orf S, D624G), and clade V (Orf3a, G251V). 26 On the other hand, many other strains were not assigned to specific clades. 26 In these studies, three clades were observed and co‐circulation of different clades in different countries was observed (see Figure 3). Moreover, co‐circulation of different clades was observed in different countries (see Figure 3 and Table 2). Particularly, several substitutions were shared by strains isolated in Europe and South America, revealing a close genetic relationship among them, and this is also in relation with the rate of migration of genetic lineages from Europe to South America (see Table 1). Besides, several substitutions, although they are synonymous substitutions, can be useful for monitor the spread of SARS‐CoV‐2 genetic lineages in different regions of the world (see Table 2).
Although the three clades observed in these studies are in agreement with recent studies permitting to assign several strains to clades S, G, and V, 26 several other substitutions have been observed (Table 2). Moreover, diversification over time inside different clades is also observed, particularly in clades 2 and 3. In clade 2, a clear lineage of strains isolated in China, USA, and Germany diversified from other strains of this clade. In clade 3, a lineage conformed by isolate Wuhan/WU01, isolated in Wuhan, China, as well as isolates from Canada and USA diverge from the rest of the strains assigned to this clade. Taking all together, these results revealed an increasing diversification of SARS‐CoV‐2 virus populations.
We hope the substitutions observed in SARS‐CoV‐2 strains will serve as a useful reference for development of treatment against SARS‐CoV‐2 disease and for public health agencies.
5. CONCLUSIONS
The results of these studies revealed the diversification of SARS‐CoV‐2 population in three different genetic clades. Inside different clades, different genetic lineages were observed highlighting an increasing diversification of SARS‐CoV‐2 viruses over time. Co‐circulation of different genetic clades were observed in several countries. Moreover, several substitutions were observed in strains isolated in the same country. The time of the most recent common ancestor of SARS‐CoV‐2 viruses was established to be around 1 November 2019, in agreement with the earliest retrospectively confirmed cases. The evolutionary rate of SARS‐CoV‐2 strains enrolled in these studies was estimated to be 6.57 × 10⁻⁴ s/s/y. A significant migration rate per genetic lineage per year from Europe to South America was also observed. No significant differences in R 0 among the four regions studied was found. High evolutionary rates and fast population growth characterizes the population dynamics of SARS‐CoV‐2 strains.
CONFLICT OF INTERESTS
The authors declare that there are no conflict of interests.
AUTHOR CONTRIBUTIONS
Writing: JC. Data collection: MC, FLT, and JC. Data analysis: MC, FLT, RC, and JC. Revision of manuscript: RC. All authors read and approved the final version of the manuscript before submission.
Supporting information
Supporting information
ACKNOWLEDGMENTS
This research was funded by Agencia Nacional de Investigación e Innovación and PEDECIBA, Uruguay. The author acknowledge Comisión Sectorial de Investigación Científica, Universidad de la República, Uruguay, for support through Grupos I + D grant. The author acknowledge Drs. Pilar Moreno and Gonzalo Moratorio for critical reading of this work. The authorsgratefully acknowledge the Originating and Submitting Laboratories for sharing newly identified coronavirus sequences through GISAID.
Castells M, Lopez‐Tort F, Colina R, Cristina J. Evidence of increasing diversification of emerging Severe Acute Respiratory Syndrome Coronavirus 2 strains. J Med Virol. 2020;92:2165–2172. 10.1002/jmv.26018
REFERENCES
- 1. Chen Y, Liu Q, Guo D. Emerging coronaviruses: genome structure, replication, and pathogenesis. J Med Virol. 2020;92:418‐423. 10.1002/jmv.25681 [DOI] [PMC free article] [PubMed] [Google Scholar]
- 2. Su S, Wong G, Shi W, et al. Epidemiology, genetic recombination, and pathogenesis of coronaviruses. Trends Microbiol. 2016;2:490‐502. 10.1016/j.tim.2016.03.003 [DOI] [PMC free article] [PubMed] [Google Scholar]
- 3. Peiris JS, Guan Y, Yuen KY. Severe acute respiratory syndrome. Nat Med. 2004;10:S88‐S97. 10.1038/nm1143 [DOI] [PMC free article] [PubMed] [Google Scholar]
- 4. Zaki AM, van Boheemen S, Bestebroer TM, Osterhaus AD, Fouchier RA. Isolation of a novel coronavirus from a man with pneumonia in Saudi Arabia. N Engl J Med. 2012;8:1814‐1820. 10.1056/NEJMoa1211721 [DOI] [PubMed] [Google Scholar]
- 5. Chan JFW, Yuan S, Kok KH, et al. A familial cluster of pneumonia associated with the 2019 novel coronavirus indicating person‐to‐person transmission: a study of a family cluster. Lancet. 2020;395:514‐523. 10.1016/S0140-6736(20)30154-9 [DOI] [PMC free article] [PubMed] [Google Scholar]
- 6. World Health Organization . 2020. Statement on the second meeting of the International Health Regulations (2005) Emergency Committee regarding the outbreak of novel coronavirus (2019‐nCoV). https://www.who.int. Accessed 26th February 2020.
- 7. World Health Organization . 2020. Coronavirus disease 2019 (COVID‐19) situation report—83. https://www.who.int/docs/default-source/coronaviruse/situation-reports/20200412-sitrep-83-covid-19.pdf?sfvrsn=697ce98d_4. Accessed 12th April 2020.
- 8. Gorbalenya AE, Baker SC, Baric RS, et al. Severe acute respiratory syndrome‐related coronavirus: the species and its viruses—a statement of the coronavirus study group. bioRxiv. 2020. 10.1101/2020.02.07.937862 [DOI] [Google Scholar]
- 9. Kumar S, Stecher G, Li M, Li M, Knyaz C, Tamura K. MEGA‐X: Molecular evolutionary genetics analysis across computing platforms. Mol Biol Evol. 2018;35:1547‐1549. 10.1093/molbev/msy096 [DOI] [PMC free article] [PubMed] [Google Scholar]
- 10. Metsalu T, Vilo J. Clustvis: a web tool for visualizing clustering of multivariate data using principal component analysis and heatmap. Nucleic Acids Res. 2015;43(W1):W566‐W570. 10.1093/nar/gkv468 [DOI] [PMC free article] [PubMed] [Google Scholar]
- 11. Bouckaert R, Vaughan TG, Barido‐Sottani J, et al. BEAST 2.5: an advanced software platform for Bayesian evolutionary analysis. PLoS Comput Biol. 2019;15:e1006650. 10.1371/journal.pcbi.1006650 [DOI] [PMC free article] [PubMed] [Google Scholar]
- 12. Katoh K, Rozewicki J, Yamada KD. MAFFT online service: multiple sequence alignment, interactive sequence choice and visualization. Brief. Bioinfor. 2019;4:1160‐116. 10.1093/bib/bbx108 [DOI] [PMC free article] [PubMed] [Google Scholar]
- 13. Kumar S, Stecher G, Li M, Knyaz C, Tamura K. MEGA‐X: Molecular evolutionary genetics analysis across computing platforms. Mol Biol Evol. 2018;35:1547‐1549. 10.1093/molbev/msy096 [DOI] [PMC free article] [PubMed] [Google Scholar]
- 14. Moller S, du Plessis L, Tanja Stadler T. Impact of the tree prior on estimating clock rates during epidemic outbreaks. Proc Natl Acad Sci USA. 2018;115:4200‐4205. 10.1073/pnas.1713314115 [DOI] [PMC free article] [PubMed] [Google Scholar]
- 15. Rambaut A, Drummond AJ, Xie D, Baele G, Suchard MA. Posterior summarization in Bayesian phylogenetics using Tracer 1.7. Syst Biol. 2018;65:901‐904. 10.1093/sysbio/syy032 [DOI] [PMC free article] [PubMed] [Google Scholar]
- 16. Bouckaert RR. DensiTree: making sense of phylogenetic trees. Bioinformatics. 2018;26:1372‐1373. 10.1093/bioinformatics/btq110 [DOI] [PubMed] [Google Scholar]
- 17. Lai A, Bergna A, Acciarri C, Galli M, Zehender G. Early phylogenetic estimate of the effective reproduction number of SARS‐CoV‐2. J Med Virol. 2020;92:1‐5. 10.1002/jmv.25723 [DOI] [PMC free article] [PubMed] [Google Scholar]
- 18. Chan JFW, Kok KH, Zhu Z, et al. Genomic characterization of the 2019 novel human‐pathogenic coronavirus isolated from a patient with atypical pneumonia after visiting Wuhan. Emerg. Microbes Infec. 2020;9:21‐236. 10.1080/22221751.2020.1719902 [DOI] [PMC free article] [PubMed] [Google Scholar]
- 19. Li X, Zai J, Wang X, Li Y. Potential of large “first generation” human‐to‐human transmission of 2019‐nCoV. J Med Virol. 2020;92:448‐454. 10.1002/jmv.25693 [DOI] [PMC free article] [PubMed] [Google Scholar]
- 20. Huang C, Wang Y, Li X, et al. Clinical features of patients infected with 2019 novel coronavirus in Wuhan, China. Lancet. 2020;395:497‐506. 10.1016/S0140-6736(20)30183-5 [DOI] [PMC free article] [PubMed] [Google Scholar]
- 21. Andersen KG, Rambaut A, Lipkin WI, Holmes EC, Garry RF. The proximal origin of SARS‐CoV‐2. Nat Med. 2020;26:450‐452. 10.1038/s41591-020-0820-9 [DOI] [PMC free article] [PubMed] [Google Scholar]
- 22. Tang B, Bragazzi NL, Li Q, Tang S, Xiao Y, Wu J. An updated estimation of the risk of transmission of the novel coronavirus (2019‐nCov). Infec. Dis. Model. 2020;5:248‐255. 10.1016/j.idm.2020.02.001 [DOI] [PMC free article] [PubMed] [Google Scholar]
- 23. Li Q, Guan X, Wu P, et al. Early transmission dynamics in Wuhan, China, of novel coronavirus‐infected pneumonia. N Engl J Med. 2020;382:1199‐1207. 10.1056/NEJMoa2001316 [DOI] [PMC free article] [PubMed] [Google Scholar]
- 24. Hellewell J, Abbott S, Gimma A, et al. Feasibility of controlling COVID‐19 outbreaks by isolation of cases and contacts. Lancet Glob Health. 2020;8:e488‐e496. 10.1016/S2214-109X(20)30074-7 [DOI] [PMC free article] [PubMed] [Google Scholar]
- 25. Phan T. Genetic diversity and evolution of SARS‐CoV‐2. Infect Genet Evol. 2020;81:104260. 10.1016/j.meegid.2020.104260 [DOI] [PMC free article] [PubMed] [Google Scholar]
- 26. GISAID . 2020. Available at: https://www.epicov.org/epi3/cfrontend#lightbox-491746793. Accessed 10 April 2020.
Associated Data
This section collects any data citations, data availability statements, or supplementary materials included in this article.
Supplementary Materials
Supporting information