Abstract
Purpose
The coronavirus disease 2019 (COVID-19) pandemic has led to significant disruptions in the healthcare system including surges of infected patients exceeding local capacity, closures of primary care offices, and delays of non-emergent medical care. Government-initiated measures to decrease healthcare utilization (i.e., “flattening the curve”) have included shelter-in-place mandates and social distancing, which have taken effect across most of the USA. We evaluate the immediate impact of the Public Health Messaging and shelter-in-place mandates on Emergency Department (ED) demand for radiology services.
Methods
We analyzed ED radiology volumes from the five University of California health systems during a 2-week time period following the shelter-in-place mandate and compared those volumes with March 2019 and early April 2019 volumes.
Results
ED radiology volumes declined from the 2019 baseline by 32 to 40% (p < 0.001) across the five health systems with a total decrease in volumes across all 5 systems by 35% (p < 0.001). Stratifying by subspecialty, the smallest declines were seen in non-trauma thoracic imaging, which decreased 18% (p value < 0.001), while all other non-trauma studies decreased by 48% (p < 0.001).
Conclusion
Total ED radiology demand may be a marker for public adherence to shelter-in-place mandates, though ED chest radiology demand may increase with an increase in COVID-19 cases.
Electronic supplementary material
The online version of this article (10.1007/s10140-020-01797-y) contains supplementary material, which is available to authorized users.
Keywords: COVID-19, Coronavirus, ER, Trauma, Healthcare utilization, Predictive model
Introduction
The coronavirus disease 2019 (COVID-19) is an infectious disease caused by the Severe Acute Respiratory Syndrome Coronavirus 2 (SARS-CoV-2) [1]. The first reported cases were diagnosed in Wuhan, China, in December 2019. Rapid worldwide spread led to a World Health Organization declaration of pandemic on March 11, 2020 [2]. On March 27, 2020, the USA surpassed China as the country with the most confirmed cases [3]. With a growing number of COVID-19 cases by mid-March 2020, US hospitals quickly began rigorous efforts to prepare for an exponential increase in COVID-19-related patient visits.
Anticipating this strain on the healthcare system, the US federal government gave recommendations on March 16, 2020, to “work or engage in schooling from home whenever possible,” to reduce interhuman contact and the spread of COVID-19 [4]. On March 19, 2020, the California department of public health and governor issued a shelter-in-place order for all individuals to “stay home or at their place of residence, except as needed to maintain continuity of operation of the federal critical infrastructure sectors” [5]. The San Francisco and Bay area of California undertook a similar shelter-in-place mandate on March 16, 2020. Despite these self-isolation guidelines, COVID-19-related resource usage is still projected to peak around May 2020 in some US states [6].
Emergency Departments (EDs) have been a focal point in the discussion regarding healthcare utilization, with a 2006 survey demonstrating a 36% increase in ED utilization over a 10-year period (1996–2006) [7]. ED wait times and crowding have prompted substantial research into understanding the trends of ED usage and the impact on patient safety and public health [8, 9]. The ability to model the ED census is crucial to enhance operational efficiency and to develop hospital management strategies allowing optimal healthcare resource allocation [10].
At the same time, anecdotal preliminary data has shown that radiology practices should see a 50–70% decrease in study volume that will last for at least 3–4 months as the social distancing orders and suspension of activities have reduced the number of traumas including traffic collisions and violent crime [11]. Stay-at-home orders have also minimized the spread of other communicable diseases such as the flu. In addition, fear of contracting the coronavirus has also decreased admission rates for common emergencies such as strokes and heart attacks [12]. Previous reports state that the COVID-19 pandemic is expected to alter Radiology practices both in the short- and long-term, including longer workdays and staggered shifts to meet demand [11].
The objective of this article is to review the immediate impact of COVID-19-related shelter-in-place public health measures on the demand for ED radiology services. This review assesses ED radiological study volumes during the shelter-in-place time period as an initial forecast for improved radiology resource utilization, in anticipation of evolving healthcare resource allocation needs due to the COVID-19 pandemic.
Methods:
All five of the University of California Health Centers with academic radiology programs—San Francisco, Davis, Los Angeles, Irvine, and San Diego (UCSF, UCD, UCLA, UCI, and UCSD, respectively)—participated in this study. These health centers are tertiary-level teaching medical centers with busy emergency departments. UCD, UCLA, UCI, and UCSD also serve as regional level 1 trauma centers. Each health center enumerated all radiological studies ordered from their Emergency Departments, utilizing a variety of tools including mPower Clinical Analytics (Nuance, Burlington, MA), Tableau (Salesforce, San Francisco, CA) with a homegrown radiology data warehouse, and the Epic Systems (Verona, WI) electronic health record software. The daily volumes of ED radiologic examinations were assessed for the following periods: March 4, 2019 (first Monday in March 2019) to April 4, 2019 (first Thursday in April 2019); March 19, 2020 (first day of statewide shelter-in-place) to April 2, 2020. The dates in 2019 were chosen to account for weekday and weekend variability of our control (2019) cohort to the post shelter-in-place cohort. Descriptive statistics and unpaired t tests on SPSS (IBM, Anrock, NY) were performed to compare mean daily volumes from 2019 and the 2 weeks following the shelter-in-place mandate on March 19 to April 2, 2020.
All modalities including magnetic resonance imaging, computed tomography, radiography, fluoroscopy, and ultrasonography were assessed. Nuclear medicine and interventional studies ordered from the ED were negligible (< 0.2%), and so were excluded. Study volumes were stratified by subspecialty except for UCLA, where this information was unavailable. Data from UCLA, UCI, and UCD were further stratified as trauma or non-trauma studies. Trauma status was unavailable for UCSD; UCSF Health hospitals do not include trauma centers.
Investigations were compliant with IRB policies at each campus. Please see Appendix A for details.
Results
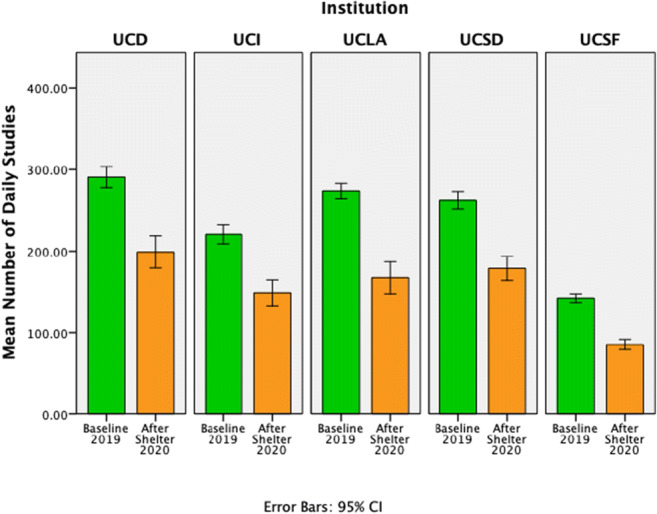
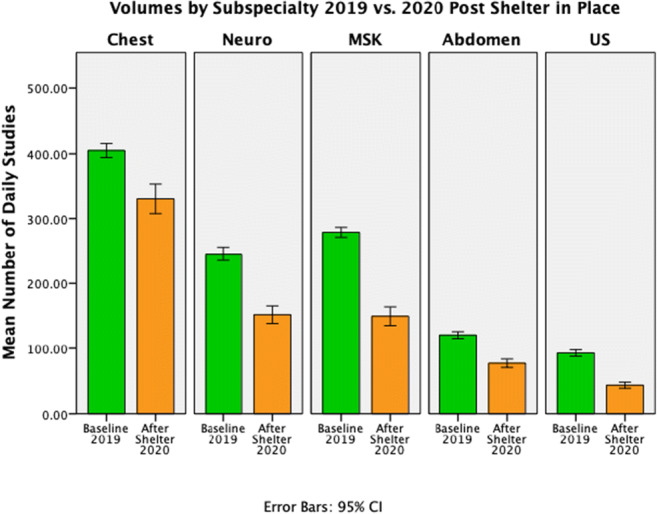
Daily radiology study volumes from all UC health centers decreased from March 19 to April 2, 2020 compared with March and early April in 2019 daily volumes. The decrease in daily ED Radiology volume ranged from 32–40% with (p < 0.001 for each campus) (Fig. 1) with a total decrease in volume across all 5 systems by 35% (p < 0.001). While study volumes for each subspecialty significantly decreased in 2020 compared with that of 2019 (p < 0.001), the magnitude of decrease varied by subspecialty. Chest study volume only decreased by 19% compared with decreases of 53% for ultrasound, 36% for abdominal, 46% for musculoskeletal, and 38% for neuroradiology (Fig. 2).
Fig. 1.

Daily mean ED study volumes significantly decreased at all five UC medical centers during the 2 weeks following the government-mandated shelter-in-place order compared with 2019 baseline. Error bars represent 95% confidence intervals
Fig. 2.

Daily mean ED study volumes by subspecialty aggregated for all five UC medical centers significantly decreased during the 2 weeks following the government-mandated shelter-in-place order compared with 2019 baseline. Error bars represent 95% confidence intervals
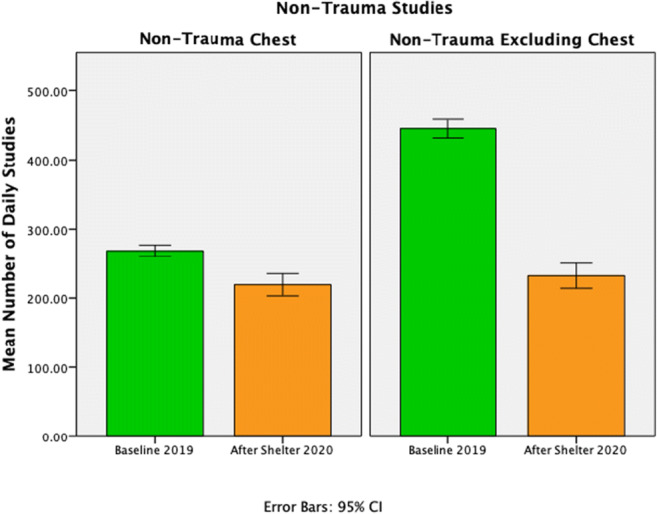
Overall trauma-related ED imaging volume decreased by 30% aggregated for Irvine, Los Angeles and Davis (p < 0.001). The non-trauma chest subspecialty volumes decreased by 18% (p < 0.001) when compared with baseline 2019. All other non-trauma studies excluding chest decreased by 48% (p < 0.001) when compared with baseline 2019 (Fig. 3).
Fig. 3.

Daily mean ED non-trauma chest and all other non-trauma volumes aggregated across four UC medical centers (UCSF, UCD, UCLA, UCI), significantly decreased by 18% and 48% respectively during the 2 weeks following the 2 weeks following the government-mandated shelter-in-place order compared with 2019 baseline. Error bars represent 95% confidence intervals
Discussion
Radiologic study volumes in the ED decreased after statewide shelter-in-place orders were announced in California in comparison with baseline daily mean volumes from 2019. Decreased ED study volumes may be a marker for the success of public health messaging regarding the morbidity and mortality of COVID-19 as well as state-mandated shelter-in-place protocols, which were enacted in part to reduce patient load on healthcare facilities. The similar data from multiple tertiary teaching hospitals in California show a statistically significant decrease in overall ED radiologic studies for the first week after the mandated self-isolation restriction compared with a time-matched control 1 year prior.
Both total- and trauma-related mean daily study volumes showed a statistically significant decline compared with our time-matched control (32% and 30% respectively). Due to social distancing and the temporary closure of non-essential businesses, we hypothesize that fewer people are venturing outdoors and driving, resulting in fewer accidents and risky or hazardous behaviors that can lead to trauma.
Given that COVID-19 is a respiratory illness, unsurprisingly, the non-trauma chest study volumes decreased the least compared with other non-trauma subspecialties (18% vs. 48%). The lesser decline in chest imaging volumes is likely due to raised public awareness of COVID-19 respiratory consequences. Additionally, patients with respiratory symptoms, who would under normal circumstances have stayed home, may now present to the ED to be screened. Moreover, emergency medicine providers are on high alert for COVID-19, and patients presenting to the ED with respiratory symptoms might be more likely to receive chest imaging given this heightened awareness.
Accurately forecasting the demand for healthcare resources is a complex process involving many variables. These forecasts can be utilized in staffing, space, and equipment models for resource utilization across a healthcare system [13]. Our data shows a consistent decrease in ED radiologic studies across multiple academic tertiary institutions following statewide government–mandated self-isolation protocol and consistent decreases in trauma imaging volumes, suggesting decreased demands on the emergency healthcare system. This decrease in non-COVID-19-related utilization may mitigate some of the increased demands on the system from COVID-19.
Initial forecasting based on this data suggests that while the mandated isolation protocols are in place and rates of infection in the surrounding communities are low, ED utilization of radiology services may remain lower than prior years, including trauma volume. In communities with high prevalence of COVID-19, chest imaging utilization may increase. While the decrease in trauma imaging utilization likely reflects a true decrease in the underlying trauma volumes, decreases in non-trauma imaging utilization require more complex analysis. We would not expect a true decrease in the symptoms or severity of the variety of general medical conditions that lead to ED visits, such as bowel obstruction, appendicitis and other acute inflammatory processes, and stroke. Thus, the decrease in non-trauma utilization may mean that patients who otherwise would have presented to the ED are not presenting, perhaps for fear of contagion. Additionally, given the historical rise in the unemployment rate [14], many people have lost their employer-sponsored health insurance, and may not be presenting to the ED for both lack of health insurance coverage and financial reasons related to job loss. These patients may present in the near future with more advanced symptoms and underlying pathologies than in the past. Continuous monitoring of volumes and disease severity upon ED presentation will be important in predicting demand for radiology services and understanding the secondary effects of shelter-in-place orders.
Our work is an initial analysis of ED radiology volumes from a short period of time. As such, it is limited in scope. There is a limitation due to variations in year over year radiology volumes, which may be superimposed on the COVID-19-related changes to the ED radiology volumes. However, for the past 3 years, 4 of the 5 UCs have reported average volume increases ranging from 5 to 10%/year. Our comparison with last year’s volumes does not assume any growth, and as such, this limitation likely biases our reported volume decreases to be smaller rather than larger. Another limitation in our study may be related to variability in shelter-in-place policies by region. San Francisco and the Bay area of California began shelter-in-place protocols 3 days prior to the rest of California, and this may have affected the demand for ED radiology services differently than at the other health centers. We also did not measure daily ED radiology volumes in March for other years besides 2019 to assess for year to year volume variations and trajectories. We did not assess ED visit volumes during the timespan of our study and cannot make correlations between ED radiology volumes and ED visit volumes. We also do not account for the amount of regional COVID cases present during our study, which would have a powerful potential impact on the number of patients presenting to the ED and requiring radiology services.
While the literature contains forecasting models for predicting healthcare demand, none addresses demand for radiology services in situations similar to the current COVID-19 pandemic and self-isolation measures. Continued evaluation of radiology utilization over the next few weeks to months is needed to improve forecasting capabilities and accuracy. Another important follow-up study will be to evaluate the number of patients with more advanced symptoms and pathologies that present in the future after the public health crisis.
Electronic Supplementary Material
(DOCX 21.4 kb)
Compliance with ethical standards
Conflict of interest
The authors declare that they have no conflict of interest.
Footnotes
Publisher’s note
Springer Nature remains neutral with regard to jurisdictional claims in published maps and institutional affiliations.
References
- 1.Wu P, Hao X, Lau EHY, Wong JY, Leung KSM, Wu JT, Cowling BJ, Leung GM (2020) Real-time tentative assessment of the epidemiological characteristics of novel coronavirus infections in Wuhan, China, as at 22 January 2020. Euro Surveill. 25. 10.2807/1560-7917.ES.2020.25.3.2000044 [DOI] [PMC free article] [PubMed]
- 2.Huang C, Wang Y, Li X, Ren L, Zhao J, Hu Y, Zhang L, Fan G, Xu J, Gu X, Cheng Z, Yu T, Xia J, Wei Y, Wu W, Xie X, Yin W, Li H, Liu M, Xiao Y, Gao H, Guo L, Xie J, Wang G, Jiang R, Gao Z, Jin Q, Wang J, Cao B. Clinical features of patients infected with 2019 novel coronavirus in Wuhan, China. Lancet. 2020;395:497–506. doi: 10.1016/S0140-6736(20)30183-5. [DOI] [PMC free article] [PubMed] [Google Scholar]
- 3.Dong E, Du H, Gardner L. An interactive web-based dashboard to track COVID-19 in real time. Lancet Infect Dis. 2020;20:533–534. doi: 10.1016/S1473-3099(20)30120-1. [DOI] [PMC free article] [PubMed] [Google Scholar]
- 4.The President’s Coronavirus Guidelines for America. https://www.whitehouse.gov/wp-content/uploads/2020/03/03.16.20_coronavirus-guidance_8.5x11_315PM.pdf. Accessed 3 Apr 2020
- 5.Order of the State Public Health Officer (Stay home except for essential needs). https://www.cdph.ca.gov/Programs/CID/DCDC/CDPH Document Library/COVID-19/Health Order 3.19.2020.pdf. Accessed 3 Apr 2020
- 6.COVID-19 Projections. https://covid19.healthdata.org/projections. Accessed 3 Apr 2020
- 7.LaCalle E, Rabin E. Frequent users of emergency departments: the myths, the data, and the policy implications. Ann Emerg Med. 2010;56:42–48. doi: 10.1016/j.annemergmed.2010.01.032. [DOI] [PubMed] [Google Scholar]
- 8.Wargon M, Guidet B, Hoang TD, Hejblum G. A systematic review of models for forecasting the number of emergency department visits. Emerg Med J. 2009;26:395–399. doi: 10.1136/emj.2008.062380. [DOI] [PubMed] [Google Scholar]
- 9.Trzeciak S, Rivers EP. Emergency department overcrowding in the United States: an emerging threat to patient safety and public health. Emerg Med J. 2003;20:402–405. doi: 10.1136/emj.20.5.402. [DOI] [PMC free article] [PubMed] [Google Scholar]
- 10.Asplin BR, Magid DJ, Rhodes KV, Solberg LI, Lurie N, Camargo CA., Jr A conceptual model of emergency department crowding. Ann Emerg Med. 2003;42:173–180. doi: 10.1067/mem.2003.302. [DOI] [PubMed] [Google Scholar]
- 11.Cavallo JJ, Forman HP. The economic impact of the COVID-19 pandemic on radiology practices. Radiology. 2020;15:201495. doi: 10.1148/radiol.2020201495. [DOI] [PMC free article] [PubMed] [Google Scholar]
- 12.Krumholz H. Where have all the heart attacks gone? New York: Times; 2020. [Google Scholar]
- 13.Côté MJ, Smith MA. Forecasting the demand for radiology services. Health Syst (Basingstoke, England) 2018;7:79–88. doi: 10.1080/20476965.2017.1390056. [DOI] [PMC free article] [PubMed] [Google Scholar]
- 14.U.S. Bureau of Labor Statistics Labor Force Statistics from the Current Population Survey. https://data.bls.gov/timeseries/LNS14000000. Accessed 18 Apr 2020
Associated Data
This section collects any data citations, data availability statements, or supplementary materials included in this article.
Supplementary Materials
(DOCX 21.4 kb)


