

Abstract
Background and Aim
Inflammatory bowel diseases (IBD) are chronic inflammatory conditions of the gut resulting in a significant risk for malnutrition. The reported prevalence of malnutrition in inflammatory disease patients varies from 5.7 to 82.8%. The aim of this study was to measure the prevalence of malnutrition and its association with quality of life (QOL) in a cohort of Australian IBD outpatients.
Methods
A total of 107 consecutive patients (68 Crohn's disease, 35 ulcerative colitis, 4 indeterminate colitis) were enrolled in this cross‐sectional study. Demographic data were collected, and patients underwent a malnutrition assessment using the patient‐generated subjective global assessment. The RAND 36‐item health survey was used to measure QOL.
Results
Mild to moderate malnutrition was detected in 17 patients (16%). Malnourished patients were more likely to be underweight (P ≤ 0.01), have active disease (P ≤ 0.01), and have been admitted to hospital in the preceding 12 months (P ≤ 0.05). Malnourished patients had a significantly lower QOL in physical (P ≤ 0.01) and mental (P ≤ 0.01) health components. Patients with active or recently active disease had reduced QOL compared to patients in remission. Malnutrition factors predictive of poor physical health‐related QOL were pain (odds ratio [OR] = 12.8, 95% confidence interval [CI] 2.0–80.4) and unintentional weight loss (OR = 3.1 per kg lost, 95% CI 1.2–7.9). The predictor of poor mental health‐related QOL was early satiety (OR = 7.7, 95% CI 1.7–33.9).
Conclusions
The malnutrition prevalence for this population was 16%. Malnutrition was associated with being underweight, active disease, and increased number of hospital admissions. Disease activity and malnutrition were associated with poorer QOL.
Keywords: Crohn's disease, inflammatory bowel disease, malnutrition, quality of life, ulcerative colitis
In an outpatient cohort of inflammatory bowel disease patients, we found a malnutrition prevalence of 16%. Malnutrition was associated with being underweight, active disease, and an increased number of hospital admissions and was associated with poorer quality of life.
Introduction
Inflammatory bowel diseases (IBD) include Crohn's disease (CD), ulcerative colitis (UC), and indeterminate colitis (IC). The incidence of IBD varies considerably across the globe1; however, Australia has one of the highest reported prevalence (300–350/100 000) and incidence (29.6/100 000) rates of IBD in the world.2 The relapsing and remitting course and chronic nature of IBD means patients frequently deal with uncomfortable symptoms and side effects of medications, which can lead to lower quality of life (QOL).3 Higher IBD disease activity increases the risk that patients will suffer poorer QOL4, 5 and the likelihood of developing malnutrition.
Patients with IBD have an elevated risk of malnutrition. The etiology of malnutrition in IBD is multifactorial, resulting from a loss of appetite, poor digestion or malabsorption, and side effects of medication.6 Loss of appetite in patients with IBD may result from feelings of nausea, diarrhea, postprandial pain, or general abdominal discomfort.7, 8, 9, 10, 11 Nutritional deficiencies can occur early in the disease course and may be clinically apparent at the time of diagnosis,12 with protein–energy malnutrition being the most common.13 Malnutrition in IBD is associated with deterioration in muscle mass and respiratory and immune function, delayed wound healing, and lengthened recovery from illness.3, 9, 14 Malnutrition in IBD has also been associated with longer hospitalization, higher health‐care utilization, and increased mortality rates.14 IBD disease activity impacts a number of the mechanisms in the pathophysiology of malnutrition, including metabolic disturbances associated with chronic inflammation, protein‐losing enteropathy and chronic blood loss, malabsorption, and side effects of medication.15
The prevalence of malnutrition in the Australian IBD population has not previously been reported. Internationally, the prevalence varies significantly from 5.716 to 82.8%.3 The patient generated subjective global assessment (PG‐SGA) is a validated dietetic tool for defining malnutrition.17, 18, 19 The PG‐SGA encompasses several components, including recent weight change, change in food intake, nutrition impact symptoms, physical functioning, metabolic stress, and physical signs of malnutrition, to determine current nutrition status. These parameters make the PG‐SGA well suited for detecting malnutrition in IBD. As weight and nutrition status are likely to fluctuate relative to disease activity in IBD, the inclusion of short‐term unintentional weight loss, reduction in food intake, and nutrition impact symptoms are beneficial. The physical assessment determines the extent of muscle wasting, loss of subcutaneous fat stores, and the presence of edema or ascites. The metabolic stress parameter is particularly relevant due to the common prescription of steroids during active disease. In addition, measuring the functional status of IBD patients is relevant as this may vary depending on disease activity.
Several factors have been identified that influence QOL in IBD, including disease activity, psychological status, fatigue, illness perceptions, coping strategies, social support, hospitalizations, and quality of care.4, 5, 20, 21, 22, 23, 24, 25 QOL is a measure of the functional impact of a chronic illness and its therapy on the daily life of an individual as seen from that individual's perspective.26 The chronic nature of IBD places a significant amount of stress on patients and their families, which consequently lowers QOL.27
The RAND 36‐Item Health Survey (RAND‐36), also known as the Medical Outcomes Study 36‐Item Short‐Form Health Survey (SF‐36),28 is a widely used measure of QOL across multiple illnesses. The RAND‐36 assesses eight health scales: general health, physical functioning, role limitations due to physical health problems, emotional well‐being, role limitations due to emotional problems, energy/fatigue, social functioning, and pain, as well as perceived change in health over one year.29
The aim of this study was to measure the prevalence of malnutrition and determine its association with QOL in a cohort of IBD patients at an Australian outpatient IBD clinic.
Methods
Patient population
Data were collected as part of a larger cross‐sectional observational study conducted on Australian IBD outpatients. The study flow chart is shown in Figure 1. Patients were included if they had a confirmed diagnosis of CD, UC, or IC for longer than 3 months; had their usual IBD specialist outpatient appointment during the data collection period; and were fluent in English. Exclusion criteria were age younger than 18 years, cognitive impairment, or vulnerability as determined by the patient's treating clinician.
Figure 1.
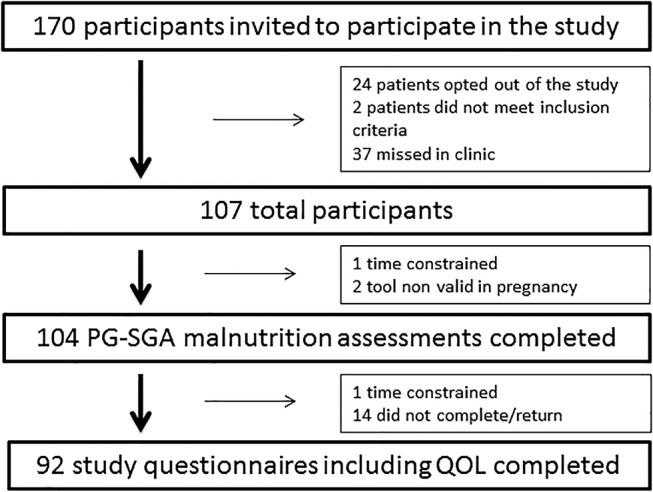
Study flow chart. IBD, inflammatory bowel disease; PG‐SGA, patient generated subjective global assessment; QOL, quality of life.
Potential patients were provided study information. Upon receipt of written consent, a trained dietitian performed the PG‐SGA, and the patient completed the study questionnaire.
Patient‐generated subjective global assessment
The PG‐SGA17, 18, 19 was used to determine the prevalence and severity of malnutrition. Patients were classified as well‐nourished (PG‐SGA = A), moderately or suspected as malnourished (PG‐SGA = B), or severely malnourished (PG‐SGA = C). The PG‐SGA also provides an additive score used to define specific nutritional interventions required. Patients were scored and categorized as follows: 0–1, no intervention required at present; 2–3, education by dietitian or clinician based on symptom management; 4–8, intervention by dietitian indicated with physician consultation; and ≥9, critical need for dietary intervention and symptom management. Patients identified as malnourished or with a score requiring symptom management or nutrition intervention were referred to a dietitian as part of routine care.
This PG‐SGA included collection of height and weight, allowing calculations of body mass index (BMI). Patients aged 18–64.9 years were classified into underweight (<18.5 kg/m2), healthy weight (18.5–24.9 kg/m2), overweight (25–29.9 kg/m2), and obese (≥30 kg/m2) categories, with those ≥65 years classified as underweight (<23 kg/m2), healthy weight (24–30 kg/m2), and overweight (>30 kg/m2).30 This facilitated comparisons of malnourished and well‐nourished patients based on their BMI category.
Study questionnaire including the RAND‐36
Patient demographic data, including IBD diagnosis, disease location, disease activity, disease duration, IBD‐related hospital admissions and surgery in the past 12 months, medications, and use of oral nutrition supplementation, were self‐reported and collected from the study questionnaire. A clinical gastroenterologist validated self‐reported IBD diagnosis and disease activity. The RAND‐36 survey28, 29, 31 was included in the study questionnaire. Each health scale is scored to represent a percentage of the total possible score achieved, where 0 indicates poor health and 100 optimal health. Physical component summary (PCS) and mental component summary (MCS) scores were calculated using the method described by Tucker et al.32 and normed to the Australian population (mean 50, SD 10). This allowed comparison between the eight QOL domains of the IBD patients and the average scores of the Australian population. QOL domains were compared between well‐nourished and malnourished patients, as well as between those with active or recently active IBD and those in remission.
Statistical analysis
Continuous variable distributions were assessed. Parametric data were reported as mean ± SD, with difference between means assessed using an independent sample t‐test. Nonparametric data are reported as median and interquartile range, with differences assessed using a Mann–Whitney U test. All correlations were assessed using Spearman's Rank Correlation. Categorical data are reported as number and percentages, and chi square or Fisher's exact test was conducted where cell counts were less than 5, and Z tests were conducted for proportions. Univariate and multivariable logistic regressions were used to calculate odds ratios [OR].
Malnutrition was investigated using weight loss in the past month, food intake, poor appetite, early satiety, diarrhea, physical function, presence of metabolically demanding conditions, and physical signs of malnutrition entered into a multivariable logistic regression, and model selection was performed using the backward Wald method with a 0.05 cut‐off. The areas under the receiver operating characteristic (ROC) curves were calculated on the final model.
Unintentional weight loss in the last month, no appetite, pain, number of hospital admissions in the last 12 months, and use of oral and rectal 5‐aminosalicylic acids (5‐ASAs) were entered into the multivariable logistic regression, and model selection was performed using the backward Wald method with a 0.05 cut‐off to determine predictors of poor PCS scores. The same method was used to identify the predictors of poor MCS scores, using the variables disease duration, immunomodulator use, unintentional weight loss in the last month, early satiety, and taste change variables.
Statistical analyses were performed using IBM SPSS Statistics 24 (Chicago, IL, USA). Statistical significance was set to P ≤ 0.05.
Ethical considerations
Ethical approval was obtained from the Mater Health Services Human Research Ethics Committee (HREC/14/MHS/138) and the Griffith University Human Research Ethics Committee (OTH/10/14/HREC).
Results
Patient demographics
Patient characteristics are shown in Table 1. A total of 170 patients were approached, and 107 patients consented to participate (68 CD, 35 UC, and 4 IC). IBD disease activity was self‐defined as being in remission, current active flare, or recent flare, which were validated by the treating gastroenterologists.
Table 1.
Patient demographics and disease characteristics
| Crohn's disease n = 68 | Ulcerative colitis n = 35 | Indeterminate colitis n = 4 | |
|---|---|---|---|
| Age (years) | 37 (20–75) | 42 (22–86) | 40 (30–44) |
| Male | 33 (49%) | 18 (51%) | 1 (25%) |
| Weight (kg) | 77.3 (40.4–137) | 76.0 (45–139.6) | 70.5 (48–105.8) |
| Height (m) | 1.71 (1.44–1.86) | 1.70 (1.53–1.92) | 1.65 (1.57–1.73) |
| BMI (kg/m2) | 26.1 (15.4–45.2) | 25.7 (18.7–37.9) | 26.1 (19.5–35.4) |
| Underweight | 4 (6%) | 1 (3%) | 0 (0%) |
| Healthy weight | 28 (41%) | 13 (37%) | 1 (25%) |
| Overweight & obese | 35 (51%) | 19 (54%) | 3 (75%) |
| Undetermined† | 1 (1%) | 2 (6%) | 0 (0%) |
| Disease duration (years) | 7 (0–42) | 9 (0–45) | 4 (3–13) |
| 0–10 years | 39(57%) | 16 (46%) | 2 (50%) |
| >10 years | 19 (28%) | 14 (40%) | 1 (25%) |
| Unknown | 10 (15%) | 5 (14%) | 1 (25%) |
| Disease activity | |||
| Remission | 34 (50%) | 18 (51%) | 1 (25%) |
| Recent flare | 10 (15%) | 6 (17%) | 1 (25%) |
| Acute flare | 12 (18%) | 5 (14%) | 0 (0%) |
| Unsure | 11 (16%) | 7 (20%) | 2 (50%) |
| Strictures/fistulas | 37 (54%) | 2 (6%) | 2 (50%)*** |
| Hospital admission in past year | 31 (46%) | 6 (17%) | 1 (25%)* |
| Bowel surgery in past year | 6 (9%) | 1 (3%) | 1 (25%) |
| Previous use of EN/EEN/TPN | 16 (24%) | 4 (11%) | 0 (0%) |
| Previous use of ONS | 25 (37%) | 13 (37%) | 2 (50%) |
| Current use of ONS | 5 (7%) | 2 (6%) | 2 (50%)* |
| Medications | |||
| Aminosalicylates | 9 (13%) | 18 (51%) | 1 (25%)*** |
| Corticosteroids | 8 (12%) | 1 (3%) | 0 (0%) |
| Thiopurines | 35 (51%) | 12 (34%) | 0 (0%) |
| With Allopurinol | 13 (19%) | 2 (6%) | 0 (0%) |
| Antitumor necrosis factor | 18 (26%) | 1 (3%) | 0 (0%)* |
| Antibiotics | 0 (0%) | 1 (3%) | 0 (0%) |
| Ciclosporin | 0 (0%) | 1 (3%) | 0 (0%) |
| Methotrexate | 2 (3%) | 0 (0%) | 0 (0%) |
| Other | 1 (1%) | 2 (6%) | 0 (0%) |
Significance is denoted by *P ≤ 0.05, **P ≤ 0.01, and ***P ≤ 0.001.
Pregnant (n = 2) or BMI unavailable (n = 1).
Values are median (range) or n (%).
BMI, body mass index; EEN, exclusive enteral nutrition; EN, enteral nutrition; ONS, oral nutrition supplement; TPN, total parental nutrition.
There were no significant differences in disease duration, disease activity, or BMI scores between IBD groups. As expected, a significantly greater proportion of CD patients (P ≤ 0.001) were diagnosed with strictures or fistulas. CD patients also had significantly more hospital admissions over the preceding 12 months (P ≤ 0.05). Few IBD patients were currently taking oral nutrition supplements; however, many had previously required oral exclusive enteral nutrition or enteral or parenteral nutrition support.
As expected, the use of 5‐ASAs was significantly higher in the UC group (51%) than in the CD group (13%). Immunomodulator use was similar, and although the current use of steroids was numerically higher in the CD group, this was not statistically significant. Antitumor necrosis factor (anti‐TNF [antitumor necrosis factor]) use was higher in the CD group as anti‐TNFs were not approved for maintenance use in UC in Australia until after the study period.
Malnutrition
Patients were classified as well‐nourished (PG‐SGA A) or malnourished (PG‐SGA B or C). There were no severely malnourished patients (PG‐SGA C) in our population. The PG‐SGA detected moderate or suspected malnutrition (PG‐SGA B) in 17 patients (16.3%), including 11 CD patients (16%) and 6 UC patients (17%), as seen in Table 2. The total PG‐SGA scores demonstrated that 15 (14%) patients required education and intervention based on symptom management, 28 (27%) needed intervention by a dietitian, and 33 (32%) had a critical need for dietary intervention and symptom management. However, there were no significant differences between IBD groups for any individual element of the PG‐SGA.
Table 2.
Nutritional status determined by PG‐SGA assessment
| Crohn's disease n = 67 | Ulcerative colitis n = 33 | Indeterminate colitis n = 4 | |
|---|---|---|---|
| Malnourished† | 11 (16%) | 6 (18%) | 0 (0%) |
| Weight loss 1 month (unintentional) | 1.1 kg (±2.1) | 1.1 kg (±2.2) | 0.6 kg (±1.1) |
| Weight loss 6 months (unintentional) | 2.1 kg (±3.7) | 1.5 kg (±2.7) | 2.7 kg (±3.3) |
| Number of nutrition impact symptoms | 2.30 (±2.4) | 1.67 (±1.8) | 2.25 (±2.1) |
| Total PG‐SGA score | |||
| 0–1 No intervention required at present | 16 (24%) | 11 (33%) | 1 (25%) |
| 2–3 Education and intervention based on symptom management | 12 (18%) | 3 (9%) | 0 (0%) |
| 4–8 Intervention by dietitian indicated, in consultation with physician | 15 (22%) | 11 (33%) | 2 (50%) |
| ≥9 Critical need for dietary intervention or symptom management | 24 (36%) | 8 (24%) | 1 (25%) |
All patients were identified as malnourished and were classified into PG‐SGA B: moderate or suspected malnutrition. No patients were identified with severe malnutrition PG‐SGA C.
Values are n (%) or mean (±SD).
PG‐SGA, patient generated subjective global assessment.
There were significant differences between malnourished and well‐nourished patients as shown in Table 3. Malnourished patients were more likely to be underweight (P ≤ 0.01), have an active flare of their IBD (P ≤ 0.01), and have an increased number of IBD‐related hospital admissions over the past 12 months (P ≤ 0.05). Malnourished IBD patients were significantly affected by poor appetite (P ≤ 0.01), early satiety (P ≤ 0.001), and diarrhea (P ≤ 0.001) compared to well‐nourished patients. Weight loss in the past 1 month and change in food intake alone were able to account for a significant proportion of malnourished patients, with an area under the ROC curve of 0.907 and 95% confidence interval [CI] of 0.814–1.0.
Table 3.
Nutrition status across patient demographics and disease characteristics
| Well‐nourished | Malnourished | P value | |
|---|---|---|---|
| All subjects | 87 | 17 | — |
| Male | 47% (41) | 59% (10) | 0.365 |
| Female | 53% (46) | 41% (7) | 0.365 |
| Age 18–39 years | 54% (47) | 41% (7) | 0.327 |
| Age 40–59 years | 32% (28) | 29% (5) | 0.808 |
| Age 60+ years | 14% (12) | 29% (5) | 0.127 |
| BMI† underweight (kg/m2) | 2% (2) | 18% (3) | 0.007** |
| BMI† healthy weight (kg/m2) | 40% (35) | 41% (7) | 0.939 |
| BMI† overweight (kg/m2) | 37% (32) | 29% (5) | 0.560 |
| BMI† obese (kg/m2) | 21% (18) | 12% (2) | 0.395 |
| Crohn's disease | 64% (56) | 65% (11) | 0.937 |
| Ulcerative colitis | 31% (27) | 35% (6) | 0.746 |
| Indeterminate colitis | 5% (4) | 0% (0) | 0.346 |
| Stricture/fistula | 44% (32) | 50% (8) | 0.662 |
| No stricture/fistula | 53% (39) | 50% (8) | 0.828 |
| Unsure of stricture/fistula | 3% (2) | 0% (0) | 0.483 |
| Colonic disease | 49% (36) | 44% (7) | 0.717 |
| Small intestinal disease | 18% (13) | 19% (3) | 0.925 |
| Ileocolonic disease | 29% (21) | 37% (6) | 0.529 |
| Perianal disease | 1% (1) | 0% (0) | 0.688 |
| Unknown disease location | 2% (2) | 0% (0) | 0.540 |
| Remission | 60% (44) | 50% (8) | 0.463 |
| Recent flare | 21% (15) | 6% (1) | 0.160 |
| Active flare | 12% (9) | 44% (7) | 0.002** |
| Unsure disease activity | 7% (5) | 0% (0) | 0.276 |
| Number of hospital admissions in past year | 0 (0–1) | 1 (0–4) | 0.028* |
| IBD related surgery in the past year | 11% (8) | 19% (3) | 0.409 |
| Current oral nutrition supplement use | 8% (6) | 12% (2) | 0.401 |
| Disease duration 0–5 years | 37% (27) | 37% (6) | 1.000 |
| Disease duration 5–10 years | 26% (19) | 19% (3) | 0.557 |
| Disease duration >10 years | 37% (27) | 44% (7) | 0.602 |
Significance is denoted by *P ≤ 0.05 and **P ≤ 0.01.
BMI were categorized as follows: patients aged 18–64.9 years were classified into underweight (<18.5 kg/m2), healthy weight (18.5–24.9 kg/m2), overweight (25–29.9 kg/m2), and obese (≥30 kg/m2) categories, with those ≥65 years classified as underweight (<23 kg/m2), healthy weight (24–30 kg/m2), and overweight (>30 kg/m2).
Values are % (n) or median (range).
May not equate to 100% due to rounding error.
—, not applicable; BMI, body mass index; IBD, inflammatory bowel disease.
Quality of life
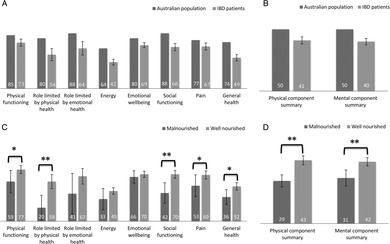
The RAND‐36 measured QOL across eight physical and mental health domains as seen in Figure 2. IBD patients showed clinically lower QOL scores overall compared to the Australian population in all eight domains, as well as in the PCS and MCS scores. Standard deviations (SD) for the Australian data were not available from the published dataset to perform statistical analysis. There were no significant differences between CD and UC over the eight QOL domains or PCS and MCS scores.
Figure 2.
(a) Eight quality of life (QOL) domains for inflammatory bowel disease (IBD) patients and the Australian population. ( ), Australian population; (
 ), IBD patients. (b) Physical and mental component summary scores for IBD patients and the Australian population. (
 ), Australian population; (
 ), IBD patients. (c) Eight QOL domains across nutritional status. (), Malnourished; (), well nourished. (d) Physical and mental component summary scores across nutritional status. (), Malnourished; (), well nourished. Data values are mean or mean ± standard error. SD for the Australian population data were not available. * denotes P ≤ 0.05, and ** denotes P ≤ 0.01.
Malnourished patients had lower scores in general health (P ≤ 0.05), physical health (P ≤ 0.05), role limitations due to physical health problems (P ≤ 0.01), social functioning (P ≤ 0.01), and pain (P ≤ 0.05) and lower values for both PCS (P ≤ 0.01) and MCS (P ≤ 0.01) scores compared to patients without malnutrition. Regression analysis identified pain (OR = 12.8, 95% CI 2.0–80.4) and unintentional weight loss in the last month (OR = 3.1 per kg lost, 95% CI 1.2–7.9) as significant predictors of poor PCS scores. The only predictor of poor MCS scores was early satiety (OR = 7.7, 95% CI 1.7–33.9).
Patients were grouped into active/recent flare or remission for IBD disease activity. Those with active or recently active disease showed lower scores in energy levels (P ≤ 0.05), social functioning (P ≤ 0.05), and pain (P ≤ 0.05) and a lower PCS score (P ≤ 0.05).
Discussion
This is the first study to measure the prevalence of malnutrition in an Australian outpatient IBD population. Using the PG‐SGA tool, we found a malnutrition rate of 16.3%, which was consistent between disease types (16% CD and 17% UC). The malnutrition rate in this study is similar to the malnutrition rate (18.7%) documented by Bin et al.,33 who assessed malnutrition in 75 CD outpatients in disease remission using the validated malnutrition subjective global assessment (SGA). However, a European multicenter study by Valentini et al.34 used the SGA to measure malnutrition in 94 CD and 50 UC outpatients in disease remission. They recorded a malnutrition prevalence of 26% with disease‐specific malnutrition of 23.7% in CD and 33.3% in UC. Other studies investigating malnutrition in IBD have used different criteria to diagnose malnutrition, and comparisons offer limited utility. There is no single clinical or laboratory measurement that, in isolation, can determine nutritional status in IBD patients,6 nor is there consensus on a gold standard for the measurement of malnutrition.11, 35 The majority of studies use multiple methods to determine nutrition status, namely, anthropometric measures of BMI, skin folds, lean muscle and fat mass, biochemical analysis of blood proteins, vitamin and mineral levels, dietary intake, and functional ability such as hand grip strength. Mijac et al.11 report that, when utilizing a range of these parameters to measure malnutrition, prevalence for undernutrition varied from 25 to 69.7% and severe malnutrition from 1.3 to 31.6%, highlighting significant variation depending on the assessment tool used.
Few studies used a clinical malnutrition tool despite their validity and reliability. Such tools include the PG‐SGA, the SGA, and the mini nutritional assessment (MNA). The SGA and PG‐SGA are based on a combination of known prognostic indicators of weight loss and performance status, as well as clinical aspects of nutritional intake and its impediments, such as nutrition impact symptoms.17
Differences in malnutrition rates are also likely affected by differences in patient populations and health‐care systems. Our data were collected in a tertiary IBD outpatient clinic, in which half of the patients were in clinical remission (61%). Despite the lower rate of malnutrition in this study, malnourished patients were more likely to be underweight as calculated by BMI, have an active flare of their IBD, and have significantly more IBD‐related hospital admissions over the preceding 12 months than well‐nourished patients. Due to the cross‐sectional nature of our data, we were unable to determine if malnutrition was a contributing factor or consequence of these admissions. Looking at the components of the PG‐SGA that determined malnutrition, it is worth noting that malnourished patients showed greater unintentional weight loss over the past 1 and 6 months; a pronounced reduction in food intake; and were more affected by nutrition impact symptoms, including diarrhea that could be the result of disease activity, surgery, or medications. The significant finding that malnourished patients are more likely to be underweight confirms that the PG‐SGA is detecting malnutrition in this patient population.
This study also explored the relationship between disease characteristics and malnutrition on QOL. In all QOL domains, and the PCS and MCS scores, IBD patients showed clinically lower QOL than the Australian norm, which is likely related to the chronic, remitting, and relapsing nature of IBD. Patients with active or recently active disease showed lower QOL across energy levels, social functioning, pain, and PCS scores. Numerous studies have previously shown links between IBD disease severity and QOL, including two other Australian studies by Gibson and colleagues who investigated UC4 and CD5 on separate occasions and found that severe UC is associated with poorer QOL and that, similarly, the severity of CD, with or without fistulae, is correlated with lower QOL. A meta‐analysis including many international studies also found that QOL is affected by disease activity.25
Only two studies have previously looked at the relationship between malnutrition and QOL in the IBD population. Valentini et al.34 reported that QOL was associated with disease activity but not with any other parameter of nutritional status or body composition, and Norman et al.36 showed a 52% prevalence of malnutrition and impaired QOL across all scales of the RAND‐36 compared to U.S. norms in hospitalized patients. Furthermore, Norman et al. identified that malnourished IBD patients had reduced QOL across physical function, role limitations due to physical health and general health, and role limitations due to emotional health. They suggested that acute disease‐specific aspects such as diarrhea and abdominal pain lead to a greater impairment of QOL. Malnourished patients in our study had lower scores in general health, physical health, role limitations due to physical health problems, social functioning, and pain on univariate analysis. Despite this, neither disease activity nor malnutrition were found to have a significant effect on PCS or MCS scores in our multivariate regression model due to a lack of statistical significance in the univariate analysis or significant correlation with other variables. However, we identified pain and unintentional weight loss in the past month as significant predictors of poor PCS scores, whereas the predictor of poor MCS scores was early satiety. It is important to recognize the challenge in distinguishing the effects of disease activity from malnutrition. The predictors of poor physical and/or mental health were unintentional weight loss, pain, and early satiety, which demonstrate the likely multifactorial relationship between disease activity and malnutrition and their impact on QOL.
These findings may provide insight to Australian clinicians treating patients with IBD; however, it should be noted that this study was conducted in a single center on sequential clinic patients. Disease activity assessment relied on patient‐reported clinical activity, which was verified by a gastroenterologist rather than biochemical and endoscopic analysis. Trained clinicians conducted the PG‐SGA, but it is a subjective assessment, open to a degree of variability, and it has not been validated in the IBD population specifically.
In summary, malnutrition prevalence in this IBD outpatient population was 16% with no significant difference between UC and CD. Malnourished patients were more likely to be underweight, have an active flare of their IBD, and report increased number of recent hospital admissions. IBD patients showed clinically lower QOL compared to the Australian norm. Malnutrition and disease activity were associated with significantly poorer QOL across multiple individual domains. Unintentional weight loss and pain were predictors of poorer physical health, and early satiety was predictive of poorer mental health in IBD outpatients.
Acknowledgments
The authors thank the patients for volunteering to participate in this study; Fiona Carroll, a Masters of Nutrition and Dietetics student from Griffith University, for assistance with data collection; Sally McCray, Director of Nutrition and Dietetics, Mater Health Services, South Brisbane, Queensland for departmental support to facilitate personnel to complete this research; and Dr Graeme Tucker for assistance with data calculations for the physical and mental component summary scores of the RAND‐36. This study did not receive any funding.
Declaration of conflict of interest: None.
References
- 1. Wardle RA, Mayberry JF. Patient knowledge in inflammatory bowel disease: the Crohns and colitis knowledge score. Eur. J. Gastroenterol. Hepatol. 2014; 26: 1–5. [DOI] [PubMed] [Google Scholar]
- 2. Wilson J, Hair C, Knight R et al High incidence of inflammatory bowel disease in Australia: a prospective population‐based Australian incidence study. Inflamm. Bowel Dis. 2010; 16: 1550–6. [DOI] [PubMed] [Google Scholar]
- 3. Benjamin J, Makharia GK, Kalaivani M, Joshi YK. Nutritional status of patients with Crohn's disease. Indian J. Gastroenterol. 2008; 27: 195–200. [PubMed] [Google Scholar]
- 4. Gibson PR, Vaizey C, Black CM et al Relationship between disease severity and quality of life and assessment of health care utilization and cost for ulcerative colitis in Australia: a cross‐sectional, observational study. J. Crohns Colitis. 2014; 8: 598–606. [DOI] [PubMed] [Google Scholar]
- 5. Gibson PR, Weston AR, Shann A et al Relationship between disease severity, quality of life and health‐care resource use in a cross‐section of Australian patients with Crohn's disease. J. Gastroenterol. Hepatol. 2007; 22: 1306–12. [DOI] [PubMed] [Google Scholar]
- 6. Wagner IJ, Rombeau JL. Nutritional support of surgical patients with inflammatory bowel disease. Surg. Clin. North Am. 2011; 91: 787–803. [DOI] [PubMed] [Google Scholar]
- 7. O'Sullivan M, O'Morain C. Nutrition in inflammatory bowel disease. Best Pract. Res. Clin. Gastroenterol. 2006; 20: 561–73. [DOI] [PubMed] [Google Scholar]
- 8. Razack R, Seidner DL. Nutrition in inflammatory bowel disease. Curr. Opin. Gastroenterol. 2007; 23: 400–5. [DOI] [PubMed] [Google Scholar]
- 9. Alastair F, Emma G, Emma P. Nutrition in inflammatory bowel disease. J. Parenter. Enteral Nutr. 2011; 35: 571–80. [DOI] [PubMed] [Google Scholar]
- 10. Massironi S, Rossi RE, Cavalcoli FA, Della Valle S, Fraquelli M, Conte D. Nutritional deficiencies in inflammatory bowel disease: therapeutic approaches. Clin. Nutr. 2013; 32: 904–10. [DOI] [PubMed] [Google Scholar]
- 11. Mijac DD, Janković GLJ, Jorga J, Krstić MN. Nutritional status in patients with active inflammatory bowel disease: prevalence of malnutrition and methods for routine nutritional assessment. Eur. J. Intern. Med. 2010; 21: 315–9. [DOI] [PubMed] [Google Scholar]
- 12. Lucendo AJ, De Rezende LC. Importance of nutrition in inflammatory bowel disease. World J. Gastroenterol. 2009; 15: 2081–8. [DOI] [PMC free article] [PubMed] [Google Scholar]
- 13. Carter MJ, Lobo AJ, Travis SPL. Guidelines for the management of inflammatory bowel disease in adults. Gut. 2004; 53: v1–v16. [DOI] [PMC free article] [PubMed] [Google Scholar]
- 14. Nguyen GC, Munsell M, Harris ML. Nationwide prevalence and prognostic significance of clinically diagnosable protein‐calorie malnutrition in hospitalized inflammatory bowel disease patients. Inflamm. Bowel Dis. 2008; 14: 1105–11. [DOI] [PubMed] [Google Scholar]
- 15. Hebuterne X, Filippi J, Schneider SM. Nutrition in adult patients with inflammatory bowel disease. Curr. Drug Targets. 2014; 15: 1030–8. [DOI] [PubMed] [Google Scholar]
- 16. Rocha R, Santana GO, Almeida N, Lyra AC. Analysis of fat and muscle mass in patients with inflammatory bowel disease during remission and active phase. Br. J. Nutr. 2009; 101: 676–9. [DOI] [PubMed] [Google Scholar]
- 17. Ottery FD. Definition of standardized nutritional assessment and interventional pathways in oncology. Nutrition. 1996; 12: S15–S9. [DOI] [PubMed] [Google Scholar]
- 18. Todd A, Carroll R, Gallagher M, Meade A. Nutritional status of haemodialysis patients: comparison of Australian cohorts of aboriginal and European descent. Nephrol. Ther. 2013; 18: 790–7. [DOI] [PubMed] [Google Scholar]
- 19. Bauer J, Capra S, Ferguson M. Use of the scored patient‐generated subjective global assessment (PG‐SGA) as a nutrition assessment tool in patients with cancer. Eur. J. Clin. Nutr. 2002; 56: 779–85. [DOI] [PubMed] [Google Scholar]
- 20. Agostini A, Moretti M, Calabrese C et al Attachment and quality of life in patients with inflammatory bowel disease. Int. J. Colorectal Dis. 2014; 29: 1291–6. [DOI] [PubMed] [Google Scholar]
- 21. Cohen BL, Zoëga H, Shah SA et al Fatigue is highly associated with poor health‐related quality of life, disability and depression in newly‐diagnosed patients with inflammatory bowel disease, independent of disease activity. Aliment. Pharmacol. Ther. 2014; 39: 811–22. [DOI] [PMC free article] [PubMed] [Google Scholar]
- 22. Jäghult S, Saboonchi F, Johansson U‐B, Wredling R, Kapraali M. Identifying predictors of low health‐related quality of life among patients with inflammatory bowel disease: comparison between Crohn's disease and ulcerative colitis with disease duration. J. Clin. Nurs. 2011; 20: 1578–87. [DOI] [PubMed] [Google Scholar]
- 23. Luo X, Mao R, He Y, Chen B‐L, Zeng Z‐R, Chen M‐H. P506 Predictors of health‐related quality of life in Asian patients with inflammatory bowel disease: psychological, clinical and demographic factors. J. Crohns Colitis. 2015; 9 (Suppl. 1): S332–S3. [Google Scholar]
- 24. Rochelle TL, Fidler H. The importance of illness perceptions, quality of life and psychological status in patients with ulcerative colitis and Crohn's disease. J. Health Psychol. 2013; 18: 972–83. [DOI] [PubMed] [Google Scholar]
- 25. van der Have M, van der Aalst KS, Kaptein AA et al Determinants of health‐related quality of life in Crohn's disease: a systematic review and meta‐analysis. J. Crohns Colitis. 2014; 8: 93–106. [DOI] [PubMed] [Google Scholar]
- 26. Irvine EJ. Quality of life of patients with ulcerative colitis: past, present, and future. Inflamm. Bowel Dis. 2008; 14: 554–65. [DOI] [PubMed] [Google Scholar]
- 27. Nurmi E, Haapamäki J, Paavilainen E, Rantanen A, Hillilä M, Arkkila P. The burden of inflammatory bowel disease on health care utilization and quality of life. Scand. J. Gastroenterol. 2013; 48: 51–7. [DOI] [PubMed] [Google Scholar]
- 28.RAND Corporation. Medical Outcomes Study: 36‐Item Short Form Survey Scoring Instructions, 2013. Cited 16 Sept 2014. Available from URL: http://www.rand.org/health/surveys_tools/mos/mos_core_36item_scoring.html
- 29. Hays RD, Morales LS. The rand‐36 measure of health‐related quality of life. Ann. Med. 2001; 33: 350–7. [DOI] [PubMed] [Google Scholar]
- 30. Winter JE, MacInnis RJ, Wattanapenpaiboon N, Nowson CA. BMI and all‐cause mortality in older adults: a meta‐analysis. Am. J. Clin. Nutr. 2014; 99: 875–90. [DOI] [PubMed] [Google Scholar]
- 31. Hays RD, Sherbourne CD, Mazel RM. The rand 36‐item health survey 1.0. Health Econ. 1993; 2: 217–27. [DOI] [PubMed] [Google Scholar]
- 32. Tucker G, Adams R, Wilson D. New Australian population scoring coefficients for the old version of the SF‐36 and SF‐12 health status questionnaires. Qual. Life Res. 2010; 19: 1069–76. [DOI] [PubMed] [Google Scholar]
- 33. Bin CM, Flores C, Álvares‐da‐silva MR, Francesconi CF. Comparison between handgrip strength, subjective global assessment, anthropometry, and biochemical markers in assessing nutritional status of patients with Crohn's disease in clinical remission. Dig. Dis. Sci. 2010; 55: 137–44. [DOI] [PubMed] [Google Scholar]
- 34. Valentini L, Schaper L, Buning C et al Malnutrition and impaired muscle strength in patients with Crohn's disease and ulcerative colitis in remission. Nutrition. 2008; 24: 694–702. [DOI] [PubMed] [Google Scholar]
- 35. Meijers JMM, van Bokhorst‐de van der Schueren MAE, Schols JMGA, Soeters PB, Halfens RJG. Defining malnutrition: mission or mission impossible? Nutrition. 2010; 26: 432–40. [DOI] [PubMed] [Google Scholar]
- 36. Norman K, Kirchner H, Lochs H, Pirlich M. Malnutrition affects quality of life in gastroenterology patients. World J. Gastroenterol. 2006; 12: 3380–5. [DOI] [PMC free article] [PubMed] [Google Scholar]