Abstract
We analyzed the backbone fragmentation behavior of tryptic peptides of a four-protein mixture and of E. coli lysate subjected to ultraviolet photodissociation (UVPD) at 213 nm on a commercially available UVPD-equipped tribrid mass spectrometer. We obtained 15 178 unique high-confidence peptide UVPD spectrum matches by recording a reference beam-type collision-induced dissociation (HCD) spectrum of each precursor, ensuring that our investigation includes a broad selection of peptides, including those that fragmented poorly by UVPD. Type a, b, and y ions were most prominent in UVPD spectra, and median sequence coverage ranged from 5.8% (at 5 ms laser excitation time) to 45.0% (at 100 ms). Overall, the sequence fragment intensity remained relatively low (median: 0.4% (5 ms) to 16.8% (100 ms) of total intensity), and the remaining precursor intensity, high. The sequence coverage and sequence fragment intensity ratio correlated with the precursor charge density, suggesting that UVPD at 213 nm may suffer from newly formed fragments sticking together due to noncovalent interactions. The UVPD fragmentation efficiency therefore might benefit from supplemental activation, as was shown for ETD. Aromatic amino acids, most prominently tryptophan, facilitated UVPD. This points to aromatic tags as possible enhancers of UVPD. Data are available via ProteomeXchange with identifier PXD018176 and on spectrumviewer.org/db/UVPD-213nm-trypPep.
Keywords: ultraviolet photodissociation, backbone fragmentation, tryptic peptides, collision-induced dissociation spectrum, fragmentation behavior, precursors
Introduction
The spread of ultraviolet photodissociation (UVPD) as an alternative fragmentation method in mass spectrometry has increased substantially in recent years.1 UVPD uses photons to achieve bond dissociation, which is a fundamentally different mechanism from the widely used collisional-activation-based [collision-induced dissociation (CID)2 and beam-type CID (HCD)3] and electron-based [electron transfer dissociation (ETD)4 and electron capture dissociation (ECD)5] methods. Photons are typically produced by lasers at specific wavelengths over varying excitation times, tapping into a plethora of different use cases and possible applications.6 Coupling lasers to mass spectrometers often requires highly specialized, custom instrumentation with important safety considerations that must be met. A recent key update here has been the release of a commercially available 213 nm solid-state laser coupled to a tribrid mass spectrometer. This has opened up the technology to be used by a wider user base outside of specialized laboratories who have implemented UVPD by making custom modifications to their instruments.
So far, 213 nm UVPD has mainly been used in top-down proteomics. For this, Fornelli et al.7 have recently conducted a thorough performance evaluation. Studies on peptide fragmentation with UVPD at 213 nm have been conducted on in-house-modified instruments by looking only at a very small number of peptides and very specific bond cleavages. Girod et al. described specific fragmentation behavior of proline-containing peptides in their study on four synthetic peptides subjected to a long (1000 ms) 213 nm UVPD excitation time.8 Mistarz et al. investigated the fragmentation behavior of a single triply protonated 12-mer peptide at a 600 ms laser excitation time for localizing sites of backbone deuteration.9 More recently, Talbert and Julian carried out a study on initiating bond-selective fragmentation using 213 nm UVPD on 13 peptides.10
In this study, we investigated the 213 nm UVPD fragmentation behavior of a large number of tryptic peptides in bottom-up proteomics experiments using a well-defined four-protein mix as well as an E. coli lysate. We deployed a systematic dual MS2 acquisition scheme, utilizing reference HCD spectra for identification and to obtain UVPD peptide-spectra matches (PSMs) independent of the UVPD fragmentation efficiency. We characterized the peptide backbone ion-types present and compared the sequence coverage and the sequence fragment intensity ratio across a range of UVPD excitation times and other fragmentation techniques. As the speed of acquisition plays a crucial role in the number of possible identifications,11 we investigated excitation times comparable to typical ETD reaction time scales12 to acquire more practical data points. Finally, we probed our data to find precursor-dependent properties that facilitate good UVPD fragmentation.
Experimental Methods
Materials/Reagents
Human serum albumin (HSA), ovotransferrin (chicken), and myoglobin (equine) were purchased from Sigma-Aldrich (St. Louis, MO). Creatine kinase (rabbit) was purchased from Roche (Basel, Switzerland).
Sample Preparation
HSA, ovotransferrin, myoglobin, and creatine kinase were dissolved in 8 M urea with 50 mM ammonium bicarbonate to a concentration of 2 mg/mL each. Proteins were reduced by adding dithiothreitol at 2.5 mM followed by incubation for 30 min at 20 °C. Samples were derivatized using iodoacetamide at 5 mM concentration for 20 min in the dark at 20 °C, diluted 1:5 with 50 mM ammonium bicarbonate and digested with trypsin (Pierce Biotechnology, Waltham, MA) at a protease-to-protein ratio of 1:100 (w/w) during a 16 h incubation period at 37 °C. Digestion was stopped by adding 10% TFA at a concentration of 0.5%.
E. coli K12 cells were cultured in LB medium, harvested at OD 0.6, formed into pellets, frozen using liquid nitrogen, and stored at −80 °C. Cell pellets were then resuspended in ice-cold lysis buffer (20 mM HEPES, 150 mM NaCl, pH 7.5, and protease inhibitors (Roche)) and sonicated on ice at 30% amplitude, 30 s on/off for 10 cycles (total time 5 min) using a Branson digital sonifier. Liquid was collected in a centrifuge tube (the upper foaming with DNA proteins was discarded), and the sample was clarified by centrifugation at 15 500 rpm for 30 min. The protein concentration was measured using the Pierce BCA protein assay. The soluble lysate was then run into the first centimeter of an SDS-PAGE gel, and the protein band was excised and subjected to an in-gel digestion protocol: reduction in 20 mM DTT for 30 min at room temperature, alkylation with 55 mM iodoacetamide for 30 min at room temperature in the dark, and digestion with 12.5 ng/μL trypsin overnight at 37 °C.
Digests for all proteins were cleaned up using the StageTip protocol.13 Peptides were eluted using 80% v/v ACN and 0.1% v/v TFA, partially evaporated using a Vacufuge concentrator (Eppendorf, Germany) to <5% ACN, and resuspended in mobile phase A (0.1% formic acid) prior to mass spectrometry analysis.
Data Acquisition
Samples were analyzed using an UltiMate 3000 Nano LC system coupled to an Orbitrap Fusion Lumos Tribrid mass spectrometer equipped with an EasySpray source and a UVPD module (Thermo Fisher Scientific, San Jose, CA) comprising a solid-state Nd:YAG laser head (CryLaS GmbH) that generates a pulsed 213 nm beam (fifth harmonic). Mobile phase A consisted of 0.1% formic acid in water, and mobile phase B consisted of 80% acetonitrile, 0.1% formic acid, and 19.9% water. Peptides (1 μg equiv) were loaded onto a 500 mm C-18 EasySpray column (75 μm i.d., 2 μm particles, 100 Å pore size) and eluted using the following nonlinear gradient at a 300 nL/min flow rate: 2–4% (1 min); 4–6% B (2 min); 6–37.5% B (97 min); 37.5–42.5% B (10 min); and 42.5–47.5% B (5 min). MS1 spectra were acquired in the Orbitrap using a scanning range from 300 to 1500 m/z at 120 000 resolution. The AGC target was set to 8 × 10⁵, and the maximum injection time was 50 ms. The filter that was used was a peptide monoisotopic precursor selection (MIPS) with an intensity threshold of 5 × 10⁴, precursor charge states of 2–7+, and a dynamic exclusion of 60 s. MS2 spectra were acquired using a top speed with a 3 s cycle time at 30 000 Orbitrap resolution. Precursors were isolated using the Quadrupole with an isolation window of 1.4 m/z. The MS2 AGC target was set to “Standard” using the “Auto” maximum injection time mode. For each precursor, two MS2 scans were acquired (dual MS2): one with HCD at NCE 30% and the other utilizing UVPD at 213 nm with varying laser excitation times between experiments (5, 10, 15, 20, 30, 40, 50, and 100 ms). As reference, dual MS2 with HCD-HCD, HCD-ETD, and HCD-EThcD (supplemental activation with 30% NCE) were acquired. For the ETD experiments, calibrated charge-dependent reaction times were used. For each dual MS2 method, 2 replicas were acquired, resulting in a total of 22 acquisitions per sample.
Data Analysis
Raw files were preprocessed using a custom python script (https://github.com/Rappsilber-Laboratory/preprocessing). Preprocessing included conversion to MGF format, m/z recalibration of both precursor and fragment peaks, and splitting the primary (HCD) and secondary (UVPD, ETD, EThcD, or HCD) MS2 spectra into separate MGF files. The primary MS2 spectra were denoised with the default MS2Denoise settings in MSconvert14 and then analyzed with xiSEARCH15 using the following settings: MS accuracy, 3 ppm; MS2 accuracy, 15 ppm; missing monoisotopic precursor peaks, two; enzyme, trypsin; maximum missed cleavages, four; maximum number of modifications, three; ions: precursor, b- and y-type; modifications: carbamidomethylation on cysteine as fixed and oxidation on methionine as variable modification. The false discovery rate was estimated separately for each fragmentation parameter set (2 acquisition replicas per fragmentation parameter) using xiFDR16 on a unique PSM level to 1% for the 4 PM and 0.1% for the E. coli lysate. The larger number of identified spectra of the E. coli sample allowed for a lower FDR while maintaining a sufficient number of decoy hits (>9) to reliably estimate the FDR. Additionally, we excluded PSMs that were not identified in at least 6 of the 11 different fragmentation parameter set duplicates. This minimizes the number of false positives in our data set because of the improbability of any given random match to occur in more than half of the experiments. From the secondary peak list files, the corresponding scans to the primary HCD PSMs were extracted and subsequently annotated with pyXiAnnotator (https://github.com/Rappsilber-Laboratory/pyXiAnnotator/) using the identifications from their primary counterparts. Secondary spectra were annotated with peptide, a-, b-, c-, x-, y-, and z-type ions with a maximum tolerance of 15 ppm. Additionally, a hydrogen loss was defined, and the missing monoisotopic fragment peak feature was used to enable the matching of ions with the absence or presence of an extra hydrogen respectively (e.g., y–, a+). For comparison, we additionally searched the secondary spectra alone with the same settings described above for HCD, with the exception of the searched ion types, where we tested several ion type combinations and used the ones that gave the highest number of results (a, b, c, x, y, and z for UVPD; c, y, and z for ETD; and a, b, c, y, and z for EThcD).
The mass spectrometry raw files, peak lists, search engine results, and FASTA files have been deposited to the ProteomeXchange Consortium via the PRIDE17 partner repository with the PXD018176 data set identifier and 10.6019/PXD018176. Additionally, we have made all annotated spectra available through xiSPEC18 on spectrumviewer.org/db/UVPD-213nm-trypPep.
Results/Discussion
Dual MS2 Data Acquisition
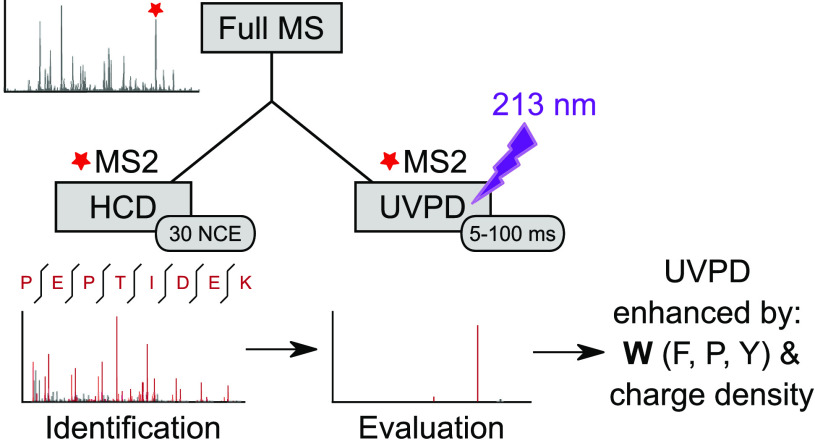
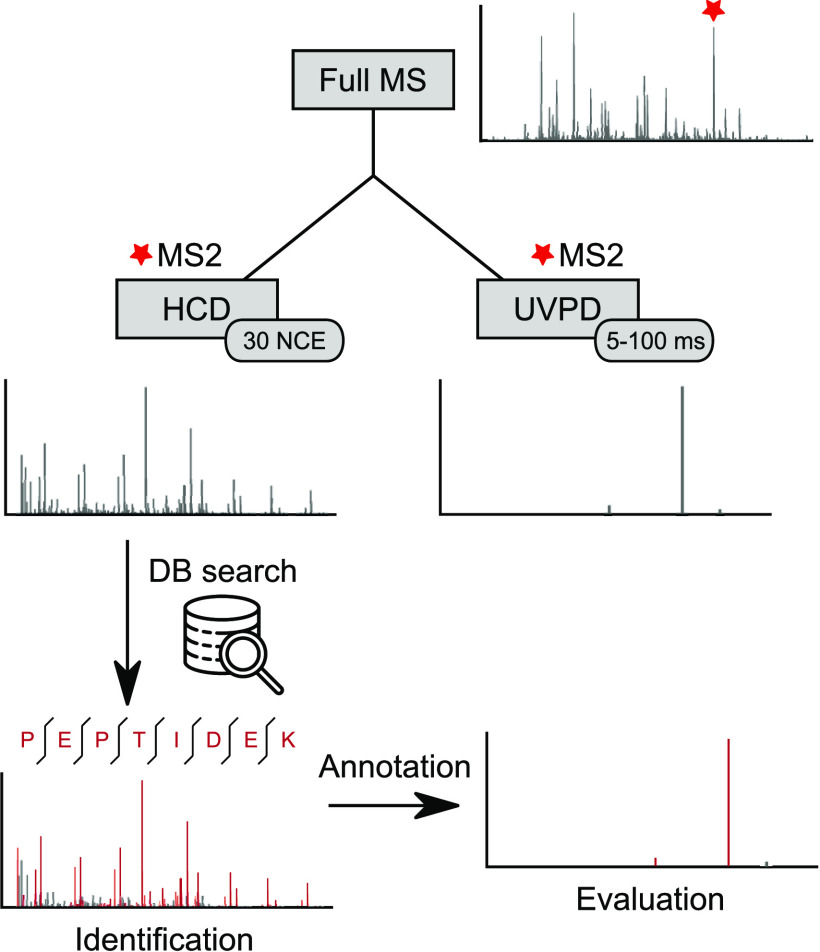
We aimed to evaluate the UVPD efficiency of peptides in tryptic digests at different excitation times. For some settings and peptides, the resulting MS2 spectra themselves may not allow the unambiguous identification of the peptide due to poor fragmentation efficiency. We therefore designed a dual MS2 acquisition approach by acquiring two MS2 spectra for each precursor: one fragmented with HCD and then another fragmented with UVPD (alternatively ETD, EThcD, or HCD as controls). This allowed us to use the well-established collisional fragmentation method to reliably identify precursors and then annotate and evaluate the UVPD spectra with those identifications, even when the extent of peptide fragmentation in a UVPD spectrum alone did not enable unambiguous fragment-based identification (Figure 1).
Figure 1.
Dual MS2 workflow. For each selected precursor, two MS2 spectra are acquired, one with HCD and one with UVPD fragmentation. The HCD spectrum is used for identification via a database search. The identified peptide is then used to annotate the UVPD spectra, allowing evaluation even when the extent of peptide fragmentation in a UVPD spectrum alone does not enable unambiguous fragment-based identification.
Using the HCD scans for identification gave us a large number of PSMs over all tested conditions (Figure S1). This becomes especially apparent for the short excitation time acquisitions of the more complex E. coli sample. From the 5 ms acquisitions 17 536 HCD spectra could be identified, whereas relying on UVPD alone would have yielded only 1047 PSMs. Additionally, we checked the overlap of UVPD and HCD identifications to make sure that we are not missing peptides that fragment well using UVPD but not HCD, yet we found almost none. Furthermore, analyzing the subset of UVPD spectra that led to peptide identifications would have introduced a strong bias toward peptides that fragment well. The HCD-HCD control samples led to almost identical numbers of PSMs from both the reference HCD and the secondary HCD control scan, showing that the quality of the second spectra is not adversely affected, thus demonstrating the viability of this approach.
To further improve the quality of our data we applied the additional restriction to include only PSMs that were seen in more than half of our acquired fragmentation parameter sets. This rather conservative selection of PSMs (MS1 plus MS2 HCD fragment-based identification with stringent FDR cutoff and the additional requirement mentioned above) combines the benefits of using a real-world sample from a protein digest while approaching the confidence level of a synthetic peptide library.
Fragmentation Analysis of Different UVPD Excitation Times
We investigated the UVPD-induced peptide fragmentation behavior of tryptic digests from a lower-complexity sample consisting of four model proteins (4 PM) and a complex E. coli lysate sample and compared it with HCD, ETD, and EThcD fragmentation.
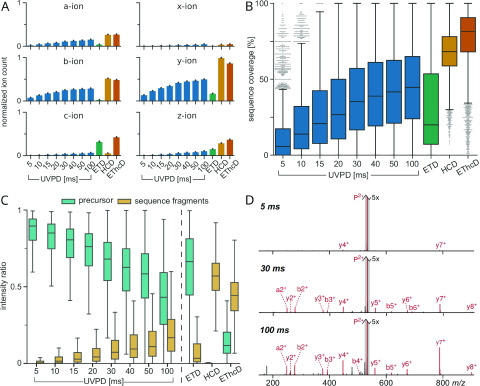
Our data set consists of 15 178 unique precursors (unique sequence and charge state combination; 4 PM: 667; E. coli: 14 511; Table S1). These originate from 11 663 unique peptides (4 PM: 384; E. coli: 11 279) subjected to UVPD at 213 nm with varying laser excitation times (5–100 ms). We analyzed both data sets separately to test if we can reproduce the findings from our more complex E. coli lysate sample also in the small, well-defined 4 PM sample. The evaluation of fragmentation characteristics from both data sets led indeed to very similar results (compare Figure 2 and Figure S2). Our analysis found that UVPD at 213 nm results in all possible types of backbone fragmentation ions in tryptic peptides, with a-, b-, and y-type ions being the most prominent over all excitation times (Figure 2A). In contrast to our observation for tryptic peptides, UVPD of intact proteins has been shown to produce predominantly a and x ions.7 Intact proteins produce much larger fragments. One could speculate that for large fragments, b- to a-ion and y- to x-ion conversion by CO-elimination might be favored. Ion counts were normalized per peptide by length for ease of comparison. Ion counts increase with increasing excitation time and start to level off at the maximum acquired time for all ion types. Doubling the excitation time from 50 to 100 ms resulted only in a very small increase in fragment count.
Figure 2.
Fragmentation analysis of 14 511 unique PSMs from 11 279 unique peptides subjected to different UVPD excitation times and ETD, HCD, and EThcD for comparison. Data from the E. coli data set. (A) Bar plots showing the sequence fragment ion type counts (normalized by peptide length). Error bars represent 0.95 confidence intervals. (B) Box plots showing sequence coverage of precursors. (C) Box plots of MS2 intensity ratios of remaining precursor and sequence fragments with respect to the total MS2 intensity. In all box plots, whiskers extend to the 1.5 interquartile range past the low and high quartiles. (D) Example MS2 spectra of YLDLIANDK (charge 2+) subjected to 5, 30, and 100 ms of UVPD. All three spectra are zoomed in on the y axis (5×). Annotated fragment peaks are shown in red, and the unfragmented precursor is highlighted with a gray outline.
We calculated the sequence coverage for our PSMs conservatively, as the ratio of matched N-terminal and C-terminal sequence fragments to the number of theoretically possible sequence fragments (i.e., 100% sequence coverage would mean the detection of at least one fragment from the N-terminal (a, b, or c) and one from the C-terminal series (x, y, or z) between all amino acid residues of a peptide). Sequence coverage of UVPD was low at 5 ms (median: 5.8%) but increased steadily with excitation time to a median of 45.0% for 100 ms. While still on the low side compared to the HCD at 68.2% and EThcD at 81.6%, UVPD started to give better median sequence coverage than ETD with excitation times longer than 15 ms. The low median sequence coverage from ETD is partly due to its dependency on higher charge states (median sequence coverage for charge 2+: 12.5% vs 41.2% for ≥3+). Notably even for the lowest UVPD excitation time, there are some precursors that fragmented reasonably well (showing a sequence coverage of >50%) while others showed almost no fragmentation even at 100 ms. This suggested that precursor-dependent properties play an important role in UVPD. Also, comparing the last two UVPD data points showed that doubling the excitation time had only a marginal effect on the resulting sequence coverage.
As a way of assessing the fragmentation efficiency, we calculated the ratio of the sum of all sequence fragment isotope cluster peak intensities to the total MS2 intensity. This sequence fragment intensity ratio remained low over all tested UVPD excitation times, ranging from a median of 0.4% at 5 ms to 16.8% at 100 ms (Figure 2C). In contrast to the ion count and the sequence coverage, doubling the excitation time from 50 to 100 ms led to higher fragment intensity but few additional fragments.
The high remaining precursor intensity revealed that the low sequence fragment intensity was due to the low fragmentation efficiency, similar to what has been described for ETD.19 This can be seen in the representative spectra where even at 100 ms of UVPD the unfragmented precursor is the most intense peak by far (Figure 2D). In the HCD spectra, on the other hand, a median of 57.0% MS2 intensity stems from sequence fragments with almost no leftover precursor. This suggests that here the remaining intensity most likely stems from internal fragmentation events, commonly seen in HCD.20
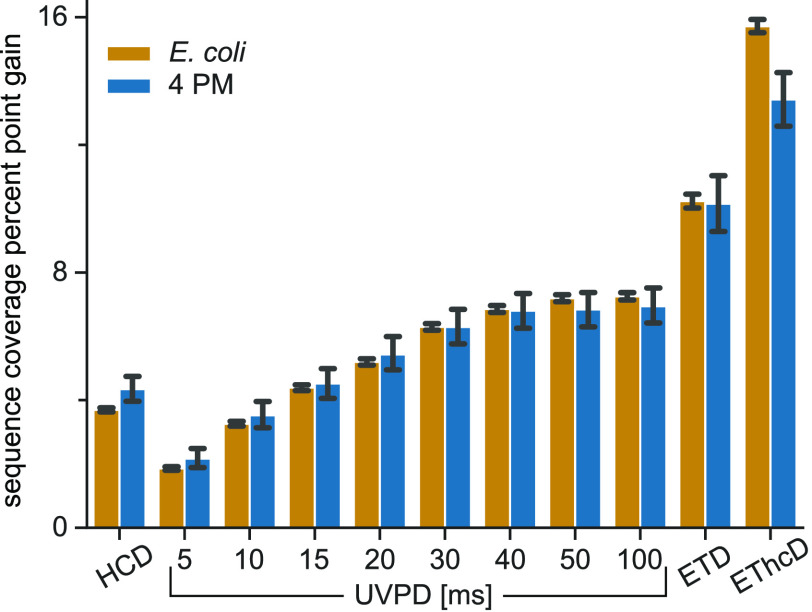
Next, we checked the complementarity between the HCD and the secondary scans by adding the annotated fragments from the secondary MS2 scan to its primary scan and recalculating the sequence coverage. In Figure 3 the gain in sequence coverage for each method is plotted. Note that the combination of two consecutive HCD scans on the same precursor already resulted in an average ∼4% gain and should therefore be considered to be a baseline. UVPD with excitation times >20 ms showed sequence coverage gains above this baseline, but the gain seemed to level off at 40 ms around 7%. Both ETD and EThcD were favorable over UVPD in terms of sequence coverage complementarity to HCD.
Figure 3.
Sequence fragment complementarity of acquired fragmentation methods to the HCD reference spectra. Plotted is the sequence coverage gain for all matches from the E. coli and 4 PM data sets when combining annotated fragments from the secondary MS2 scan (HCD, UVPD 5–100 ms, ETD, or EThcD) with the reference HCD scan versus the reference HCD scan alone.
Influence of the Charge State on UVPD
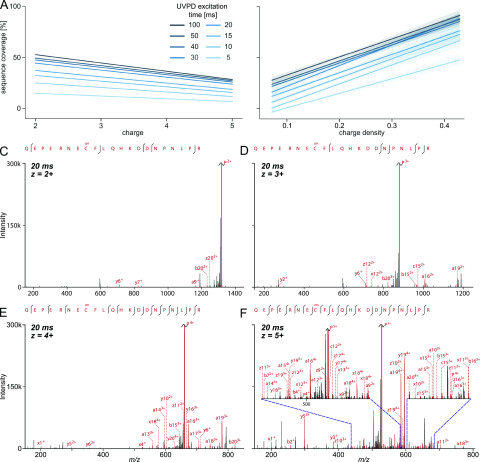
In search of precursor properties that influenced UVPD fragmentation, we first looked at the precursor charge state. We split our PSMs by the charge state and evaluated the correlation to the sequence coverage by linear regression fitting (Figure 4A). We excluded charge states 6+ and 7+ for the regression analysis due to their low number (<2%, Figure S3). In contrast to ETD,22 a higher charge state showed negative correlation with sequence coverage over all tested laser excitation times. The charge density (precursor charge divided by the peptide amino acid length), on the other hand, seemed to be an important influence on UVPD fragmentation. A high charge density was correlated with high sequence coverage independent of excitation time (Figure 4B). The influence of the charge density became even more apparent when comparing spectra of the same peptide that were acquired in multiple charge states. Figure 4 panels C–F show spectra of the peptide QEPERNECcmFLQHKDDNPNLPR fragmented in charge states 2+, 3+, 4+, and 5+. In the spectrum with the lowest charge state, only four sequence fragments are visible (i.e., 10% sequence coverage). The sequence coverage increased to 17.5% for charge state 3+ (7 sequence fragments) and charge state 4+ already showed 27 sequence fragments, resulting in 42.5% sequence coverage. Finally, the highest detected charge state for this peptide (5+) presented a rich fragmentation spectrum with high sequence coverage (67.5%), albeit the fragmentation efficiency remains relatively low.
Figure 4.
Influence of (A) charge and (B) charge density on the sequence coverage in UVPD experiments with varying laser excitation times. Linear regression model fit of all analyzed PSM data with the 0.95 confidence interval shown as translucent bands around lines. Precursor charge states 6+ and 7+ were excluded for panel A due to their low number (<2%). (C–F) Example fragmentation spectra of peptide QEPERNECcmFLQHKDDNPNLPR (Ccm stands for carbamidomethylated cysteine) subjected to 20 ms of UVPD in charge states 2+, 3+, 4+, and 5+. Spectra are zoomed in on the y axis to 300k intensity for visibility, and the remaining unfragmented precursor peaks are cut off.
A possible interpretation of the charge density dependence of UVPD could be incomplete dissociation through noncovalent interactions between newly formed fragments, a phenomenon which has been previously described for electron-based fragmentation methods.21,22 In the case of ETD, several supplemental activation techniques have been developed to address this drawback using collision-based activation (ETciD/ETcaD23 and EThcD19) or infrared excitation.24 Recently, Halim et al. have reported increased sequence coverage in a top-down proteomics experiment through simultaneous and consecutive irradiation using UV (213 nm) and IR (10.6 μm) lasers, coined HiLoPD.25
Unfortunately, however, thus far there is no commercial instrument available that contains both a UV and an IR laser source. Furthermore, the combination of UVPD and collision-based activation is not possible with the current version of the instrument control software.
Influence of Amino Acid Composition on UVPD
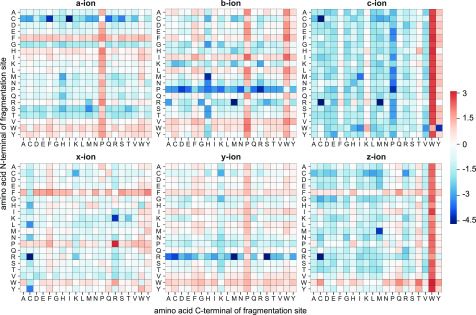
The availability of chromophores is crucial for absorbing the energy provided by photons, without which UVPD will not take place. While for shorter wavelengths such as 157 nm almost all bonds can act as chromophores, 213 nm is already at the absorption threshold for smaller chromophores such as amide bonds.10 Talbert and Julian found that 213 nm can give rise to both bond specific as well as nonspecific dissociation depending on the laser power and excitation time as well as the molecular composition. The molecular composition and structure of the peptides is defined by their amino acid composition. We analyzed the cleavage propensity on UVPD for all backbone ion types. The heat maps in Figure 5 show the relative likelihood for the detection of a backbone cleavage product between two amino acids. Propensities were calculated by dividing the observed occurrences of a fragmentation site by the theoretical possible values for all combinations of amino acid N- and C-terminals of the site. For ease of comparison, ratios were normalized by the mean for each product ion type and then converted to the logarithm (base 2). Amino acid pairs between which cleavage occurs preferentially, differed between the different ion types, but overall the aromatic amino acids and proline showed hot spots for increased cleavage propensity. Similar to what has been described by Oh et al.26 for 266 nm and by Fornelli et al.7 for 213 nm top-down proteomics, we found an increased frequency of fragmentation events adjacent to aromatic amino acids. Type a and x ions and to a lesser extent b, y, and z ions showed a preference for the N-terminal cleavage of phenylalanine. Interestingly, c- and z-type cleavage occurred with a largely increased frequency of N-terminal tryptophan. The most prominent ion types (a, b, and y) all occur with increased frequency with a proline C-terminal fragmentation site. This is in line with findings from Girod et al.,8 who have shown C–C and C–N bond activation close to that of proline residues following 213 nm excitation of the proline-containing peptides, which was also seen by Fornelli et al.7 in top-down analysis.
Figure 5.
Cleavage propensities of backbone fragment ion types for UVPD. Heat maps show the ratio of detected versus theoretical cleavage events for all amino acid combinations that can occur at the N- and C-terminals of the fragmentation site. Values were normalized by the mean for each ion type and then converted to the base 2 logarithm. White represents the average cleavage propensity for this ion type, blue represents a lower-than-average occurrence, and red represents a higher-than-average occurrence.
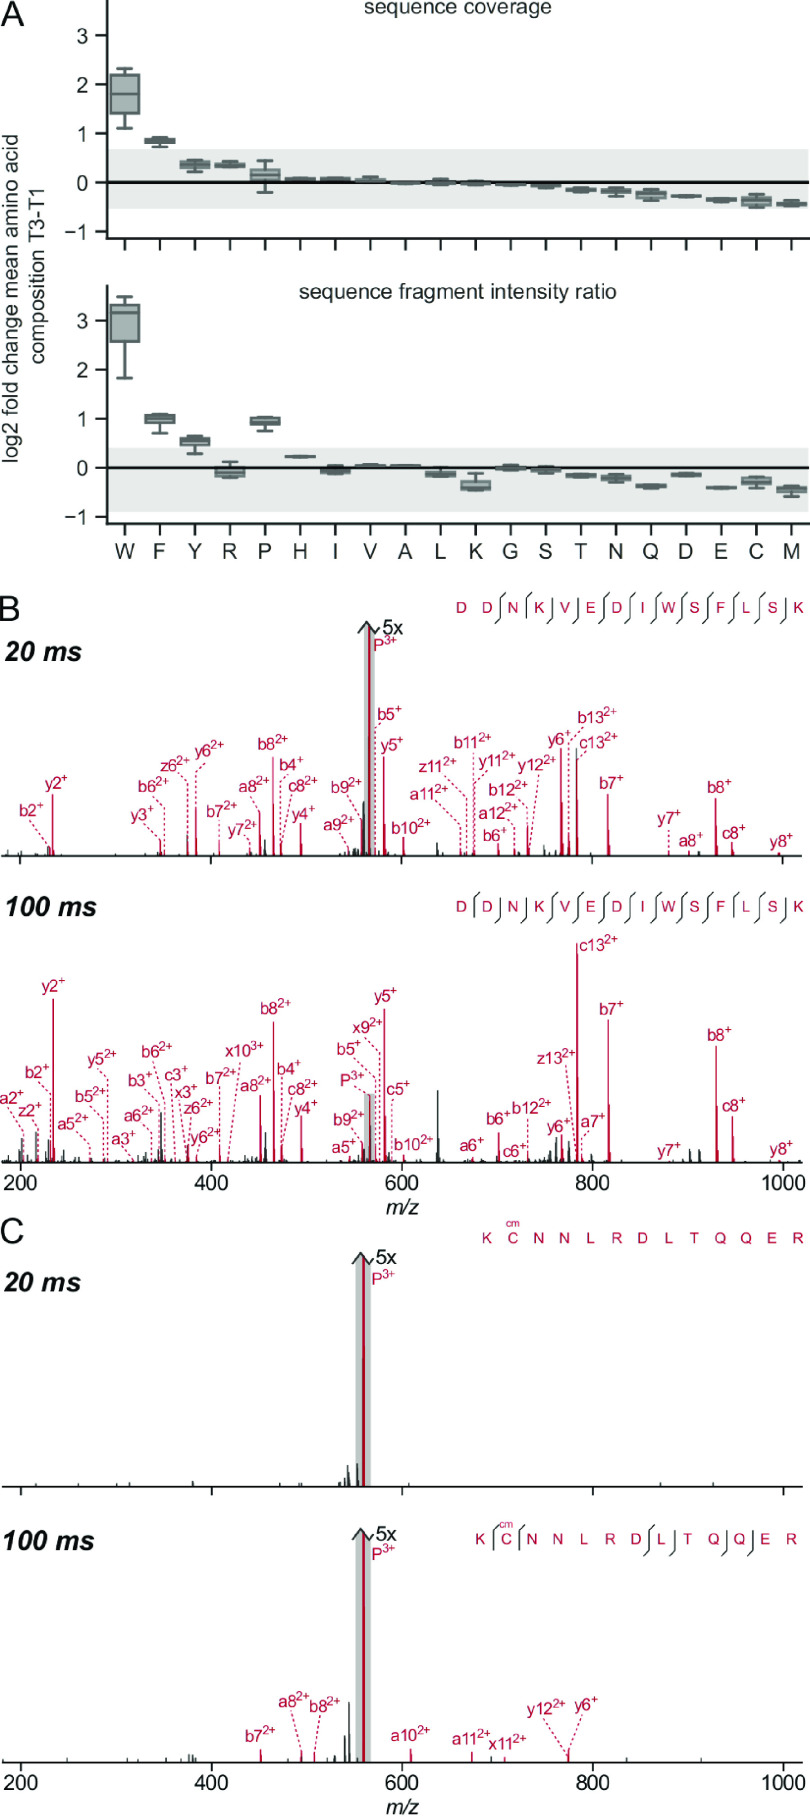
To systematically check the influence of the amino acid composition on the fragmentation of the whole peptide, we compared the mean amino acid composition of those peptides that fragmented well under UVPD with those that showed poor fragmentation over all acquired excitation times. We looked at the sequence coverage as well as the sequence fragment intensity ratio and divided our data into terciles for both of those metrics. We calculated the average frequency for each amino acid in the upper and lower terciles and compared the fold-change. This showed which amino acids were disproportionately prevalent in UVPD-susceptible peptides (Figure 6A). Peptides with high sequence coverage had a significantly increased frequency of tryptophan and phenylalanine. Looking at the sequence fragments’ intensity ratio, peptides in the upper tercile exhibited increased ratios of aromatic amino acids (most prominently again tryptophan). Interestingly, while a higher proline ratio seemed to translate into intense sequence fragments, it did not promote high sequence coverage, suggesting that proline leads only to the efficient cleavage of specific bonds (adjacent, see Figure 5). Figure 6 panels B and C show example spectra of two peptides at the same charge state and with similar m/z values both subjected to 20 and 100 ms UVPD. The peptide in panel B contains both a tryptophan and a phenylalanine and already shows almost complete sequence coverage at 20 ms but still an intense remaining precursor peak. At 100 ms, the precursor is almost completely fragmented. The peptide in panel C, on the other hand, contains no aromatic amino acids or proline. There is a complete absence of fragment peaks at 20 ms, and only very small low-intensity fragment peaks are present in the 100 ms spectrum.
Figure 6.
Influence of amino acid composition on peptide backbone fragmentation for UVPD. (A) The box plots show the log 2-fold change of the mean amino acid composition of PSMs in the upper tercile (T1) against the lower tercile (T3) in terms of sequence coverage and sequence fragment intensity ratio, respectively. Data from the E. coli data set was considered for the box plots. The spread of the respective HCD data is shown in gray as a reference. (B, C) Example spectra of two peptides with similar m/z values and the same charge state, both subjected to 20 and 100 ms UVPD. (B) DDNKVEDIWSFLSK containing both tryptophan and phenylalanine and (C) KCcmNNLRDLTQQER without any aromatic amino acids or proline.
Conclusions
In this study, we evaluated the fragmentation behavior of tryptic peptides in 213 nm UVPD. We see fragmentation on time-scales feasible for large-scale bottom-up experiments; however, the fragmentation efficiency is comparably low. Fragmentation seemed to be highly dependent on precursor properties, namely, the charge density and the presence of aromatic amino acids (and proline). We see a possibility in the development of supplemental activation techniques using collision-based methods to help improve fragmentation. Also, the use of an aromatic tag could increase photon absorption and possibly lead to increased spectral quality.
Acknowledgments
This work was supported by the Wellcome Trust (103139 and 108504) and the Deutsche Forschungsgemeinschaft (DFG, German Research Foundation, 329673113 and 426290502). The Wellcome Centre for Cell Biology is supported by core funding from the Wellcome Trust (203149).
Supporting Information Available
The Supporting Information is available free of charge at https://pubs.acs.org/doi/10.1021/jasms.0c00106.
The authors declare no competing financial interest.
Supplementary Material
References
- Brodbelt J. S. Photodissociation mass spectrometry: new tools for characterization of biological molecules. Chem. Soc. Rev. 2014, 43, 2757–2783. 10.1039/C3CS60444F. [DOI] [PMC free article] [PubMed] [Google Scholar]
- Hunt D. F.; Yates J. R. 3rd; Shabanowitz J.; Winston S.; Hauer C. R. Protein sequencing by tandem mass spectrometry. Proc. Natl. Acad. Sci. U. S. A. 1986, 83, 6233–6237. 10.1073/pnas.83.17.6233. [DOI] [PMC free article] [PubMed] [Google Scholar]
- Olsen J. V.; Macek B.; Lange O.; Makarov A.; Horning S.; Mann M. Higher-energy C-trap dissociation for peptide modification analysis. Nat. Methods 2007, 4, 709–712. 10.1038/nmeth1060. [DOI] [PubMed] [Google Scholar]
- Syka J. E. P.; Coon J. J.; Schroeder M. J.; Shabanowitz J.; Hunt D. F. Peptide and protein sequence analysis by electron transfer dissociation mass spectrometry. Proc. Natl. Acad. Sci. U. S. A. 2004, 101, 9528–9533. 10.1073/pnas.0402700101. [DOI] [PMC free article] [PubMed] [Google Scholar]
- Zubarev R. A.; Kelleher N. L.; McLafferty F. W. Electron Capture Dissociation of Multiply Charged Protein Cations. A Nonergodic Process. J. Am. Chem. Soc. 1998, 120, 3265–3266. 10.1021/ja973478k. [DOI] [Google Scholar]
- Brodbelt J. S. Ion Activation Methods for Peptides and Proteins. Anal. Chem. 2016, 88, 30–51. 10.1021/acs.analchem.5b04563. [DOI] [PMC free article] [PubMed] [Google Scholar]
- Fornelli L.; Srzentić K.; Toby T. K.; Doubleday P. F.; Huguet R.; Mullen C.; Melani R. D.; Dos Santos Seckler H.; DeHart C. J.; Weisbrod C. R.; Durbin K. R.; Greer J. B.; Early B. P.; Fellers R. T.; Zabrouskov V.; Thomas P.; Compton P. D.; Kelleher N. L. Thorough performance evaluation of 213 nm ultraviolet photodissociation for top-down proteomics. Mol. Cell. Proteomics 2020, 19, 405. 10.1074/mcp.TIR119.001638. [DOI] [PMC free article] [PubMed] [Google Scholar]
- Girod M.; Sanader Z.; Vojkovic M.; Antoine R.; MacAleese L.; Lemoine J.; Bonacic-Koutecky V.; Dugourd P. UV photodissociation of proline-containing peptide ions: insights from molecular dynamics. J. Am. Soc. Mass Spectrom. 2015, 26, 432–443. 10.1007/s13361-014-1038-1. [DOI] [PubMed] [Google Scholar]
- Mistarz U. H.; Bellina B.; Jensen P. F.; Brown J. M.; Barran P. E.; Rand K. D. UV Photodissociation Mass Spectrometry Accurately Localize Sites of Backbone Deuteration in Peptides. Anal. Chem. 2018, 90, 1077–1080. 10.1021/acs.analchem.7b04683. [DOI] [PubMed] [Google Scholar]
- Talbert L. E.; Julian R. R. Directed-Backbone Dissociation Following Bond-Specific Carbon-Sulfur UVPD at 213 nm. J. Am. Soc. Mass Spectrom. 2018, 29, 1760–1767. 10.1007/s13361-018-1934-x. [DOI] [PMC free article] [PubMed] [Google Scholar]
- Kolbowski L.; Mendes M. L.; Rappsilber J. Optimizing the Parameters Governing the Fragmentation of Cross-Linked Peptides in a Tribrid Mass Spectrometer. Anal. Chem. 2017, 89, 5311–5318. 10.1021/acs.analchem.6b04935. [DOI] [PMC free article] [PubMed] [Google Scholar]
- Rose C. M.; Rush M. J. P.; Riley N. M.; Merrill A. E.; Kwiecien N. W.; Holden D. D.; Mullen C.; Westphall M. S.; Coon J. J. A calibration routine for efficient ETD in large-scale proteomics. J. Am. Soc. Mass Spectrom. 2015, 26, 1848–1857. 10.1007/s13361-015-1183-1. [DOI] [PMC free article] [PubMed] [Google Scholar]
- Rappsilber J.; Ishihama Y.; Mann M. Stop and Go Extraction Tips for Matrix-Assisted Laser Desorption/Ionization, Nanoelectrospray, and LC/MS Sample Pretreatment in Proteomics. Anal. Chem. 2003, 75, 663. 10.1021/ac026117i. [DOI] [PubMed] [Google Scholar]
- Holman J. D.; Tabb D. L.; Mallick P. Employing ProteoWizard to Convert Raw Mass Spectrometry Data. Curr. Protoc. Bioinformatics. 2014, 46, 13.24.1–9. 10.1002/0471250953.bi1324s46. [DOI] [PMC free article] [PubMed] [Google Scholar]
- Mendes M. L.; Fischer L.; Chen Z. A.; Barbon M.; O’Reilly F. J.; Giese S. H.; Bohlke-Schneider M.; Belsom A.; Dau T.; Combe C. W.; Graham M.; Eisele M. R.; Baumeister W.; Speck C.; Rappsilber J. An integrated workflow for crosslinking mass spectrometry. Mol. Syst. Biol. 2019, 15, e8994 10.15252/msb.20198994. [DOI] [PMC free article] [PubMed] [Google Scholar]
- Fischer L.; Rappsilber J. Quirks of Error Estimation in Cross-Linking/Mass Spectrometry. Anal. Chem. 2017, 89, 3829–3833. 10.1021/acs.analchem.6b03745. [DOI] [PMC free article] [PubMed] [Google Scholar]
- Jones P.; Côté R. G.; Martens L.; Quinn A. F.; Taylor C. F.; Derache W.; Hermjakob H.; Apweiler R. PRIDE: a public repository of protein and peptide identifications for the proteomics community. Nucleic Acids Res. 2006, 34, D659–63. 10.1093/nar/gkj138. [DOI] [PMC free article] [PubMed] [Google Scholar]
- Kolbowski L.; Combe C.; Rappsilber J. xiSPEC: web-based visualization, analysis and sharing of proteomics data. Nucleic Acids Res. 2018, 46, W473–W478. 10.1093/nar/gky353. [DOI] [PMC free article] [PubMed] [Google Scholar]
- Frese C. K.; Altelaar A. F. M.; van den Toorn H.; Nolting D.; Griep-Raming J.; Heck A. J. R.; Mohammed S. Toward full peptide sequence coverage by dual fragmentation combining electron-transfer and higher-energy collision dissociation tandem mass spectrometry. Anal. Chem. 2012, 84, 9668–9673. 10.1021/ac3025366. [DOI] [PubMed] [Google Scholar]
- Michalski A.; Neuhauser N.; Cox J.; Mann M. A systematic investigation into the nature of tryptic HCD spectra. J. Proteome Res. 2012, 11, 5479–5491. 10.1021/pr3007045. [DOI] [PubMed] [Google Scholar]
- Horn D. M.; Ge Y.; McLafferty F. W. Activated ion electron capture dissociation for mass spectral sequencing of larger (42 kDa) proteins. Anal. Chem. 2000, 72, 4778–4784. 10.1021/ac000494i. [DOI] [PubMed] [Google Scholar]
- Good D. M.; Wirtala M.; McAlister G. C.; Coon J. J. Performance characteristics of electron transfer dissociation mass spectrometry. Mol. Cell. Proteomics 2007, 6, 1942–1951. 10.1074/mcp.M700073-MCP200. [DOI] [PubMed] [Google Scholar]
- Swaney D. L.; McAlister G. C.; Wirtala M.; Schwartz J. C.; Syka J. E. P.; Coon J. J. Supplemental activation method for high-efficiency electron-transfer dissociation of doubly protonated peptide precursors. Anal. Chem. 2007, 79, 477–485. 10.1021/ac061457f. [DOI] [PMC free article] [PubMed] [Google Scholar]
- Ledvina A. R.; McAlister G. C.; Gardner M. W.; Smith S. I.; Madsen J. A.; Schwartz J. C.; Stafford G. C. Jr; Syka J. E. P.; Brodbelt J. S.; Coon J. J. Infrared photoactivation reduces peptide folding and hydrogen-atom migration following ETD tandem mass spectrometry. Angew. Chem., Int. Ed. 2009, 48, 8526–8528. 10.1002/anie.200903557. [DOI] [PMC free article] [PubMed] [Google Scholar]
- Halim M. A.; Girod M.; MacAleese L.; Lemoine J.; Antoine R.; Dugourd P. Combined Infrared Multiphoton Dissociation with Ultraviolet Photodissociation for Ubiquitin Characterization. J. Am. Soc. Mass Spectrom. 2016, 27, 1435–1442. 10.1007/s13361-016-1419-8. [DOI] [PMC free article] [PubMed] [Google Scholar]
- Oh J. Y.; Moon J. H.; Kim M. S. Sequence- and site-specific photodissociation at 266 nm of protonated synthetic polypeptides containing a tryptophanyl residue. Rapid Commun. Mass Spectrom. 2004, 18, 2706–2712. 10.1002/rcm.1679. [DOI] [PubMed] [Google Scholar]
Associated Data
This section collects any data citations, data availability statements, or supplementary materials included in this article.


