Abstract
Objective
In this case–control study, we retrospectively analyzed the intestinal flora compositions of patients with early-stage chronic kidney disease (CKD).
Methods
Forty-seven patients with early CKD who were treated at the Traditional Chinese Medicine Hospital between March and October 2018 were enrolled, and 150 healthy volunteers were enrolled in the healthy control group. Fresh stool samples were collected. The V3–V4 region of the bacterial 16S rRNA was amplified via PCR. Biterminal sequencing was performed using the Illumina MiSeq platform. The flora compositions were compared between the two groups.
Results
The Chao1 and Shannon indices showed significantly lower intestinal flora diversity and abundances in the CKD group than in the healthy controls. Beta diversity analysis revealed notable differences in the intestinal flora compositions between the groups. At the phylum level, Actinobacteria and Proteobacteria abundances were significantly higher in the CKD group. Thirty-one species differed significantly between both groups, among which, differences in Ruminococcus and Roseburia displayed the highest diagnostic values for distinguishing CKD patients from healthy controls.
Conclusions
Intestinal flora compositions are altered in early-stage CKD patients among the Han population in southwestern China.
Keywords: Intestinal flora, chronic kidney disease, microorganism, bacteria, 16S rRNA, polymerase chain reaction
Introduction
Chronic kidney disease (CKD) is a syndrome characterized by symptoms/metabolic disorders caused by progressive renal dysfunction in patients with primary or secondary renal disease. CKD has an approximate incidence of 8% to 16%; it is one of the most common diseases affecting human health and thus has become a global public health issue.1 Diabetes, hypertension, obesity, metabolic syndrome and autoimmune diseases are common causes of CKD.2 Although the causes and risk factors for CKD can be much better controlled now than in the past, CKD-induced damage to the kidney structure and function is irreversible. CKD can ultimately progress to end-stage renal disease (ESRD) and affect multiple systems throughout the body, thus endangering the lives of CKD patients.
Human intestines contain over 1014 microorganisms, more than 10 times the total number of human cells. Types of intestinal microorganisms number in the thousands, constituting the largest symbiotic ecosystem in the human body.3 More than 400 species of intestinal microorganisms can be cultured and classified into dominant or secondary microflora according to their abundance. They can also be categorized as beneficial, harmful or neutral. Intestinal flora interact with the host organism, playing important roles in host metabolism, digestion, immunity and barrier protection.4 Studies have shown that alterations in the intestinal flora play important roles in the development of inflammatory bowel disease,5 hypertension,6 obesity,7 diabetes,8 and nonalcoholic fatty liver disease.9 A recent study showed that CKD progression is closely associated with alterations in the intestinal flora.10 The variety and amounts of probiotic bacteria, such as Lactobacillus, Prevotella and Bacillus bifidus, are significantly reduced in the intestines of CKD patients, whereas those of conditional pathogenic bacteria, such as Enterobacteria and Pseudomonas, are significantly increased.11 Research on the association between intestinal flora alterations and CKD development remains in its infancy, and systemic studies remain rare. In addition, many factors, such as age, dietary habits and geographical environment, influence the intestinal flora composition, which can vary greatly according to host ethnicity.12
In southwestern China, the CKD incidence is 10.8%, and approximately 1.5% of CKD cases involving a progressive decrease in the glomerular filtration rate develop into ESRD annually.13 Therefore, kidney diseases must urgently be prevented and treated in this region. We conducted a case-control study in southwestern China to retrospectively explore the association between intestinal flora alterations and early CKD development. The results of this study may add to current knowledge regarding intestinal flora diversity in CKD patients and provide a reference for future research on preventing and treating kidney diseases.
Materials and methods
Clinical data collection
Forty-seven patients with early CKD who treated at the Traditional Chinese Medicine Hospital Affiliated with Southwest Medical University between March and October 2018 were consecutively enrolled. Patients were diagnosed according to the Kidney Disease Outcomes Quality Initiative criteria for CKD, which defines CKD as abnormal kidney structure or function lasting more than 3 months (e.g., a urinary albumin excretion rate ≥30 mg/24 h).14 According to clinical staging,15 these patients were at stages II to III (glomerular filtration rate, 30–90 mL/minute/1.73 m2).
One hundred fifty healthy age- and sex-matched volunteers who received physical examinations at the same hospital and had no medical or family history of CKD were enrolled in the control group.
In each group, participants meeting one or more of the following criteria were excluded: 1) concomitant diarrhea or other intestinal diseases; 2) use of antibiotics or probiotics/prebiotics within 4 weeks before stool sampling; and 3) use of preparations containing diuretic constituents within 4 weeks before sampling. All participants were from the Han population.
The Ethics Committee of the Traditional Chinese Medicine Hospital Affiliated with Southwest Medical University (approval no. KY2019053) approved the study, which was conducted in accordance with the Declaration of Helsinki. All participants provided written informed consent.
Sampling and DNA extraction
Fresh stool was collected on the examination day or from the first stool after hospitalization. Samples (1–2 g) were stored in collection tubes containing a nucleic acid protection solution (LongseeMed, Guangzhou, China). Microbial DNA was extracted using a DNA extraction kit (LongseeMed) and stored at −80°C.
16S rDNA sequencing
Extracted DNA quality was assessed using 1% agarose gel electrophoresis, and the quantity was determined with a NanoDrop spectrophotometer (Thermo Fisher, Waltham, MA, USA). Primers targeting the V3–V4 region of the bacterial 16S rRNA genes V3F (ACTCCTACGGGAGGCAGCA) and V4R (GGACTACHVGGGTWTCTAAT) were used for amplification. The 25-µL reaction system consisted of 12.5 µL of KAPA HiFi HotStart ReadyMix (2X), 0.5 µL of Amplicon PCR Forward Primer (10 µM), 0.5 µL of Amplicon PCR Reverse Primer (10 µM), and 11.5 µL (20 ng) of Fast Pfu DNA. The amplification conditions were 95°C for 3 minutes; 25 cycles of 95°C for 30 s, 55°C for 30 s and 72°C for 30 s; and a final step at 72°C for 5 minutes. The PCR products were purified with KAPA Pure Beads, then subjected to a second round of amplification. The 50-µL PCR system consisted of 5 µL of Nextera XT Index Primer 1 (N7xx: 10 µM), 5 µL of Nextera XT Index Primer 2 (S5xx: 10 µM), 5 µL of KAPA HiFi HotStart ReadyMix (2X), 5 µL of Adaptor-ligated DNA, and 10 µL of sterilized ddH2O. The reactions were performed at 95°C for 3 minutes, followed by 6 cycles of 95°C for 30 s, 55°C for 30 s and 72°C for 30 s and a final step at 72°C for 5 minutes. Libraries of the sequenced samples were constructed. Concentrations were determined with a Qubit® 2.0 Fluorometer (Invitrogen; Carlsbad, CA, USA), and the library sizes were determined using an Agilent 2100 (Agilent; Chandler, AZ, USA). The V3–V4 hypervariable region of the amplified 16S rRNA was sequenced on the Illumina MiSeq PE250 platform (Illumina, San Diego, CA, USA).16
Bioinformatic analysis
The raw sequencing data (FASTQ) were trimmed and filtered using Trimmomatic v.0.32 software (http://www.usadellab.org/cms/index.php?page = trimmomatic). High-quality sequences with at least 97% similarity were clustered to obtain operational taxonomic units. Alpha and beta diversities were determined using QIIME2 V.2017.12 (http://qiime.org/) and R software, respectively. Chao1 and Shannon indices were used to assess α-diversity of the intestinal flora, and principal coordinate analysis (PCoA) and principal component analysis (PCA) were performed to assess β-diversity. Microbial taxa showing significant differences were analyzed using the linear discriminant analysis effect size (LEfSe) method. Intestinal flora functions were predicted via phylogenetic investigation of communities by reconstruction of unobserved states (PICRUSt). A receiver operating characteristics (ROC) curve was plotted to evaluate the diagnostic value of the flora markers, and canonical correspondence analysis (CCA) was performed to evaluate the correlation between the flora and clinical indices.
Statistical analysis
Data were analyzed using IBM SPSS Statistics for Windows version 20.0 (IBM Corp., Armonk, NY, USA ). Wilcoxon rank-sum and Kruskal–Wallis tests were performed. High-flux detection outcomes were subjected to descriptive analysis. P < 0.05 was considered statistically significant.
Results
Participant characteristics
The average age of the 47 participants with CKD was 43.2±12.6 years; the average age of the 150 healthy age- and sex-matched volunteers was 38.5±15.4 years.
Intestinal flora diversity
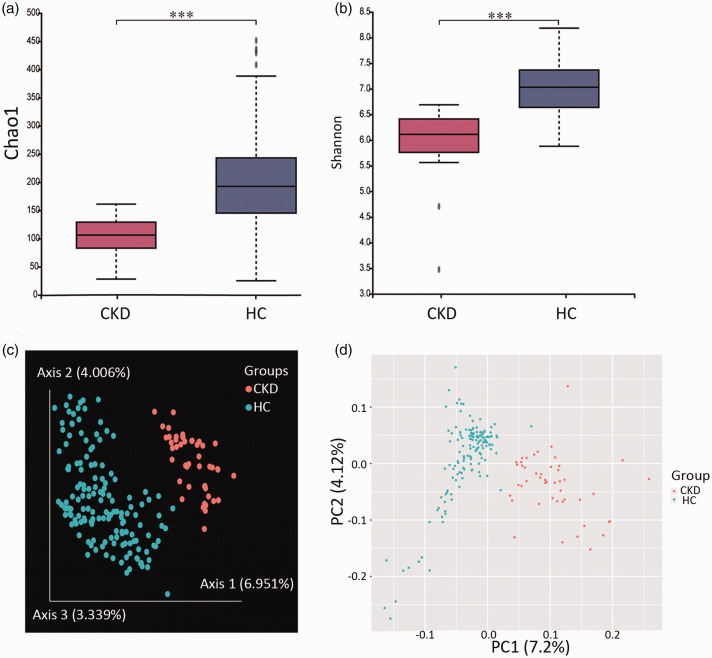
A total of 7,006,107 valid sequences were obtained, with an average of 35,564 sequences per sample. Chao1 and Shannon indices were used to evaluate the diversity and abundance of the microorganisms in the sample; higher values typically indicate greater diversity. Alpha-diversity analysis showed significantly lower Chao1 and Shannon values for the CKD group than for the healthy controls (P < 0.001, Figure 1a and b).
Figure 1.
Comparisons of intestinal flora diversity between chronic kidney disease patients and age- and sex-matched healthy controls. (a) Chao1 index for assessing α-diversity. (b) Shannon index for assessing α-diversity. (c) Principal coordinate analysis outcomes based on Bray–Curtis distance for β-diversity. % denotes the interpretation percentage of the principal component. (d) Principal component analysis outcomes for β-diversity. ***P<0.001, according to the Kruskal–Wallis test.
Bray–Curtis-based PCoA and PCA were performed to evaluate the β-diversity of the intestinal flora. The CKD patients and healthy controls showed a separating trend, suggesting that the intestinal flora composition in the CKD group differed from that in the healthy controls (Figure 1c and d).
Species variations of the intestinal flora
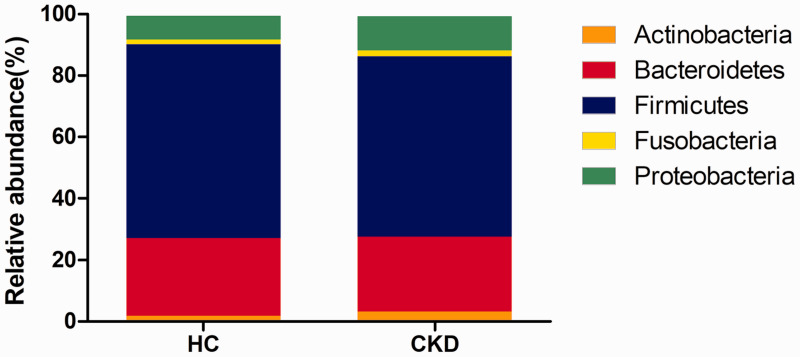
The intestinal flora of both the CKD patients and healthy controls contained 15 bacterial phyla, among which, Firmicutes, Bacteroidetes, Proteobacteria, and Fusobacteria were dominant (Figure 2). Compared with the healthy controls, the CKD group had significantly higher relative abundances of Proteobacteria and Actinobacteria (P = 0.023 and P = 0.016, respectively).
Figure 2.
Intestinal flora composition at the phylum level.
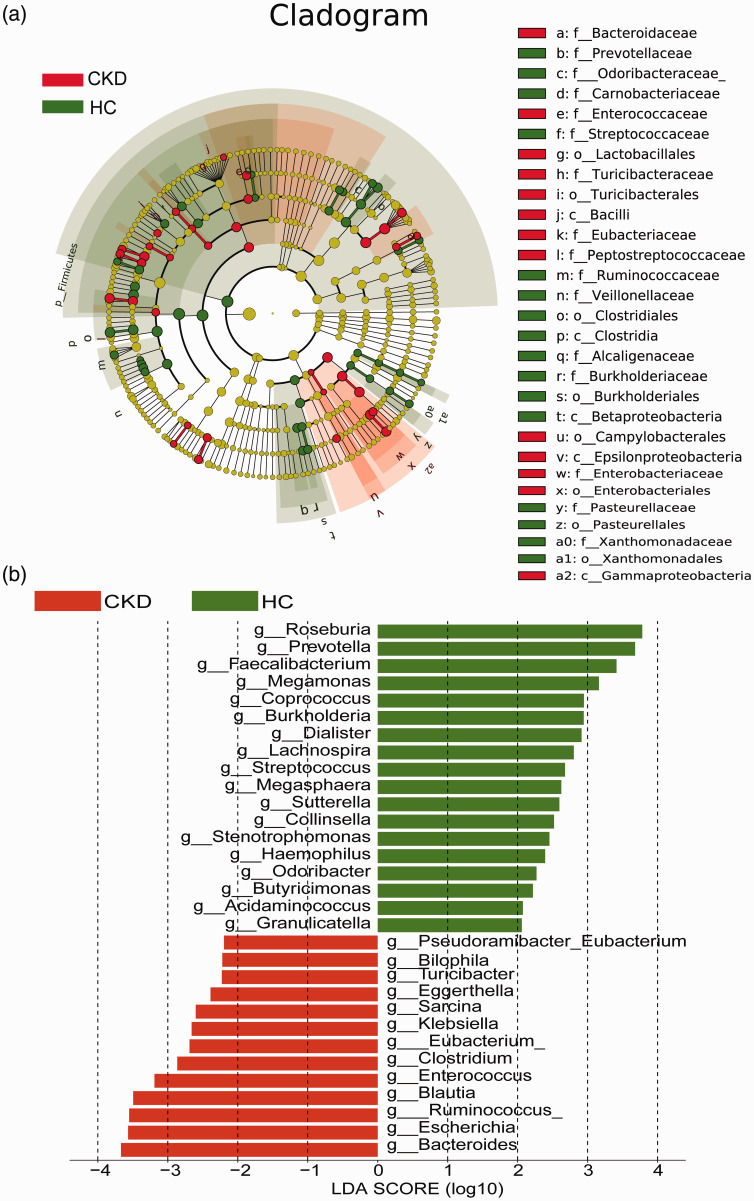
Bacterial species that differed significantly (P < 0.05) between the CKD patients and healthy controls were screened using LEfSe to construct a cladogram showing these species (Figure 3a). The histogram obtained via linear discriminant analysis showed that the abundances of 13 genera in the CKD group, i.e., Bacteroides, Escherichia, Ruminococcus, Blautia, Enterococcus, Clostridium, Eubacterium, Klebsiella, Sarcina, Eggerthella, Turicibacter, Bilophila and Pseudoramibacter, were significantly higher than those in the healthy controls. In the healthy controls, the abundances of 18 genera were significantly higher: Roseburia, Prevotella, Faecalibacterium, Megamonas, Coprococcus, Burkholderia, Dialister, Lachnospira, Streptococcus, Megasphaera, Sutterella, Collinsella, Stenotrophomonas, Haemophilus, Odoribacter, Butyricimonas, Acidaminococcus and Granulicatella (Figure 3b).
Figure 3.
Species that differed significantly between the chronic kidney disease (CKD) patients and healthy controls based on LEfSe. (a) Species with significantly different relative abundances (red dot, CKD group; green dot, healthy controls). (b) Species with significantly different abundances (red, CKD group; green, healthy controls). Only the taxonomic clusters with linear discriminant analysis >2.0 at the genus level are shown.
Functional annotations
PICRUSt functional prediction analysis was performed on the obtained 16S rRNA sequences to determine the abundance and enrichment of functional genes at different levels in the Kyoto Encyclopedia of Genes and Genomes (KEGG) pathways. According to the second-level KEGG pathway entries, the average relative abundances of genes in 35 KEGG pathways, including the endocrine system (P = 0.0001), amino acid metabolism (P = 0.0024) and lipid metabolism (P = 0.0048), were significantly lower in the CKD group than in the healthy controls (Table 1).
Table 1.
Second-level entries of the Kyoto Encyclopedia of Genes and Genomes pathways with significant differences between the chronic kidney disease (CKD) group and the healthy controls (HC).
| Pathway | CKD (M ± SD) | HC (M ± SD) | P value | FDR |
|---|---|---|---|---|
| Digestive System | 0.0033 ± 0.0013 | 0.0056 ± 0.0034 | <0.0001 | <0.0001 |
| Cell Motility | 0.0032 ± 0.0014 | 0.0057 ± 0.0038 | <0.0001 | <0.0001 |
| Endocrine System | 0.0037 ± 0.0010 | 0.0055 ± 0.0027 | <0.0001 | 0.0001 |
| Environmental Adaptation | 0.0036 ± 0.0011 | 0.0055 ± 0.0031 | <0.0001 | 0.0001 |
| Immune System | 0.0038 ± 0.0012 | 0.0055 ± 0.0027 | 0.0001 | 0.0005 |
| Translation | 0.0039 ± 0.0011 | 0.0055 ± 0.0027 | 0.0001 | 0.0005 |
| Glycan Biosynthesis and Metabolism | 0.0040 ± 0.0012 | 0.0054 ± 0.0026 | 0.0002 | 0.0010 |
| Metabolism of Cofactors and Vitamins | 0.0040 ± 0.0012 | 0.0054 ± 0.0027 | 0.0002 | 0.0010 |
| Metabolism of Terpenoids and Polyketides | 0.0040 ± 0.0012 | 0.0054 ± 0.0026 | 0.0003 | 0.0010 |
| Metabolic Diseases | 0.0039 ± 0.0010 | 0.0054 ± 0.0027 | 0.0003 | 0.0010 |
| Folding, Sorting and Degradation | 0.0040 ± 0.0012 | 0.0054 ± 0.0026 | 0.0003 | 0.0010 |
| Biosynthesis of Other Secondary Metabolites | 0.0039 ± 0.0011 | 0.0054 ± 0.0028 | 0.0003 | 0.0010 |
| Nucleotide Metabolism | 0.0040 ± 0.0012 | 0.0054 ± 0.0026 | 0.0004 | 0.0013 |
| Replication and Repair | 0.0040 ± 0.0012 | 0.0054 ± 0.0026 | 0.0005 | 0.0014 |
| Cell Growth and Death | 0.0040 ± 0.0011 | 0.0054 ± 0.0026 | 0.0005 | 0.0014 |
| Cancers | 0.0040 ± 0.0014 | 0.0054 ± 0.0026 | 0.0007 | 0.0017 |
| Enzyme Families | 0.0040 ± 0.0013 | 0.0054 ± 0.0026 | 0.0009 | 0.0023 |
| Genetic Information Processing | 0.0041 ± 0.0013 | 0.0054 ± 0.0026 | 0.0011 | 0.0023 |
| Immune System Diseases | 0.0039 ± 0.0013 | 0.0054 ± 0.0030 | 0.0011 | 0.0023 |
| Metabolism of Other Amino Acids | 0.0041 ± 0.0014 | 0.0054 ± 0.0026 | 0.0012 | 0.0024 |
| Amino Acid Metabolism | 0.0040 ± 0.0012 | 0.0054 ± 0.0027 | 0.0012 | 0.0024 |
| Nervous System | 0.0040 ± 0.0011 | 0.0054 ± 0.0027 | 0.0014 | 0.0027 |
| Energy Metabolism | 0.0041 ± 0.0013 | 0.0054 ± 0.0026 | 0.0017 | 0.0030 |
| Infectious Diseases | 0.0042 ± 0.0019 | 0.0053 ± 0.0026 | 0.0020 | 0.0034 |
| Signal Transduction | 0.0041 ± 0.0019 | 0.0054 ± 0.0029 | 0.0023 | 0.0037 |
| Cellular Processes and Signaling | 0.0042 ± 0.0016 | 0.0054 ± 0.0026 | 0.0031 | 0.0047 |
| Poorly Characterized | 0.0042 ± 0.0014 | 0.0054 ± 0.0026 | 0.0031 | 0.0047 |
| Lipid Metabolism | 0.0041 ± 0.0013 | 0.0054 ± 0.0027 | 0.0033 | 0.0048 |
| Transport and Catabolism | 0.0041 ± 0.0011 | 0.0054 ± 0.0028 | 0.0037 | 0.0052 |
| Transcription | 0.0042 ± 0.0015 | 0.0054 ± 0.0027 | 0.0086 | 0.0117 |
| Carbohydrate Metabolism | 0.0042 ± 0.0014 | 0.0053 ± 0.0027 | 0.0110 | 0.0145 |
| Xenobiotics Biodegradation and Metabolism | 0.0043 ± 0.0017 | 0.0053 ± 0.0026 | 0.0121 | 0.0155 |
| Signaling Molecules and Interaction | 0.0042 ± 0.0011 | 0.0053 ± 0.0026 | 0.0150 | 0.0187 |
| Metabolism | 0.0044 ± 0.0017 | 0.0053 ± 0.0026 | 0.0246 | 0.0297 |
| Membrane Transport | 0.0044 ± 0.0019 | 0.0053 ± 0.0027 | 0.0364 | 0.0427 |
Notes: M ± SD, mean ± standard deviation; FDR, false discovery rate.
Diagnostic values of the microbial markers
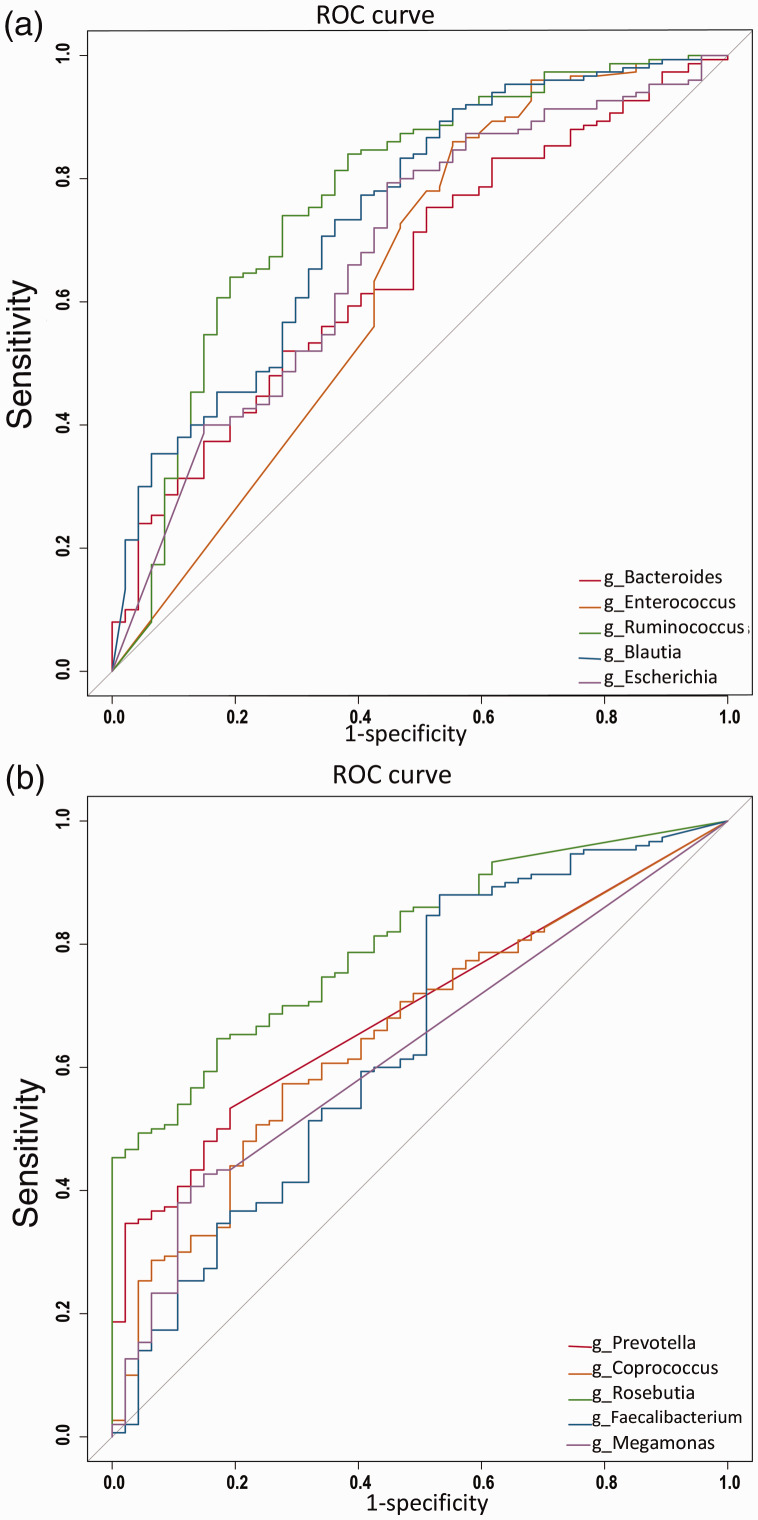
ROC curves were plotted using the top five genera of both groups according to linear discriminant analysis scoring, and the area under the curve (AUC) was calculated to assess whether the intestinal microflora could be used to distinguish between the CKD patients and healthy controls. The results showed that Ruminococcus had the highest diagnostic value for the CKD group (AUC = 0.771; 95% confidence interval [CI], 0.771–0.852) (Figure 4a), whereas Roseburia had the highest diagnostic value for the healthy controls (AUC = 0.803; 95% CI, 0.804–0.864; Figure 4b).
Figure 4.
Receiver operating characteristic (ROC) curves for microbial markers. (a) ROCs for the top genera in the chronic kidney disease group according to linear discriminant analysis (LDA) scoring. (b) ROCs for the top genera in the healthy controls according to LDA scoring.
Canonical correspondence analysis (CCA)
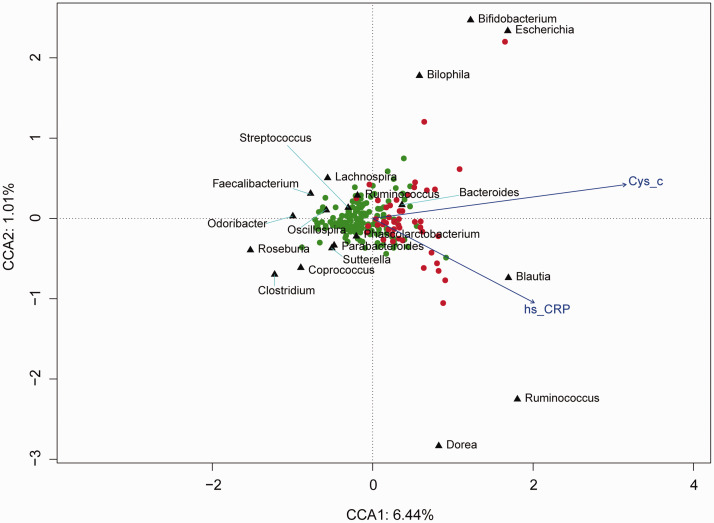
To further assess the association between intestinal microflora and environmental factors, CCA was performed between cystatin C (Cys_c) and C-reactive protein (CRP) and the intestinal microflora. Escherichia, Bilophila and Blautia were positively correlated with Cys_c and CRP and were enriched in the CKD group; Roseburia was negatively correlated with Cys_c and CRP and was enriched in the healthy controls (Figure 5).
Figure 5.
Associations between internal environmental factors and intestinal microflora in the chronic kidney disease (CKD) patients and healthy controls. Black triangles represent different microbial types; the red and green dots represent the CKD group and healthy controls, respectively. The explained variances of the primary axes (axis 1 [horizontal] and axis 2 [vertical]) are 6.44% and 1.01%, respectively. The length of the environmental parameter arrow indicates the intensity of the environmental parameter effect on all microflora.
Discussion
The intestinal microecosystem is continuously evolving, and its microbial diversity and abundance play important roles in maintaining a normal physiological state; however, the host also influences the intestinal microflora.17 In this study, 16S rRNA sequencing was performed on stool samples from patients with early-stage CKD and healthy volunteers in southwestern China using high-flux sequencing. The relative abundances of each intestinal microbial species and their diversities and compositions were compared between CKD patients and healthy age- and sex-matched controls. The results showed significantly decreased intestinal flora diversity and an altered intestinal flora composition in the CKD patients compared with those of the healthy controls.
CKD is closely associated with intestinal flora imbalance.18–20 Among the imbalanced intestinal flora in CKD patients, flora that induce carbohydrate fermentation are decreased, whereas those that induce protein fermentation are increased. Furthermore, endogenous uremic toxins, such as indoxyl sulfate, p-cresol sulfate and trimethylamine oxide, accumulate in large amounts, thus damaging renal tubular epithelial cells, leading to renal interstitial fibrosis.21,22 The CKD-colon axis theory states that CKD can alter the intestinal flora and cause gut barrier dysfunction, leading to intestinal flora translocation, excessive uremic toxins and systemic inflammatory reactions. This condition further accelerates CKD development, ultimately forming a vicious cycle between the kidney and the gut.23 A study in California, USA, found that the relative abundances of Proteobacteria (primarily Gammaproteobacteria), Actinobacteria and Firmicutes (particularly Clostridium subphylum) were increased in patients with ESRD.11 In ESRD patients from South China, the absolute amounts of all bacteria were significantly decreased, and the abundances of butyrate-producing Roseburia, Faecalibacterium, Clostridium, Coprococcus and Prevotella were decreased.24 In the present study, the α-diversity of the intestinal flora in the CKD group was significantly lower than that in the healthy controls. β-diversity analysis showed that the UniFrac distance between the CKD group and the healthy controls tended to separate, indicating an altered intestinal flora composition in patients with early-stage CKD. This finding was consistent with previous literature.25,26
Firmicutes, Bacteroides, Proteobacteria and Actinomycetes are the dominant bacterial phyla in the intestines, and a proportional imbalance in the intestinal flora plays an important role in the development of chronic inflammatory diseases.27,28 In children with ESRD, the relative abundance of Proteobacteria is increased, while the relative abundances of Firmicutes and Actinomycetes are decreased. Ingested iron supplements can promote an increase in the Proteobacteria abundance in ESRD patients.29 In patients with colitis-associated colorectal cancer, Proteobacteria occupy a dominant position over other intestinal bacterial phyla. In mice, high abundances of Proteobacteria cause local or systemic inflammation and metabolic dysfunction, which increase susceptibility to chronic colitis.30 In our study, the CKD group displayed higher relative abundances of Proteobacteria and Actinobacteria than did the healthy controls, further suggesting a possible association between intestinal flora alterations and CKD.
Thirty-one species differed significantly between the CKD group and the healthy controls and may serve as biomarkers for distinguishing CKD patients from healthy individuals. ROC curves showed that Ruminococcus and Roseburia had the best diagnostic performance. Ruminococcus belongs to an important group of intestinal probiotic microbial flora that degrade and transform complex polysaccharides into nutrients for the host.31 In individuals with Crohn’s disease, Ruminococcus affects CKD development by producing inflammatory polysaccharides.32 Roseburia is another important component of the intestinal flora; it produces butyrate, which has anti-inflammatory and immunoregulatory functions. In patients with metabolic and inflammatory diseases, the relative abundance of intestinal Roseburia is decreased.33 In mice with different genetic backgrounds, Roseburia correlated negatively with atheromatosis development.34 Decreased Roseburia might damage local gastrointestinal tract function, thereby aggravating inflammation in CKD patients.35 The results of this study were consistent with those reported in the literature.32–35
Amino acids are the main precursors of uremic solutes, such as indoxyl sulfate and cresol sulfate, and metabolism of intestinal amino acids becomes imbalanced with CKD development.36 In this study, the CKD patients had significantly lower average relative gene abundances in 35 KEGG pathways, including amino acid metabolism, lipid metabolism and the endocrine system, suggesting that CKD patients experience metabolic dysfunction.
This study had some limitations. Because of the small sample size, we did not explore the association between different CKD stages and the intestinal flora composition. Therefore, further studies with larger sample sizes should validate the use of different intestinal flora compositions as markers for diagnosing CKD. Furthermore, the combination of clinical data relative to CKD pathological staging should be analyzed to determine the diagnostic value of the intestinal flora composition for CKD, and the mechanisms by which the intestinal flora composition influences CKD development should be explored.
Conclusions
The intestinal flora composition is greatly altered in CKD patients. Detection of different intestinal flora compositions may be a useful diagnostic measure for early CKD.
Declaration of conflicting interest
The authors declare that there are no conflicts of interest.
Funding
This study was supported by the Foundation of Traditional Chinese Medicine Hospital Affiliated with Southwest Medical University (2018XYLH-025, 2018), the Project of the Science & Technology Department of Sichuan Province (14ZC0027), the Project of the Health Department of Sichuan Province (16ZD034), and the Luzhou Project (2018LZXNYD-PT03, 2017-R-65).
ORCID iD
Qiong Zhang https://orcid.org/0000-0003-4762-9191
References
- 1.Anders HJ, Andersen K, Stecher B. The intestinal microbiota, a leaky gut, and abnormal immunity in kidney disease. Kidney Int 2013; 83: 1010–1016. [DOI] [PubMed] [Google Scholar]
- 2.Mikolasevic I, Racki S, Zaputovic L, et al. Nonalcoholic fatty liver disease (NAFLD): a new risk factor for adverse cardiovascular events in dialysis patients. Med Hypotheses 2014; 82: 205–208. [DOI] [PubMed] [Google Scholar]
- 3.Hooper LV, Littman DR, Macpherson AJ. Interactions between the microbiota and the immune system. Science 2012; 336: 1268–1273. [DOI] [PMC free article] [PubMed] [Google Scholar]
- 4.Rackaityte E, Lynch SV. Rules of engagement in the gut microbiome. Nat Med 2018; 24: 1642–1644. [DOI] [PubMed] [Google Scholar]
- 5.Chassaing B, Koren O, Goodrich JK, et al. Dietary emulsifiers impact the mouse gut microbiota promoting colitis and metabolic syndrome. Nature 2015; 519: 92. [DOI] [PMC free article] [PubMed] [Google Scholar]
- 6.Li J, Zhao F, Wang F, et al. Gut microbiota dysbiosis contributes to the development of hypertension. Microbiome 2017; 5: 14. [DOI] [PMC free article] [PubMed] [Google Scholar]
- 7.Rosenbaum M, Knight F, Leibel RL. The gut microbiota in human energy homeostasis and obesity. Trends Endocrinol Metab 2015; 26: 493–501. [DOI] [PMC free article] [PubMed] [Google Scholar]
- 8.Gülden E, Wong FS, Wen L. The gut microbiota and type 1 diabetes. Clin Immunol 2015; 159: 143–153. [DOI] [PMC free article] [PubMed] [Google Scholar]
- 9.Caussy C, Hsu C, Min-Tzu L, et al. Novel link between gut-microbiome derived metabolite and shared gene-effects with hepatic steatosis and fibrosis in NAFLD. J Hepatol 2018; 68: 918–932. [DOI] [PMC free article] [PubMed] [Google Scholar]
- 10.Afsar B, Vaziri ND, Aslan G, et al. Gut hormones and gut microbiota: implications for kidney function and hypertension. J Am Soc Hypertens 2016; 10: 954–961. [DOI] [PubMed] [Google Scholar]
- 11.Vaziri ND, Wong J, Pahl M, et al. Chronic kidney disease alters intestinal microbial flora. Kidney Int 2013; 83: 308–315. [DOI] [PubMed] [Google Scholar]
- 12.Ursell LK, Clemente JC, Rideout JR, et al. The interpersonal and intrapersonal diversity of human-associated microbiota in key body sites. J Aller Cl Imm 2012; 129: 1204–1208. [DOI] [PMC free article] [PubMed] [Google Scholar]
- 13.Zou Y, Wen Y, Pu L, et al. Epidemiology of initial hemodialysis patients in Sichuan province during (2011∼2016). J Nephrol Dialy Transplant 2018; 27: 311–314, 395. [Google Scholar]
- 14.Chen TK, Knicely DH, Grams ME. Chronic kidney disease diagnosis and management: a review. JAMA 2019; 322: 1294–1304. [DOI] [PMC free article] [PubMed] [Google Scholar]
- 15.Qaseem A, Hopkins RH, Sweet DE, et al. Screening, monitoring, and treatment of stage 1 to 3 chronic kidney disease: a clinical practice guideline from the American College of Physicians. Ann Intern Med 2013; 159: 835–847. [DOI] [PubMed] [Google Scholar]
- 16.Derakhshani H, Tun HM, Khafipour E. An extended single‐index multiplexed 16S rRNA sequencing for microbial community analysis on MiSeq illumina platforms. J Basic Microbiol 2016; 56: 321–326. [DOI] [PubMed] [Google Scholar]
- 17.Lin CS, Chang CJ, Lu CC, et al. Impact of the gut microbiota, prebiotics, and probiotics on human health and disease. Biomed J 2014; 37: 259. [DOI] [PubMed] [Google Scholar]
- 18.Chung S, Barnes JL, Astroth KS, et al. Gastrointestinal microbiota in patients with chronic kidney disease: A systematic review. Adv Nutr 2019; 10(5): 888–901. [DOI] [PMC free article] [PubMed] [Google Scholar]
- 19.Ramezani A, Massy ZA, Meijers B, et al. Role of the gut microbiome in uremia: a potential therapeutic target. Am J Kidney Dis 2015; 67: 483–498. [DOI] [PMC free article] [PubMed] [Google Scholar]
- 20.Wing MR, Patel SS, Ramezani A, et al. Gut microbiome in chronic kidney disease. Exp Physiol 2016; 101: 471–477. [DOI] [PubMed] [Google Scholar]
- 21.Ridaura VK, Faith JJ, Rey FE, et al. Gut microbiota from twins discordant for obesity modulate metabolism in mice. Science 2013; 341: 1079-U49. [DOI] [PMC free article] [PubMed] [Google Scholar]
- 22.Tang WH, Wang Z, Kennedy DJ, et al. Gut microbiota-dependent trimethylamine N-oxide (TMAO) pathway contributes to both development of renal insufficiency and mortality risk in chronic kidney disease. Circ Res 2015; 116: 448–455. [DOI] [PMC free article] [PubMed] [Google Scholar]
- 23.Chen YY, Chen DQ, Chen L, et al. Microbiome–metabolome reveals the contribution of gut–kidney axis on kidney disease. J Transl Med 2019; 17: 5. [DOI] [PMC free article] [PubMed] [Google Scholar]
- 24.Jiang S, Xie S, Lv D, et al. Alteration of the gut microbiota in Chinese population with chronic kidney disease. Sci Rep 2017; 7: 2870. [DOI] [PMC free article] [PubMed] [Google Scholar]
- 25.Lun H, Yang W, Zhao S, et al. Altered gut microbiota and microbial biomarkers associated with chronic kidney disease. MicrobiologyOpen 2019; 8: e00678. [DOI] [PMC free article] [PubMed] [Google Scholar]
- 26.Guirong YE, Minjie Z, Lixin YU, et al. Gut microbiota in renal transplant recipients, patients with chronic kidney disease and healthy subjects. J Southern Med Univ 2018; 38: 1401–1408. [DOI] [PMC free article] [PubMed] [Google Scholar]
- 27.Larsen N, Vogensen FK, van den Berg FWJ, et al. Gut microbiota in human adults with type 2 diabetes differs from non-diabetic adults. PLoS One 2010; 5: e9085. [DOI] [PMC free article] [PubMed] [Google Scholar]
- 28.Hedrich S, Schlömann M, Johnson DB. The iron-oxidizing proteobacteria. Microbiology 2011; 157: 1551–1564. [DOI] [PubMed] [Google Scholar]
- 29.Crespo-Salgado J, Vehaskari VM, Stewart T, et al. Intestinal microbiota in pediatric patients with end stage renal disease: a Midwest Pediatric Nephrology Consortium study. Microbiome 2016; 4: 50. [DOI] [PMC free article] [PubMed] [Google Scholar]
- 30.Shin NR, Whon TW, Bae JW. Proteobacteria: microbial signature of dysbiosis in gut microbiota. Trend Biotechnol 2015; 33: 496–503. [DOI] [PubMed] [Google Scholar]
- 31.La Reau AJ, Suen G. The Ruminococci: key symbionts of the gut ecosystem. J Microbiol 2018; 56: 199–208. [DOI] [PubMed] [Google Scholar]
- 32.Henke MT, Kenny DJ, Cassilly CD, et al. Ruminococcus gnavus, a member of the human gut microbiome associated with Crohn’s disease, produces an inflammatory polysaccharide. P Natl A Sci 2019; 116: 12672–12677. [DOI] [PMC free article] [PubMed] [Google Scholar]
- 33.Forbes JD, Chen C, Knox NC, et al. A comparative study of the gut microbiota in immune-mediated inflammatory diseases—does a common dysbiosis exist? Microbiome 2018; 6: 1–15. [DOI] [PMC free article] [PubMed] [Google Scholar]
- 34.Kasahara K, Krautkramer KA, Org E, et al. Interactions between Roseburia intestinalis and diet modulate atherogenesis in a murine model. Nat Microbiol 2018; 3: 1461–1471. [DOI] [PMC free article] [PubMed] [Google Scholar]
- 35.Chung SY, Barnes JL, Astroth KS. Gastrointestinal microbiota in patients with chronic kidney disease: a systematic review. Adv Nutr 2019; 10: 888–901. [DOI] [PMC free article] [PubMed] [Google Scholar]
- 36.Liu Y, Li J, Yu J, et al. Disorder of gut amino acids metabolism during CKD progression is related with gut microbiota dysbiosis and metagenome change. J Pharm Biomed Anal 2018; 149: 425–435. [DOI] [PubMed] [Google Scholar]


