

Abstract
Head and neck cancer (HNC) risk prediction models based on risk factor profiles have not yet been developed. We took advantage of the large database of the International Head and Neck Cancer Epidemiology (INHANCE) Consortium, including 14 US studies from 1981–2010, to develop HNC risk prediction models. Seventy percent of the data were used to develop the risk prediction models; the remaining 30% were used to validate the models. We used competing-risk models to calculate absolute risks. The predictors included age, sex, education, race/ethnicity, alcohol drinking intensity, cigarette smoking duration and intensity, and/or family history of HNC. The 20-year absolute risk of HNC was 7.61% for a 60-year-old woman who smoked more than 20 cigarettes per day for over 20 years, consumed 3 or more alcoholic drinks per day, was a high school graduate, had a family history of HNC, and was non-Hispanic white. The 20-year risk for men with a similar profile was 6.85%. The absolute risks of oropharyngeal and hypopharyngeal cancers were generally lower than those of oral cavity and laryngeal cancers. Statistics for the area under the receiver operating characteristic curve (AUC) were 0.70 or higher, except for oropharyngeal cancer in men. This HNC risk prediction model may be useful in promoting healthier behaviors such as smoking cessation or in aiding persons with a family history of HNC to evaluate their risks.
Keywords: absolute risk, head and neck cancer, hypopharyngeal cancer, laryngeal cancer, oral cavity cancer, oropharyngeal cancer, risk prediction
Abbreviations
- AF
attributable fraction
- AUC
area under the receiver operating characteristic curve; HNC, head and neck cancer
- HPV
human papillomavirus
- INHANCE
International Head and Neck Cancer Epidemiology
- PAR
population attributable risk
- SEER
Surveillance, Epidemiology, and End Results
Head and neck cancer (HNC) includes malignancies of the oral cavity, oropharynx, hypopharynx, and larynx. Worldwide, more than half a million HNC cases (706,000 cases) and 358,000 deaths due to HNC are estimated to occur each year (1). In the United States in 2018, 47,650 HNC cases were diagnosed among men and 17,040 among women (64,690 HNC cases in total) (2). Tobacco and alcohol accounted for a large proportion of HNC cases in Latin America (82.9%) and Europe (84.3%), whereas in the United States they accounted for 50.5% (3).
Additional HNC risk factors include family history of HNC (4), socioeconomic status (5), exposure to asbestos and inorganic acid mists (occupational) for laryngeal cancer (6, 7), and allelic variation in the alcohol metabolism genes alcohol dehydrogenase 1B (ADH1B) and alcohol dehydrogenase 7 (ADH7) (8). Although HNC incidence rates have been decreasing with the decreasing prevalence of tobacco smoking in the United States over the last few decades, the incidence of oropharyngeal cancer has been increasing because of human papillomavirus (HPV) infection (9). Suspected HNC risk factors include passive tobacco smoke exposure (10), marijuana use (11), low (≤18.5 vs. 18.6–25.0) body mass index (weight (kg)/height (m)2) (12), no coffee intake (vs. >4 cups/day) (13), poor oral hygiene for oral cavity cancer (14, 15), a low level (<2 hours/week or ≤1 time/week) of physical activity (16), and certain sexual behaviors (such as having ≥4 lifetime oral sex partners) (17).
Risk prediction models have been developed for cancers of the breast, colorectum, prostate, lung, ovary, and esophagus (18, 19). To date, 1 tool for HNC risk prediction based on age, sex, and clinical signs/symptoms has been developed (20). In a recent study, Koyanagi et al. (21) considered both genetic and environmental risk factors in the prediction of risk of upper aerodigestive tract cancer in Japan, but HNC subsites were not evaluated separately. Thus, HNC risk prediction models or tools based on risk factor profiles that separate results by subsite have not been developed, possibly because of the limited sample sizes in individual studies. The International Head and Neck Cancer Epidemiology (INHANCE) Consortium provides a unique opportunity for risk prediction modeling, with a large sample of HNC cases and controls included in the pooled database (22). In this study, we aimed to take advantage of this large collaboration to develop risk prediction models for HNC, both overall and for each major HNC subsite (oral cavity, oropharynx, hypopharynx, and larynx), for the US population.
METHODS
Study population
To analyze risk factors and to develop a model for prediction of HNC risk in the US population, we used the pooled individual data (version 1.5) within the INHANCE Consortium (22). Written informed consent was obtained from every study participant. In addition, investigators at each study site obtained approval from their institutional review board. Questionnaires from each individual study were examined to assess the comparability of the data and of the wording of questions among the studies. Each variable was checked for illogical or missing values, and data inconsistencies were resolved through communication with study investigators.
Of the 35 HNC studies in the INHANCE database, there were 14 studies with required information on well-established and suspected HNC risk factors from the United States, including 7,299 HNC cases and 10,301 controls (23–36). The studies included were those from Seattle, Washington; Iowa; Tampa, Florida; Los Angeles, California; Houston, Texas; Boston, Massachusetts; Baltimore, Maryland; and North Carolina (2 studies: 1994–1997 and 2002–2006), as well as a New York State multicenter study, a US multicenter study, a Memorial Sloan Kettering Cancer Center (New York, New York) study, the Seattle–Larynx, Esophagus, and Oral Cavity (LEO) Study, and the Human Papillomavirus (HPV) Oral Transmission Study in Partners Over Time (HOTSPOT) (see Web Table 1, available at https://academic.oup.com/aje).
Patients were included in this analysis if their cancers were classified by the original study’s investigators as an invasive tumor of the oral cavity, oropharynx, hypopharynx, or larynx. Patients with cancers of the major salivary glands (parotid, submandibular, or sublingual glands) or of the nasal cavity/ear/paranasal sinuses were not included in this analysis. International Classification of Diseases (Ninth and Tenth Revisions) codes were used to classify cancers into subsites and were then converted to the following International Classification of Diseases for Oncology, Second Edition, codes: 1) for cancers of the oral cavity (includes lip, tongue, gum, floor of mouth, and hard palate): codes C00.3–C00.9, C02.0–C02.3, C03.0, C03.1, C03.9, C04.0, C04.1, C04.8, C04.9, C05.0, C06.0–C06.2, C06.8, and C06.9; 2) for cancers of the oropharynx (includes base of the tongue, lingual tonsil, soft palate, uvula, tonsil, and oropharynx): codes C01.9, C02.4, C05.1, C05.2, C09.0, C09.1, C09.8, C09.9, C10.0, C10.2–C10.4, C10.8, and C10.9; 3) for cancers of the hypopharynx (includes pyriform sinus and hypopharynx): codes C12.9, C13.0–C13.2, C13.8, and C13.9; and 4) for cancers of the larynx (includes glottis, supraglottis, and subglottis): codes C10.1, C32.0–C32.3, and C32.8–C32.9.
Statistical analysis
Seventy percent of the data were randomly selected across all studies as the training data set, whereas 30% were randomly selected as the testing data set for the purpose of validating the established risk prediction models. On the basis of a randomly selected 70% of the study population, we estimated odds ratios for each risk factor using generalized linear mixed models (PROC GLIMMIX in SAS (SAS Institute, Inc., Cary, North Carolina)) for each subsite and for HNC overall. We tested interactions between identified risk factors by including the product terms of the risk factors in the logistic regression models. Attributable fractions (AFs) for all identified risk factors were calculated using the equation  (37), where x is the total number of cases, xj is the number of cases in the jth stratum, and Rj is the odds ratio estimate for the jth stratum.
The baseline hazard rate was defined as the hazard rate for persons with the lowest level of each identified risk factor. The age-specific baseline hazard rates for HNC overall and for each subsite were computed by multiplying the age-specific (<45, 45–49, 50–54, 55–59, 60–64, 65–69, 70–74, 75–79, 80–84, or ≥85 years) and sex-specific Surveillance, Epidemiology, and End Results (SEER) incidence rates (38) by (1 − (total AF across all of the risk factors for each HNC subsite)) (39). Competing mortality hazards from causes other than HNC were obtained from the National Center for Health Statistics (40). The SEER incidence rates from 1981–2009 were used to correspond to the time periods of recruitment in the studies pooled for this analysis.
On the basis of the Freedman et al. (39) model, we developed an HNC risk prediction model for the US population that accounted for competing risks of death from causes other than the cancer of interest and considered tumor subsites separately. This method allowed us to consider the competing risks for cancer at the other HNC subsites (oral cavity, oropharynx, hypopharynx, and larynx) to estimate the probability of HNC development (absolute risk). Each HNC subsite was modeled separately to account for risk factor variation in the different subsites.
The absolute risk Pr(a, b) of HNC in the age interval (a, b) is the probability of being diagnosed with a first primary HNC during that age interval for an individual, given that the person is alive and has no HNC at the beginning of the interval (a). The mathematical equation for the absolute risk of HNC is
 |
(1) |
where  , x is a vector of covariates, and
  . The main components of our model are the hazard rates
  for HNC incidence and the hazard rates
  for competing causes of death other than HNC. We modeled
  , which is the product of the age-specific baseline hazard rate (rate from SEER × (1 − AF)) and the relative risk (RR), including covariates (i = HNC, oral, oropharynx, hypopharynx, or larynx). RRi(a, x) is the product of odds ratios from the individual’s risk profile, including tobacco smoking, alcohol drinking, etc. Four separate relative risk models were fitted for the HNC subsites (oral cavity, oropharynx, hypopharynx and larynx) and were combined as shown in the equation to generate the HNC overall risk prediction model. Covariates in the hazard for competing causes of death other than HNC were not included.
For example, using equation 1, the probability that men aged 50 years will develop oral cancer in the next 10 years is
 |
where h1 is the baseline hazard rate (i.e., the rate at age 50 or 55 years in this example) for getting oral cancer and h2 is the baseline hazard rate for dying of causes other than oral cancer, respectively. The variable r represents the relative risk (0.2 in this example).  are age-specific survival probabilities from oral cancer and causes other than oral cancer, respectively. The first part of the calculation in the equation is for the age interval 50–54 years, and the second part is for the age interval 55–59 years. Summing the 2 parts generates the probability of developing first primary oral cancer in the next 10 years for men who are 50 years of age.
The first set of risk prediction models for the HNC subsites included the well-established risk factors, such as age (<45, 45–49, 50–54, 55–59, 60–64, 65–69, 70–74, 75–79, 80–84, or ≥85 years), sex (male, female), race/ethnicity (non-Hispanic white, other), education (less than high school, high school, more than high school), cigarette smoking duration (never smoker, ≤20 years, or >20 years) and intensity (never smoker, ≤20 cigarettes/day, or >20 cigarettes/day), and/or alcohol drinking intensity (never or light drinker, 1–<3 drinks/day, or ≥3 drinks/day), whereas the second set of models additionally included family history of HNC, except for oropharyngeal cancer in both sexes and laryngeal cancer in men, where a clear risk was not observed in our current data. The models were examined for model fit using the area under the receiver operating characteristic curve (AUC) (Web Table 2). Family history of HNC was included in the second set of models because of its associations with HNC risk in our previous INHANCE study (4). For all models stratified by sex, the logistic regression coefficients for age <50 years and age ≥50 years were used. The AFs were age- and sex-specific on the basis of the assumption that the AFs were the same for all persons under age 50 years and all persons aged 50 years or over. Although we would have liked to use finer age strata, we would have needed even larger sample sizes to delineate the risks for finer strata. For the models with family history of HNC, however, the same logistic regression coefficients were used for all ages because of sparse data. Absolute risks by 5-year increments were estimated by subsite and overall.
Although HPV infection is an important risk factor for oropharyngeal cancer, we decided not to include HPV infection status in the current risk prediction models, since most people in a general population do not know their HPV 16 or HPV 18 infection status and the purpose of the risk prediction is for individuals to assess their risks. HPV assessment in the HNC studies included in the current data was largely based on serological assessment of HPV 16. With the multiple testing methods (HPV DNA, p16) and variation in biosample sources (blood, tumor tissue) that can be used to assess HPV infection status, each having a different sensitivity and specificity, we did not feel it would be appropriate to create a risk prediction model based on serology, with the general population possibly using information on HPV status based on other types of tests. We assessed the impact of HPV 16 infection status on the HNC risk prediction model for oropharyngeal cancer separately for research purposes. Inclusion of HPV 16 infection status in the HNC risk prediction model was beyond the scope of this current report, since we would like to develop a risk prediction model that the general public can use with basic information about lifestyle habits that would not require a laboratory test. However, for reference purposes, we have provided the absolute risks for oropharyngeal cancer with consideration of HPV 16 status in Web Table 3.
In order to validate the HNC risk prediction models developed with the testing database, we used the remaining 30% of the pooled database for the US population to calculate AUC statistics (41) for oral cavity, oropharyngeal, hypopharyngeal, and laryngeal cancer. In addition, we prepared calibration plots to compare the mean predicted probability and the mean observed probability by decile of predicted probability. A good prediction model should produce a plot in which predicted probability and observed probability are equal (42).
Analyses were performed using SAS, version 9.4, with 2-sided P values.
RESULTS
Our study included 7,299 HNC cases (5,349 men and 1,950 women) and 10,301 controls (6,864 men and 3,437 women) (Table 1). By subsite, there were 2,388 oral cavity, 2,820 oropharynx, 459 hypopharynx, and 1,632 larynx cancer cases. The majority (>80%) of the study population was non-Hispanic white among both cases and controls. Controls had a higher level of education than cases among both men and women.
Table 1.
Demographic Characteristics of Head and Neck Cancer Cases and Controls, by Sex and Tumor Subsite, INHANCE Consortium, 1981–2010
| Characteristic | Controls | Cases | ||||||||||
|---|---|---|---|---|---|---|---|---|---|---|---|---|
| Total | Tumor Subsite | |||||||||||
| Oral Cavity | Oropharynx | Hypopharynx | Larynx | |||||||||
| No. | % | No. | % | No. | % | No. | % | No. | % | No. | % | |
| Men (n = 6,864) | ||||||||||||
| Age, years | ||||||||||||
| <50 | 1,412 | 20.6 | 1,065 | 19.9 | 337 | 21.7 | 505 | 23.3 | 50 | 14.2 | 173 | 13.5 |
| 50–59 | 2,290 | 33.4 | 1,842 | 34.4 | 504 | 32.4 | 832 | 38.4 | 105 | 29.9 | 401 | 31.4 |
| 60–69 | 2,091 | 30.5 | 1,670 | 31.2 | 457 | 29.4 | 630 | 29.1 | 118 | 33.6 | 465 | 36.4 |
| ≥70 | 1,071 | 15.6 | 772 | 14.4 | 256 | 16.5 | 200 | 9.2 | 78 | 22.2 | 238 | 18.6 |
| Race/ethnicity | ||||||||||||
| nHW | 5,837 | 85.4 | 4,431 | 83.1 | 1,320 | 85.4 | 1,839 | 84.9 | 257 | 73.6 | 1,015 | 80.0 |
| Other | 1,000 | 14.6 | 898 | 16.9 | 226 | 14.6 | 326 | 15.1 | 92 | 26.4 | 254 | 20.0 |
| Education | ||||||||||||
| >HS | 4,348 | 63.4 | 2,448 | 46.2 | 716 | 46.6 | 1,141 | 53.0 | 137 | 39.6 | 454 | 35.9 |
| HS | 1,314 | 19.1 | 1,320 | 24.9 | 360 | 23.4 | 476 | 22.1 | 81 | 23.4 | 403 | 31.9 |
| <HS | 1,200 | 17.5 | 1,529 | 28.9 | 460 | 29.9 | 535 | 24.9 | 128 | 37.0 | 406 | 32.1 |
| Women (n = 3,437) | ||||||||||||
| Age, years | ||||||||||||
| <50 | 844 | 24.6 | 351 | 18.0 | 139 | 16.7 | 132 | 20.2 | 11 | 10.2 | 69 | 19.4 |
| 50–59 | 1,097 | 31.9 | 589 | 30.2 | 211 | 25.3 | 231 | 35.4 | 32 | 29.6 | 115 | 32.4 |
| 60–69 | 923 | 26.9 | 613 | 31.4 | 254 | 30.5 | 192 | 29.4 | 42 | 38.9 | 125 | 35.2 |
| ≥70 | 573 | 16.7 | 397 | 20.4 | 230 | 27.6 | 98 | 15.0 | 23 | 21.3 | 46 | 13.0 |
| Race/ethnicity | ||||||||||||
| nHW | 2,843 | 83.1 | 1,682 | 86.3 | 740 | 88.7 | 562 | 86.3 | 86 | 79.6 | 294 | 82.8 |
| Other | 579 | 16.9 | 266 | 13.7 | 94 | 11.3 | 89 | 13.7 | 22 | 20.4 | 61 | 17.2 |
| Education | ||||||||||||
| >HS | 2,051 | 59.7 | 873 | 44.9 | 382 | 46.1 | 341 | 52.4 | 54 | 50.0 | 96 | 27.0 |
| HS | 824 | 24.0 | 535 | 27.5 | 236 | 28.5 | 152 | 23.3 | 23 | 21.3 | 124 | 34.9 |
| <HS | 561 | 16.3 | 535 | 27.5 | 211 | 25.5 | 158 | 24.3 | 31 | 28.7 | 135 | 38.0 |
Abbreviations: HS, high school; INHANCE, International Head and Neck Cancer Epidemiology; nHW, non-Hispanic white.
Web Table 2 shows the fit statistics greater than 0.75 for the models with family history of HNC, except for oropharyngeal cancer in men. The tobacco × alcohol interaction was included only for oral cavity cancer in both men and women and laryngeal cancer in men, because the interaction was not detected for the other subsites. In addition, we also kept the risk prediction models without family history of HNC in case people do not know their family history of HNC. The odds ratio estimates based on the prediction models for men and women by HNC subsite are presented in Web Tables 4 and 5. The risk factors with odds ratios showing increased risks as expected were included in the risk prediction.
Examples of 20-year absolute risk estimates from HNC risk prediction models with different risk factor profiles among men and women are shown in Table 2 and Table 3, respectively. The highest 20-year risk of HNC observed for women was 8.09%, for a 60-year-old woman who smoked more than 20 cigarettes per day for over 20 years, consumed 3 or more alcoholic drinks per day, had a high school education, had a family history of HNC, and was of “other” race/ethnicity. For men, the corresponding 20-year risk for HNC was 9.31%. For a person with the same risk profile regardless of sex, in general the absolute risks of getting oropharyngeal and hypopharyngeal cancers were smaller than those for oral cavity and laryngeal cancers. Absolute risk predictions by subsite for all combinations of risk profiles (more than 5,000 combinations) are provided in Web Table 6.
Table 2.
Examples of 20-Year Absolute Risk Estimates (%) for Head and Neck Cancer in Men, by Risk Factor Profile, INHANCE Consortium, 1981–2010
|
Age and Alcohol
Consumption, drinks/day |
Cigarette Smoking | Education | Race/Ethnicity | Family History of HNC | Tumor Subsite | All HNCs | ||||
|---|---|---|---|---|---|---|---|---|---|---|
| Intensity, cigarettes/day | Duration,years | Oral Cavity | Oropharynx | Hypopharynx | Larynx | |||||
| Age 45 years | ||||||||||
| <1 | 0 | 0 | >HS | nHW | No | 0.10 | 0.06 | 0.01 | 0.02 | 0.19 |
| <1 | >20 | >20 | HS | nHW | No | 0.24 | 0.09 | 0.04 | 0.38 | 0.74 |
| ≥3 | >20 | >20 | >HS | nHW | Unknown | 1.08 | 0.39 | 0.25 | 0.77 | 2.47 |
| ≥3 | >20 | >20 | >HS | nHW | Yes | 1.85 | 0.39 | 0.35 | 0.77 | 3.33 |
| ≥3 | >20 | >20 | HS | Other | Unknown | 1.34 | 0.49 | 0.56 | 1.73 | 4.06 |
| ≥3 | >20 | >20 | HS | Other | Yes | 2.68 | 0.49 | 0.94 | 1.73 | 5.72 |
| Age 60 years | ||||||||||
| <1 | 0 | 0 | >HS | nHW | No | 0.14 | 0.06 | 0.01 | 0.04 | 0.25 |
| <1 | >20 | >20 | HS | nHW | No | 0.33 | 0.10 | 0.07 | 0.81 | 1.30 |
| ≥3 | >20 | >20 | >HS | nHW | Unknown | 1.75 | 0.44 | 0.45 | 1.55 | 4.14 |
| ≥3 | >20 | >20 | >HS | nHW | Yes | 2.52 | 0.44 | 0.65 | 1.55 | 5.07 |
| ≥3 | >20 | >20 | HS | Other | Unknown | 2.13 | 0.49 | 1.00 | 3.73 | 7.25 |
| ≥3 | >20 | >20 | HS | Other | Yes | 3.64 | 0.57 | 1.70 | 3.73 | 9.31 |
Abbreviations: HNC, head and neck cancer; HS, high school; INHANCE, International Head and Neck Cancer Epidemiology; nHW, non-Hispanic white.
Table 3.
Examples of 20-Year Absolute Risk Estimates (%) for Head and Neck Cancer in Women, by Risk Factor Profile, INHANCE Consortium, 1981–2010
|
Age and Alcohol
Consumption, drinks/day |
Cigarette Smoking | Education | Race/Ethnicity | Family History of HNC | Tumor Subsite | All HNCs | ||||
|---|---|---|---|---|---|---|---|---|---|---|
| Intensity, cigarettes/day | Duration, years | Oral Cavity | Oropharynx | Hypopharynx | Larynx | |||||
| Age 45 years | ||||||||||
| <1 | 0 | 0 | >HS | nHW | No | 0.06 | 0.01 | 0.00 | 0.01 | 0.08 |
| <1 | >20 | >20 | HS | nHW | No | 0.20 | 0.05 | 0.02 | 0.26 | 0.53 |
| ≥3 | >20 | >20 | >HS | nHW | Unknown | 1.01 | 0.42 | 0.11 | 0.13 | 1.68 |
| ≥3 | >20 | >20 | >HS | nHW | Yes | 0.98 | 0.42 | 1.40 | 0.52 | 3.30 |
| ≥3 | >20 | >20 | HS | Other | Unknown | 1.34 | 0.45 | 0.21 | 0.43 | 2.26 |
| ≥3 | >20 | >20 | HS | Other | Yes | 1.42 | 0.45 | 1.85 | 1.12 | 4.77 |
| Age 60 years | ||||||||||
| <1 | 0 | 0 | >HS | nHW | No | 0.10 | 0.02 | 0.00 | 0.01 | 0.13 |
| <1 | >20 | >20 | HS | nHW | No | 0.35 | 0.07 | 0.04 | 0.38 | 0.85 |
| ≥3 | >20 | >20 | >HS | nHW | Unknown | 1.73 | 0.59 | 0.21 | 0.51 | 3.06 |
| ≥3 | >20 | >20 | >HS | nHW | Yes | 1.71 | 0.59 | 2.71 | 0.76 | 5.71 |
| ≥3 | >20 | >20 | HS | Other | Unknown | 2.13 | 0.60 | 0.41 | 0.97 | 4.23 |
| ≥3 | >20 | >20 | HS | Other | Yes | 2.47 | 0.60 | 3.58 | 1.64 | 8.09 |
Abbreviations: HNC, head and neck cancer; HS, high school; INHANCE, International Head and Neck Cancer Epidemiology; nHW, non-Hispanic white.
Examples of risk profile changes were also compared for men and women at age 60 years across HNC subsites and for HNC overall. Web Figures 1 and 2 show that higher alcohol drinking intensity and higher cigarette smoking intensity and duration increased an individual’s absolute 20-year risk. For men, when smoking intensity increased from ≤20 cigarettes/day to >20 cigarettes/day, the 20-year absolute risks increased from 2.73% to 4.60% for cancer of the oral cavity, from 0.56% to 0.74% for the oropharynx, from 1.89% to 2.50% for the hypopharynx, from 2.99% to 5.52% for the larynx, and from 7.92% to 12.70% for HNC overall. For women, for the same increase in smoking intensity, the 20-year absolute risks increased from 2.61% to 3.54% for the oral cavity, from 0.31% to 0.60% for the oropharynx, from 1.97% to 4.07% for the hypopharynx, from 1.63% to 3.50% for the larynx, and from 6.40% to 11.26% for HNC overall.
Figure 1 shows the receiver operating characteristic curves for validation of the HNC risk prediction models by cancer subsite, based on the remaining 30% of the INHANCE consortium database for the US population. The AUC statistics were 0.70 or higher, except for oropharyngeal cancer in men. In addition, the calibration plots by decile of predicted probability demonstrated that the predicted probability was similar to the mean observed probability through the confidence intervals overlapping with the 45o line (Figure 2).
Figure 1.

Receiver operating characteristic curve for models of head and neck cancer risk based on a validating data set (30% of INHANCE Consortium cases and controls), 1981–2010. A) Male oral cavity cancer (AUC = 0.752); B) female oral cavity cancer (AUC = 0.718); C) male oropharyngeal cancer (AUC = 0.643); D) female oropharyngeal cancer (AUC = 0.745); E) male hypopharyngeal cancer (AUC = 0.784); F) female hypopharyngeal cancer (AUC = 0.820); G) male laryngeal cancer (AUC = 0.794); H) female laryngeal cancer (AUC = 0.870). AUC, area under the receiver operating characteristic curve; INHANCE, International Head and Neck Cancer Epidemiology.
Figure 2.
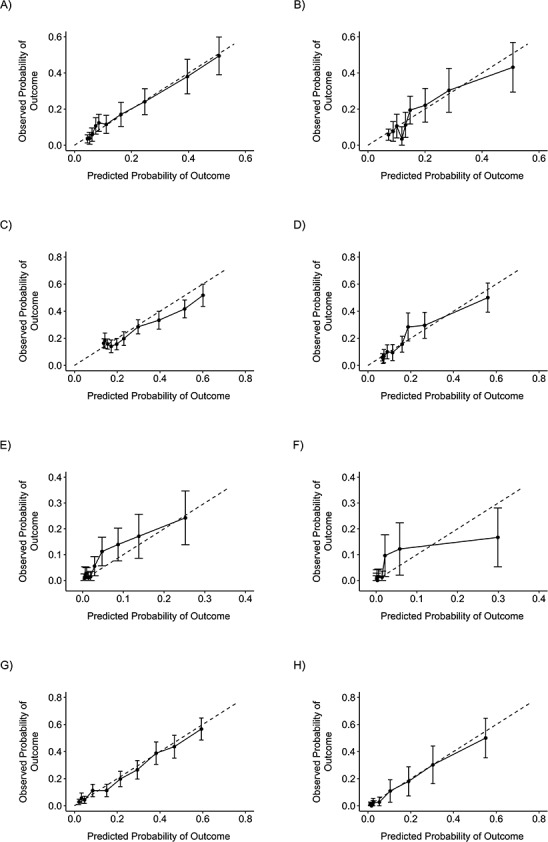
Calibration plots comparing the predicted probability of head and neck cancer with the observed probability in risk models based on a validating data set (30% of INHANCE Consortium cases and controls), 1981–2010. A) Male oral cavity cancer; B) female oral cavity cancer; C) male oropharyngeal cancer; D) female oropharyngeal cancer; E) male hypopharyngeal cancer; F) female hypopharyngeal cancer; G) male laryngeal cancer; H) female laryngeal cancer. Bars, 95% confidence intervals. INHANCE, International Head and Neck Cancer Epidemiology.
DISCUSSION
Our INHANCE HNC risk prediction models included the variables age, sex, alcohol drinking intensity, cigarette smoking intensity and duration, education, race/ethnicity, and/or family history of HNC. Among all of the factors included, cigarette smoking, alcohol drinking, and education were the strongest predictors. As expected, the impacts of increased intensity of alcohol drinking and/or increased intensity and duration of cigarette smoking were much greater than those of the other characteristics included in the risk profile. In general, the absolute risks of HNC increased with age. However, the absolute risks decreased starting from age 65 or 70 years. Such decreasing trends may be due to competing risk of death from diseases other than HNC at older ages, since we accounted for the probability of dying from diseases other than HNC.
To our knowledge, this HNC risk prediction model is the first to use demographic characteristics and lifestyle habits (cigarette smoking and alcohol drinking) and family history of HNC with consideration of HNC subsites. The only other HNC risk calculator currently available was developed on the basis of age, sex, and clinical symptoms, which most likely are present when HNC is developing or has developed (20). Thus, it was meant for referral purposes. Our HNC risk prediction model aimed to provide absolute risks in order to facilitate early primary prevention intervention, such as motivation for behavioral changes.
The observed associations with education, cigarette smoking, and alcohol drinking suggested that these factors have a stronger impact on the absolute risks of hypopharyngeal cancer and laryngeal cancer than on those for oral cavity cancer and oropharyngeal cancer. Such observations are consistent with the previous literature (43, 44). Anantharaman et al. (43) reported that a larger proportion of hypopharyngeal/laryngeal cancer (population attributable risk (PAR) = 85%) is attributable to tobacco and alcohol use together than the proportions of oropharyngeal (PAR = 74%), esophageal (PAR = 67%), and oral cavity (PAR = 61%) cancer. Our previous INHANCE study on education suggested stronger associations with hypopharyngeal and laryngeal cancer than with oral cavity and oropharyngeal cancer (44). Consequently, increased cigarette smoking intensity and duration resulted in a greater increase in the absolute risk of laryngeal cancer than for the other HNC subsites. In this analysis, these subsite differences were more apparent in men than in women.
It is beneficial for individuals to understand their absolute risks of HNC to aid in decisions on behavioral changes. However, the manner in which the absolute risks are communicated to each person is important. Gigerenzer et al. (45) suggested that some health professionals may not understand health statistics correctly and may draw incorrect conclusions, and they recommended using absolute risks instead of relative risks. Thus, the aim of our risk predictions was to assist in the evaluation of a person’s HNC risk based on his/her risk factor profile, which may lead to personalized prevention intervention strategies. For example, a 50-year-old non-Hispanic white man who consumed 3 alcoholic drinks per day, smoked more than 20 cigarettes per day for 10 years, had less than a high school education, and had a family history of HNC might consider quitting smoking, so that his 20-year risk of HNC at age 60 years would be 2.27% instead of 3.58%. However, the impact on individual decisions should be evaluated to understand the extent of the benefit conferred by the risk prediction through efficacy demonstration as part of a clinical trial of risk reduction strategies. A broader assessment of risk along with other endpoints for patients in clinical settings may also be valuable, as suggested by Wentzensen et al. (46).
A recent study based on data from the Prostate, Lung, Colorectal, and Ovarian Cancer Screening Trial suggested that lung cancer risk prediction models may perform better than the current lung cancer screening guidelines in identifying persons at high risk of lung cancer (47). In addition, another, more recent study also suggested 4 lung cancer risk models that helped to select US ever smokers for screening (48). Although the current US Preventive Services Task Force does not recommend screening for oral cancer (49), a previous study in India demonstrated that oral cancer screening among tobacco smokers and alcohol drinkers is effective in high-risk populations (50). In the future, as more HNC risk prediction models are developed, it would be of interest to test whether these risk prediction models can be used to identify high-risk individuals for behavioral intervention or oral cancer screening.
There were some limitations with regard to our study. First, there were sparse data for HNC subsites, even though our overall data set was large. Thus, selected variables, such as race/ethnicity or family history of HNC, were not included in the models, as indicated in Web Table 2. However, the AUCs of the predicting models suggested that the models were good to fair. Although the 95% confidence intervals for women might have been wide due to sparse data when stratified by subsite and consequently may have affected the absolute risk estimates, this was the largest available HNC data set compiled to date that could be used for HNC risk prediction in the US population. Second, since the data were from case-control studies, recall bias on responses to questionnaires might be a concern. HNC patients may have exaggerated their tobacco or alcohol use in comparison with controls. However, our risk estimates were comparable to those of a previous cohort study carried out in the United States (51); thus, recall bias may not be a major issue. Third, we could only calculate the relative risks from the data of pooled case-control studies. Nonetheless, since HNC is considered a rare cancer outcome, the odds ratio estimates were comparable to those of previous studies. Furthermore, this was the largest study population available for HNC risk prediction estimation in the US population.
Fourth, hospital-based controls may be a concern for generalizability of the results. Thus, we performed some comparisons of cigarette smoking and alcohol drinking prevalence between our study hospital-based control population and our study population-based control population, as well as the US general population. On the basis of data from the 2009 National Health Interview Survey, 62% of participants had ever smoked at least 100 cigarettes in their lifetime (52). In our data, 61% of persons in our overall control populations (ranging from 51% to 66%, except for 1 study with 37%) had ever smoked at least 100 cigarettes in their lifetime (62% of the population-based controls and 59% of the hospital-based controls). On the basis of the same national survey, 80% had ever consumed alcohol, whereas 75% of our overall control population (ranging from 53%–93%) had ever consumed alcohol. These comparisons supported the generalizability of our data to the US population. In any case, in the future, development of risk prediction models in pooled analysis of cohort studies would be valuable. Alternatively, it would be valuable to apply data from the cohort studies to our model and assess how accurately the results track with the observed data from the cohorts. Fifth, heterogeneity by study and time period was observed when the AFs were evaluated by study design and time period (Web Table 7). Thus, we carried out all of the prediction analyses with random-effects models to account for variances across studies. Finally, the incidence rates from the SEER statistics showed changes over time, although the changes were less extensive than those for laryngeal cancer. This suggests that absolute risk calculation for individuals will require the utilization of the latest available rates in order to capture accurate absolute risks of HNC. We aim to develop a tool that will accommodate such a changing variable for individuals to obtain their absolute risks in the future.
The major strength of our study was that the INHANCE Consortium has the largest sample size available for HNC cases, as well as for cancers at HNC subsites, for performance of risk prediction modeling. To the best of our knowledge, this is the first risk prediction model for HNC with detailed estimation of risks for each subsite (oral cavity, oropharynx, hypopharynx, and larynx) and for the combined risks based on age, sex, education, race/ethnicity, alcohol drinking intensity, cigarette smoking duration and intensity, and/or family history of HNC. We have provided the risk prediction for over 5,000 different combinations of risk profiles as a supplemental file (Web Table 6). For the prediction validation, we conducted internal validation within INHANCE by splitting the database randomly across all studies into a model development data set (70%) and a validation data set (30%) in order to use independent observations to obtain the AUC statistics for validation purposes. Since we restricted the analysis to the United States, our results are less vulnerable to heterogeneity of risk factor prevalence across world regions and countries. However, our results may not be generalizable to populations outside of the United States. We hope to pursue HNC risk prediction for Europe and East Asia as a future research direction.
In summary, we have developed an INHANCE HNC risk prediction model that includes age, sex, alcohol drinking intensity, cigarette smoking intensity and duration, education, race/ethnicity, and/or family history of HNC. We calculated individualized risk estimates specifically for HNC subsites, including oral cavity, oropharyngeal, hypopharyngeal, and laryngeal cancer, with respect to these specific risk factors. This HNC risk prediction model may be useful in a clinical setting for identifying high-risk individuals, for promoting healthier behaviors such as smoking or alcohol drinking cessation/reduction, or for aiding people with a family history of HNC to evaluate their HNC risks.
Supplementary Material
ACKNOWLEDGMENTS
Author affiliations: Division of Public Health, Department of Family and Preventive Medicine, School of Medicine, University of Utah, Salt Lake City, Utah (Yuan-Chin Amy Lee, Mohammed Al-Temimi, Mia Hashibe); Huntsman Cancer Institute, Salt Lake City, Utah (Yuan-Chin Amy Lee, Mohammed Al-Temimi, Mia Hashibe, Marcus Monroe); Kaiser Fontana Residency Program, Arrowhead Regional Medical Center, Fontana, California (Mohammed Al-Temimi); Department of Internal Medicine, School of Medicine, University of Utah, Salt Lake City, Utah (Jian Ying); Division of Epidemiology, Department of Public Health Sciences, Penn State College of Medicine, Hershey, Pennsylvania (Joshua Muscat); Department of Epidemiology, School of Public Health, University of North Carolina at Chapel Hill, Chapel Hill, North Carolina (Andrew F. Olshan); Department of Otolaryngology/Head and Neck Surgery, School of Medicine, Washington University, St. Louis, Missouri (Jose P. Zevallos); Division of Cancer Control and Population Sciences, National Cancer Institute, Bethesda, Maryland (Deborah M. Winn); Department of Head and Neck Surgery, Division of Surgery, University of Texas M.D. Anderson Cancer Center, Houston, Texas (Guojun Li, Erich M. Sturgis, Neil Gross); Departments of Epidemiology and Environmental Health Sciences, School of Public Health, University of Michigan, Ann Arbor, Michigan (Hal Morgenstern); Department of Urology, University of Michigan Medical School, Ann Arbor, Michigan (Hal Morgenstern); Department of Epidemiology, School of Public Health, University of California, Los Angeles, Los Angeles, California (Zuo-Feng Zhang); Department of Epidemiology, College of Public Health, University of Iowa, Iowa City, Iowa (Elaine Smith); Department of Epidemiology, School of Public Health, Brown University, Providence, Rhode Island (Karl Kelsey); Department of Pathology and Laboratory Medicine, Warren Alpert Medical School, Brown University, Providence, Rhode Island (Karl Kelsey); Department of Environmental Health, School of Public Health, Boston University, Boston, Massachusetts (Michael McClean); Fred Hutchinson Cancer Research Center, Seattle, Washington (Thomas L. Vaughan, Chu Chen, Stephen M. Schwartz); Department of Pharmaceutical Sciences, College of Pharmacy and Pharmaceutical Sciences, Washington State University, Spokane, Washington (Philip Lazarus); Thoracic/Head and Neck Medical Oncology, University of Texas M.D. Anderson Cancer Center, Houston, Texas (Maura Gillison); Department of Head and Neck Surgery, New York Eye and Ear Infirmary of Mount Sinai, New York, New York (Stimson Schantz); Department of Otolaryngology, School of Medicine, New York Medical College, Valhalla, New York (Guo-Pei Yu); Department of Epidemiology, Bloomberg School of Public Health, Johns Hopkins University, Baltimore, Maryland (Gypsyamber D’Souza); Department of Surgery, School of Medicine, University of Utah, Salt Lake City, Utah (Marcus Monroe); Department of Health, Kinesiology and Recreation, College of Health, University of Utah, Salt Lake City, Utah (Jaewhan Kim); and Tisch Cancer Institute, Mount Sinai School of Medicine, New York, New York (Paolo Boffetta).
This work was supported by grants R21 CA158848, R03 CA113157, and R03 DE016611 from the National Institutes of Health (NIH). The individual studies were supported by the following—New York multicenter study: NIH (grants P01CA068384 and K07CA104231); Seattle study: NIH (grants R01CA048996 and R01DE012609); Iowa study: NIH (National Institute of Dental and Craniofacial Research (NIDCR) grant R01DE011979, NIDCR grant R01DE013110, and Fogarty International Research Collaboration Award TW001500) and Veterans Affairs Merit Review Funds; North Carolina (1994–1997) study: NIH (grant R01CA061188 and (partly) National Institute of Environmental Health Sciences grant P30ES010126); Tampa study: NIH (grants P01CA068384, R01DE013158, and K07CA104231); Los Angeles study: NIH (grants P50CA090388, R01DA011386, R03CA077954, T32CA009142, U01CA096134, and R21ES011667) and the Alper Research Program for Environmental Genomics of the UCLA Jonsson Comprehensive Cancer Center; Houston study: NIH (grants R01ES011740 and R01CA100264); Boston study: NIH (grants R01CA078609 and R01CA100679); US multicenter study: Intramural Program of the National Cancer Institute, NIH; Memorial Sloan Kettering Cancer Center study: NIH (grant R01CA051845); Seattle–Larynx, Esophagus, and Oral Cavity (LEO) Study: NIH (grant R01CA030022); North Carolina (2002–2006) study: NIH (National Cancer Institute grant R01CA90731-01 and National Institute of Environmental Health Sciences grant P30ES010126); Human Papillomavirus (HPV) Oral Transmission Study in Partners Over Time (HOTSPOT): Johns Hopkins Richard Gelb Cancer Prevention Award; Baltimore study: NIH (grant DE016631).
We thank David Baraghosh for his contribution to the validation portion of the analysis.
Conflict of interest: none declared.
REFERENCES
- 1. Global Cancer Observatory, International Agency for Research on Cancer Cancer today: data visualization tools for exploring the global cancer burden in 2018. http://gco.iarc.fr/today/home. Accessed January 19, 2019.
- 2. American Cancer Society Cancer Facts and Figures 2018. Atlanta, GA: American Cancer Society; 2018. [Google Scholar]
- 3. Hashibe M, Brennan P, Chuang SC, et al. Interaction between tobacco and alcohol use and the risk of head and neck cancer: pooled analysis in the International Head and Neck Cancer Epidemiology Consortium. Cancer Epidemiol Biomarkers Prev. 2009;18(2):541–550. [DOI] [PMC free article] [PubMed] [Google Scholar]
- 4. Negri E, Boffetta P, Berthiller J, et al. Family history of cancer: pooled analysis in the International Head and Neck Cancer Epidemiology Consortium. Int J Cancer. 2009;124(2):394–401. [DOI] [PMC free article] [PubMed] [Google Scholar]
- 5. Conway DI, McMahon AD, Smith K, et al. Socioeconomic factors influence selection and participation in a population-based case-control study of head and neck cancer in Scotland. J Clin Epidemiol. 2008;61(11):1187–1193. [DOI] [PubMed] [Google Scholar]
- 6. Straif K, Benbrahim-Tallaa L, Baan R, et al. WHO International Agency for Research on Cancer Monograph Working Group. A review of human carcinogens—part C: metals, arsenic, dusts, and fibres. Lancet Oncol. 2009;10(5):453–454. [DOI] [PubMed] [Google Scholar]
- 7. Baan R, Grosse Y, Straif K, et al. WHO International Agency for Research on Cancer Monograph Working Group. A review of human carcinogens—part F: chemical agents and related occupations. Lancet Oncol. 2009;10(12):1143–1144. [DOI] [PubMed] [Google Scholar]
- 8. Hashibe M, McKay JD, Curado MP, et al. Multiple ADH genes are associated with upper aerodigestive cancers. Nat Genet. 2008;40(6):707–709. [DOI] [PubMed] [Google Scholar]
- 9. Chaturvedi AK, Anderson WF, Lortet-Tieulent J, et al. Worldwide trends in incidence rates for oral cavity and oropharyngeal cancers. J Clin Oncol. 2013;31(36):4550–4559. [DOI] [PMC free article] [PubMed] [Google Scholar]
- 10. Lee YC, Boffetta P, Sturgis EM, et al. Involuntary smoking and head and neck cancer risk: pooled analysis in the International Head and Neck Cancer Epidemiology Consortium. Cancer Epidemiol Biomarkers Prev. 2008;17(8):1974–1981. [DOI] [PMC free article] [PubMed] [Google Scholar]
- 11. Berthiller J, Lee YC, Boffetta P, et al. Marijuana smoking and the risk of head and neck cancer: pooled analysis in the INHANCE Consortium. Cancer Epidemiol Biomarkers Prev. 2009;18(5):1544–1551. [DOI] [PMC free article] [PubMed] [Google Scholar]
- 12. Gaudet MM, Olshan AF, Chuang SC, et al. Body mass index and risk of head and neck cancer in a pooled analysis of case-control studies in the International Head and Neck Cancer Epidemiology (INHANCE) Consortium. Int J Epidemiol. 2010;39(4):1091–1102. [DOI] [PMC free article] [PubMed] [Google Scholar]
- 13. Galeone C, Tavani A, Pelucchi C, et al. Coffee and tea intake and risk of head and neck cancer: pooled analysis in the International Head and Neck Cancer Epidemiology Consortium. Cancer Epidemiol Biomarkers Prev. 2010;19(7):1723–1736. [DOI] [PMC free article] [PubMed] [Google Scholar]
- 14. Guha N, Boffetta P, Wünsch Filho V, et al. Oral health and risk of squamous cell carcinoma of the head and neck and esophagus: results of two multicentric case-control studies. Am J Epidemiol. 2007;166(10):1159–1173. [DOI] [PubMed] [Google Scholar]
- 15. La Vecchia C. Mouthwash and oral cancer risk: an update. Oral Oncol. 2009;45(3):198–200. [DOI] [PubMed] [Google Scholar]
- 16. Nicolotti N, Chuang SC, Cadoni G, et al. Recreational physical activity and risk of head and neck cancer: a pooled analysis within the International Head and Neck Cancer Epidemiology (INHANCE) Consortium [published correction appears in Eur J Epidemiol. 2011;26(10):827]. Eur J Epidemiol. 2011;26(8):619–628. [DOI] [PubMed] [Google Scholar]
- 17. Heck JE, Berthiller J, Vaccarella S, et al. Sexual behaviours and the risk of head and neck cancers: a pooled analysis in the International Head and Neck Cancer Epidemiology (INHANCE) Consortium. Int J Epidemiol. 2010;39(1):166–181. [DOI] [PMC free article] [PubMed] [Google Scholar]
- 18. Freedman AN, Seminara D, Gail MH, et al. Cancer risk prediction models: a workshop on development, evaluation, and application. J Natl Cancer Inst. 2005;97(10):715–723. [DOI] [PubMed] [Google Scholar]
- 19. Thrift AP, Kendall BJ, Pandeya N, et al. A model to determine absolute risk for esophageal adenocarcinoma. Clin Gastroenterol Hepatol. 2013;11(2):138–144.e2. [DOI] [PubMed] [Google Scholar]
- 20. Tikka T, Pracy P, Paleri V. Refining the head and neck cancer referral guidelines: a two-centre analysis of 4715 referrals. Clin Otolaryngol. 2016;41(1):66–75. [DOI] [PubMed] [Google Scholar]
- 21. Koyanagi YN, Ito H, Oze I, et al. Development of a prediction model and estimation of cumulative risk for upper aerodigestive tract cancer on the basis of the aldehyde dehydrogenase 2 genotype and alcohol consumption in a Japanese population. Eur J Cancer Prev. 2017;26(1):38–47. [DOI] [PMC free article] [PubMed] [Google Scholar]
- 22. Winn DM, Lee YC, Hashibe M, et al. The INHANCE Consortium: toward a better understanding of the causes and mechanisms of head and neck cancer. Oral Dis. 2015;21(6):685–693. [DOI] [PubMed] [Google Scholar]
- 23. Muscat JE, Richie JP Jr, Thompson S, et al. Gender differences in smoking and risk for oral cancer. Cancer Res. 1996;56(22):5192–5197. [PubMed] [Google Scholar]
- 24. Rosenblatt KA, Daling JR, Chen C, et al. Marijuana use and risk of oral squamous cell carcinoma. Cancer Res. 2004;64(11):4049–4054. [DOI] [PubMed] [Google Scholar]
- 25. Smith EM, Hoffman HT, Summersgill KS, et al. Human papillomavirus and risk of oral cancer. Laryngoscope. 1998;108(7):1098–1103. [DOI] [PubMed] [Google Scholar]
- 26. Olshan AF, Weissler MC, Watson MA, et al. GSTM1, GSTT1, GSTP1, CYP1A1, and NAT1 polymorphisms, tobacco use, and the risk of head and neck cancer. Cancer Epidemiol Biomarkers Prev. 2000;9(2):185–191. [PubMed] [Google Scholar]
- 27. Elahi A, Zheng Z, Park J, et al. The human OGG1 DNA repair enzyme and its association with orolaryngeal cancer risk. Carcinogenesis. 2002;23(7):1229–1234. [DOI] [PubMed] [Google Scholar]
- 28. Cui Y, Morgenstern H, Greenland S, et al. Polymorphism of xeroderma pigmentosum group G and the risk of lung cancer and squamous cell carcinomas of the oropharynx, larynx and esophagus. Int J Cancer. 2006;118(3):714–720. [DOI] [PubMed] [Google Scholar]
- 29. Zhang Z, Shi Q, Liu Z, et al. Polymorphisms of methionine synthase and methionine synthase reductase and risk of squamous cell carcinoma of the head and neck: a case-control analysis. Cancer Epidemiol Biomarkers Prev. 2005;14(5):1188–1193. [DOI] [PubMed] [Google Scholar]
- 30. Peters ES, McClean MD, Liu M, et al. The ADH1C polymorphism modifies the risk of squamous cell carcinoma of the head and neck associated with alcohol and tobacco use. Cancer Epidemiol Biomarkers Prev. 2005;14(2):476–482. [DOI] [PubMed] [Google Scholar]
- 31. Blot WJ, McLaughlin JK, Winn DM, et al. Smoking and drinking in relation to oral and pharyngeal cancer. Cancer Res. 1988;48(11):3282–3287. [PubMed] [Google Scholar]
- 32. Schantz SP, Zhang ZF, Spitz MS, et al. Genetic susceptibility to head and neck cancer: interaction between nutrition and mutagen sensitivity. Laryngoscope. 1997;107(6):765–781. [DOI] [PubMed] [Google Scholar]
- 33. Rogers MA, Thomas DB, Davis S, et al. A case-control study of element levels and cancer of the upper aerodigestive tract. Cancer Epidemiol Biomarkers Prev. 1993;2(4):305–312. [PubMed] [Google Scholar]
- 34. Divaris K, Olshan AF, Smith J, et al. Oral health and risk for head and neck squamous cell carcinoma: the Carolina Head and Neck Cancer Study. Cancer Causes Control. 2010;21(4):567–575. [DOI] [PMC free article] [PubMed] [Google Scholar]
- 35. D’Souza G, Gross ND, Pai SI, et al. Oral human papillomavirus (HPV) infection in HPV-positive patients with oropharyngeal cancer and their partners. J Clin Oncol. 2014;32(23):2408–2415. [DOI] [PMC free article] [PubMed] [Google Scholar]
- 36. D’Souza G, Kreimer AR, Viscidi R, et al. Case-control study of human papillomavirus and oropharyngeal cancer. N Engl J Med. 2007;356(19):1944–1956. [DOI] [PubMed] [Google Scholar]
- 37. Bruzzi P, Green SB, Byar DP, et al. Estimating the population attributable risk for multiple risk factors using case-control data. Am J Epidemiol. 1985;122(5):904–914. [DOI] [PubMed] [Google Scholar]
- 38. Surveillance, Epidemiology, and End Results Program, National Cancer Institute Surveillance, Epidemiology, and End Results (SEER) Program ( www.seer.cancer.gov) SEER*Stat Database: Incidence - SEER 9 Regs Research Data, Nov 2015 Sub (1973–2013) <Katrina/Rita Population Adjustment> - Linked to County Attributes - Total U.S., 1969–2014 Counties, National Cancer Institute, DCCPS, Surveillance Research Program, Released April 2016, Based on the November 2015 Submission Bethesda, MD: National Cancer Institute; 2015. [Google Scholar]
- 39. Freedman AN, Slattery ML, Ballard-Barbash R, et al. Colorectal cancer risk prediction tool for white men and women without known susceptibility. J Clin Oncol. 2009;27(5):686–693. [DOI] [PMC free article] [PubMed] [Google Scholar]
- 40. Surveillance, Epidemiology, and End Results Program, National Cancer Institute Surveillance, Epidemiology, and End Results (SEER) Program ( www.seer.cancer.gov) SEER*Stat Database: Mortality - All COD, Aggregated With State, Total U.S. (1969–2009) <Katrina/Rita Population Adjustment>, National Cancer Institute, DCCPS, Surveillance Research Program, Released April 2012. Underlying Mortality Data Provided by NCHS ( www.cdc.gov/nchs). Bethesda, MD: National Cancer Institute; 2012. [Google Scholar]
- 41. Baker SG. The central role of receiver operating characteristic (ROC) curves in evaluating tests for the early detection of cancer. J Natl Cancer Inst. 2003;95(7):511–515. [DOI] [PubMed] [Google Scholar]
- 42. Steyerberg EW. Clinical Prediction Models. New York, NY: Springer Publishing Company; 2009:270–279. [Google Scholar]
- 43. Anantharaman D, Marron M, Lagiou P, et al. Population attributable risk of tobacco and alcohol for upper aerodigestive tract cancer. Oral Oncol. 2011;47(8):725–731. [DOI] [PubMed] [Google Scholar]
- 44. Conway DI, Brenner DR, McMahon AD, et al. Estimating and explaining the effect of education and income on head and neck cancer risk: INHANCE Consortium pooled analysis of 31 case-control studies from 27 countries. Int J Cancer. 2015;136(5):1125–1139. [DOI] [PMC free article] [PubMed] [Google Scholar]
- 45. Gigerenzer G, Gaissmaier W, Kurz-Milcke E, et al. Helping doctors and patients make sense of health statistics. Psychol Sci Public Interest. 2007;8(2):53–96. [DOI] [PubMed] [Google Scholar]
- 46. Wentzensen N, Eldridge RC. Invited commentary: clinical utility of prediction models for rare outcomes—the example of pancreatic cancer. Am J Epidemiol. 2015;182(1):35–38. [DOI] [PMC free article] [PubMed] [Google Scholar]
- 47. Ten Haaf K, Jeon J, Tammemägi MC, et al. Risk prediction models for selection of lung cancer screening candidates: a retrospective validation study. PLoS Med. 2017;14(4):e1002277. [DOI] [PMC free article] [PubMed] [Google Scholar]
- 48. Katki HA, Kovalchik SA, Petito LC, et al. Implications of nine risk prediction models for selecting ever-smokers for computed tomography lung cancer screening. Ann Intern Med. 2018;169(1):10–19. [DOI] [PMC free article] [PubMed] [Google Scholar]
- 49. US Preventive Services Task Force Final recommendation statement. Oral cancer: screening. 2013. https://www.uspreventiveservicestaskforce.org/Page/Document/RecommendationStatementFinal/oral-cancer-screening1. Accessed September 20, 2018.
- 50. Subramanian S, Sankaranarayanan R, Bapat B, et al. Cost-effectiveness of oral cancer screening: results from a cluster randomized controlled trial in India. Bull World Health Organ. 2009;87(3):200–206. [DOI] [PMC free article] [PubMed] [Google Scholar]
- 51. Hashibe M, Hunt J, Wei M, et al. Tobacco, alcohol, body mass index, physical activity, and the risk of head and neck cancer in the Prostate, Lung, Colorectal, and Ovarian (PLCO) cohort. Head Neck. 2013;35(7):914–922. [DOI] [PubMed] [Google Scholar]
- 52. Pleis JR, Ward BW, Lucas JW. Summary health statistics for U.S. adults: National Health Interview Survey, 2009. Vital Health Stat 10. 2010;249:1–207. [PubMed] [Google Scholar]
Associated Data
This section collects any data citations, data availability statements, or supplementary materials included in this article.