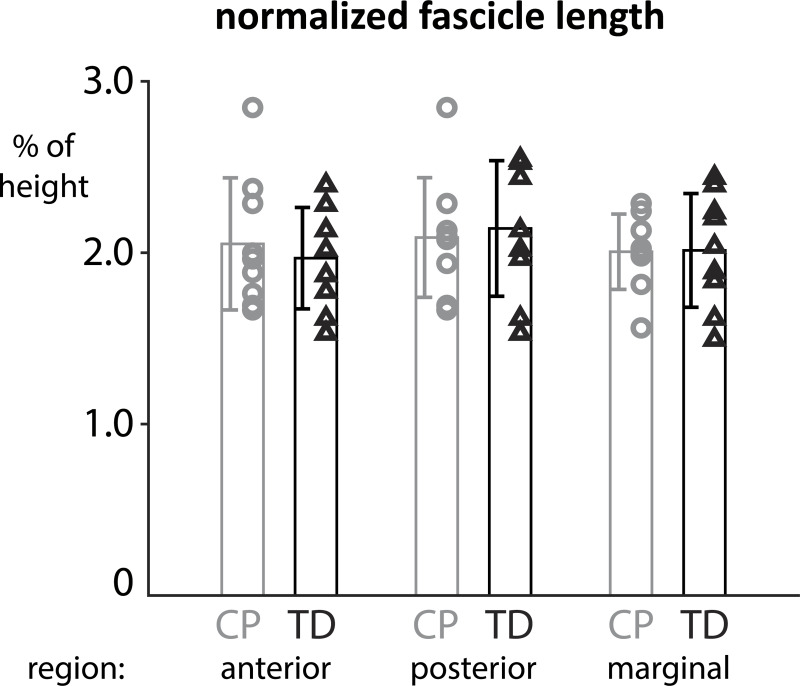
Fig 3 is incorrect. The y-axis ranges 0, 10, 20, 30. The y-axis should range 0, 1.0, 2.0, 3.0. The authors have provided a corrected version here.
Fig 3. Normalized fascicle lengths in the three regions of the soleus show heterogeneities within and between groups but are not significantly different between CP and TD cohorts.
Reference
- 1.Sahrmann AS, Stott NS, Besier TF, Fernandez JW, Handsfield GG (2019) Soleus muscle weakness in cerebral palsy: Muscle architecture revealed with Diffusion Tensor Imaging. PLoS ONE 14(2): e0205944 10.1371/journal.pone.0205944 [DOI] [PMC free article] [PubMed] [Google Scholar]


